


Deep Learning Performance on MLPerf™ Training v1.0 with Dell EMC DSS 8440 Servers
Mon, 16 Aug 2021 19:23:48 -0000
|Read Time: 0 minutes
Abstract
This blog provides MLPerf™ Training v1.0 data center closed results for Dell EMC DSS 8440 servers running the MLPerf training benchmarks. Our results show optimal training performance for the DSS 8440 configurations on which we chose to run training benchmarks. Also, we can expect higher performance gains by upgrading to the NVIDIA A100 accelerators running the deep learning workload on DSS 8440 servers.
Background
The DSS 8440 server allows up to 10 double-wide GPUs in the PCIe. This configuration makes it an aptly suited server for high compute that is required to run workloads such as deep learning training.
MLPerf Training v1.0 benchmark models address problems such as image classification, medical image segmentation, light weight and heavy weight object detection, speech recognition, natural language processing (NLP), and recommendation and reinforcement learning.
As of June 2021, MLPerf Training has become more mature and has successfully completed v1.0, which is the fourth submission round of MLPerf training. See this blog for new features of the MLPerf Training v1.0 benchmark.
Testbed
The results for the models that are submitted with the DSS 8440 server include:
- 1 x DSS 8440 (x8 A100-PCIE-40GB)—All eight models, which include ResNet50, SSD, MaskRCNN, U-Net3D, BERT, DLRM, Minigo, and RNN-T
- 2 x DSS 8440 (x16 A100-PCIE-40GB)—Two-nodes ResNet50
- 3 x DSS 8440 (x24 A100-PCIe-40GB)—Three-nodes ResNet50
- 1 x DSS 8440 (x8 A100-PCIE-40GB, connected with NVLink Bridges)—BERT
We chose BERT with NVLink Bridge because BERT has plenty of card-to-card communication that allows NVLink Bridge benefits.
The following table shows a single node DSS8440 hardware configuration and software environment:
Table 1: DSS 8440 node specification
Hardware | |
Platform | DSS 8440 |
CPUs per node | 2 x Intel Xeon Gold 6248R CPU @ 3.00 GHz |
Memory per node | 768 GB (24 x 32 GB) |
GPU | 8 x NVIDIA A100-PCIE-40GB (250 W) |
Host storage | 1x 1.5 TB NVMe + 2x 512 GB SSD |
Host network | 1x ConnectX-5 IB EDR 100Gb/Sec |
Software | |
Operating system | CentOS Linux release 8.2.2004 (Core) |
GPU driver | 460.32.03 |
OFED | 5.1-2.5.8.0 |
CUDA | 11.2 |
MXNet | NGC MXNet 21.05 |
PyTorch | NGC PyTorch 21.05 |
TensorFlow | NGC TensorFlow 21.05-tf1 |
cuBLAS | 11.5.1.101 |
NCCL version | 2.9.8 |
cuDNN | 8.2.0.51 |
TensorRT version | 7.2.3.4 |
Open MPI | 4.1.1rc1 |
Singularity | 3.6.4-1.el8 |
MLPerf Training 1.0 benchmark results
Single node performance
The following figure shows the performance of the DSS 8440 server on all training models:
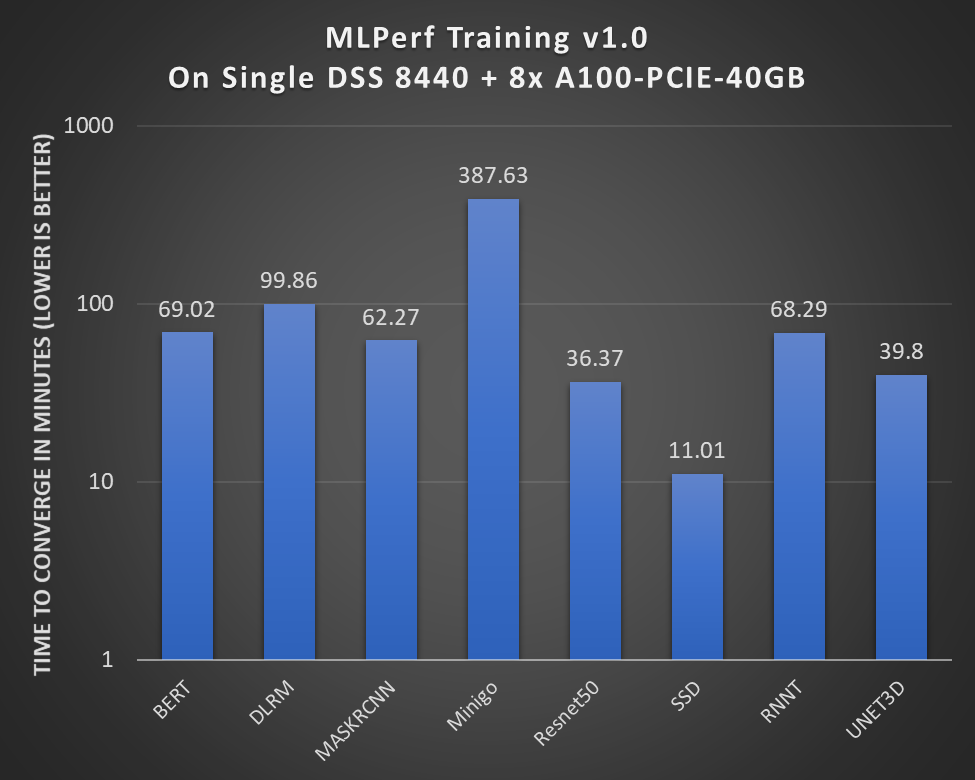
Figure 1: Performance of a single node DSS 8440 with 8 x A100-PCIE-40GB GPUs
The y axis is an exponentially scaled axis. MLPerf training measures the submission by assessing how many minutes it took for a system under test to converge to the target accuracy while meeting all the rules.
Key takeaways include:
- All our results were officially submitted to the MLCommons™ Consortium and are verified.
- The DSS 8440 server was able to run all the models in the MLPerf training v1.0 benchmark across different areas such as vision, language, commerce, and research.
- The DSS8440 server is a good candidate to fit into the high performance per watt category.
- With a thermal design power (TDP) of 250 W, the A100 PCIE 40 GB offers high throughput for all the benchmarks. This throughput, when compared to other GPUs that have a higher TDP, offers almost similar throughputs for many benchmarks (see the results here).
- The DLRM model takes more time to converge because the underlying Merlin HurgeCTR framework implementation is optimized for an SXM4 form factor. Our Dell EMC PowerEdge XE8545 Server supports this form factor.
Overall, by upgrading the accelerator to an NVIDIA A100 PCIE 40 GB, 2.1 to 2.4 times performance improvements can be expected, compared to the previous MLPerf Training v0.7 round that used previous generation NVIDIA V100 PCIe GPUs.
Multinode scaling
Multinode training is critical for large machine learning workloads. It provides a significant amount of compute power, which accelerates the training process linearly. While a single node training certainly converges, multinode training offers higher throughput and converges faster.
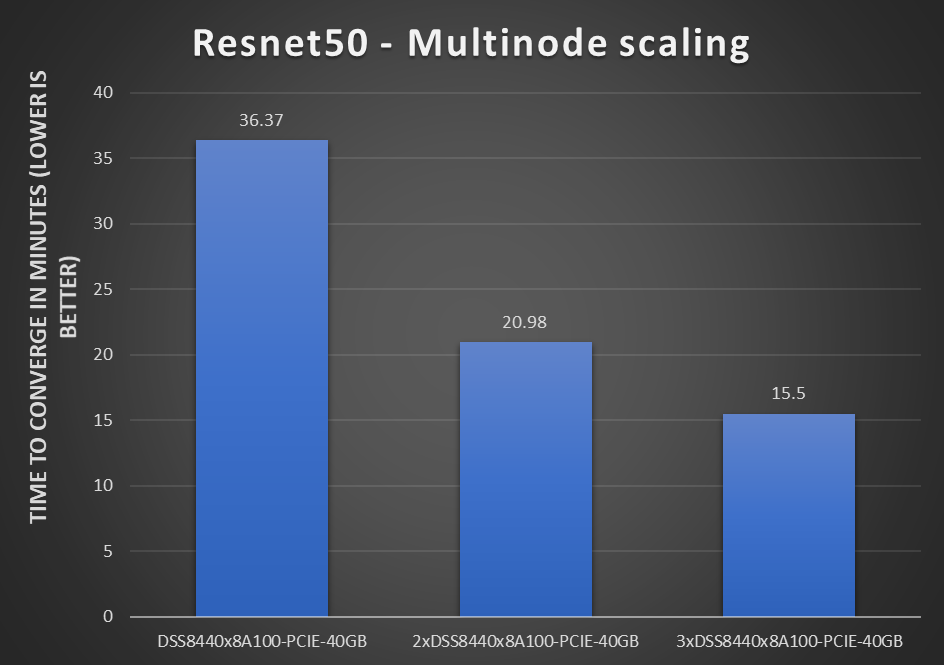
Figure 2: Resnet50 multinode scaling on a DSS8440 server with one, two, and three nodes
These results are for multiple (up to three) DSS 8440 servers that are tested with the Resnet50 model.
Note the following about these results:
- Adding more nodes to the same training task helps to reduce the overall turnaround time of training. This reduction helps data scientists to adjust their models rapidly. Some larger models might run days on the fastest single GPU server; multinode training can reduce the time to hours or minutes.
- To be comparable and comply with the RCP rules in MLPerf training v1.0, we keep the global batch sizes the same with two and three nodes. This configuration is considered strong scaling as the workload and the global batch sizes do not increase with the GPU numbers for the multinode scaling setting. Because of RCP constraints, we cannot see linear scaling.
- We see higher throughput numbers with larger batch sizes.
- The ResNet50 model scales well on the DSS 8440 server.
In general, adding more DSS 8440 servers to a large deep learning training problem helps to reduce time spent on those training workloads.
NVLink Bridges
NVLINK Bridges are bridge boards that link a pair of GPUs to help workloads that exchange data frequently between GPUs. Those A100 PCIe GPUs on the DSS 8440 server can support three bridges per each GPU pair. The following figure shows the difference for the BERT model with and without NVLink Bridges:
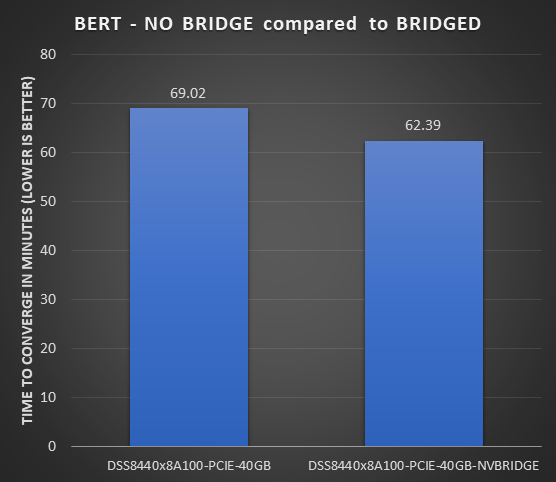
Figure 3: BERT converge-time difference without and with NVLink Bridges on a DSS 8440 server
- An NVLink Bridge offers over 10 percent faster convergence for the BERT model.
- Because the topology of the NVLink Bridge hardware is relatively new, there might be opportunities for this topology to translate into higher performance gains as the supporting software matures.
Conclusion and future work
Dell EMC DSS 8440 servers are an excellent fit for modern deep learning training workloads helping solve different problems spanning image classification, medical image segmentation, light weight and heavy weight object detection, speech recognition, natural language processing (NLP), recommendation and reinforcement learning. These servers offer high throughput and are an excellent scalable medium to run multinode jobs. They offer faster convergence while meeting training constraints. Paring the NVLink Bridge with NVIDIA A100 PCIE accelerators can improve throughput for higher inter-GPU communication models like BERT. Furthermore, data center administrators can expect to improve deep learning training throughput by orders of magnitude by upgrading to NVIDIA A100 accelerators from previous generation accelerators if their data center is already using DSS 8440 servers.
With recent support of the A100-PCIe-80GB GPU on the DSS8440 server, we plan to conduct MLPerf training benchmarks with 10 GPUs in each server, which will allow us to provide a comparison of scale-up and scale-out performance.
Related Blog Posts

Quantifying Performance of Dell EMC PowerEdge R7525 Servers with NVIDIA A100 GPUs for Deep Learning Inference
Tue, 17 Nov 2020 21:10:22 -0000
|Read Time: 0 minutes
The Dell EMC PowerEdge R7525 server provides exceptional MLPerf Inference v0.7 Results, which indicate that:
- Dell Technologies holds the #1 spot in performance per GPU with the NVIDIA A100-PCIe GPU on the DLRM-99 Server scenario
- Dell Technologies holds the #1 spot in performance per GPU with the NVIDIA A100-PCIe on the DLRM-99.9 Server scenario
- Dell Technologies holds the #1 spot in performance per GPU with the NVIDIA A100-PCIe on the ResNet-50 Server scenario
Summary
In this blog, we provide the performance numbers of our recently released Dell EMC PowerEdge R7525 server with two NVIDIA A100 GPUs on all the results of the MLPerf Inference v0.7 benchmark. Our results indicate that the PowerEdge R7525 server is an excellent choice for inference workloads. It delivers optimal performance for different tasks that are in the MLPerf Inference v0.7 benchmark. These tasks include image classification, object detection, medical image segmentation, speech to text, language processing, and recommendation.
The PowerEdge R7525 server is a two-socket, 2U rack server that is designed to run workloads using flexible I/O and network configurations. The PowerEdge R7525 server features the 2nd Gen AMD EPYC processor, supports up to 32 DIMMs, has PCI Express (PCIe) Gen 4.0-enabled expansion slots, and provides a choice of network interface technologies to cover networking options.
The following figure shows the front view of the PowerEdge R7525 server:
Figure 1. Dell EMC PowerEdge R7525 server
The PowerEdge R7525 server is designed to handle demanding workloads and for AI applications such as AI training for different kinds of models and inference for different deployment scenarios. The PowerEdge R7525 server supports various accelerators such as NVIDIA T4, NVIDIA V100S, NVIDIA RTX, and NVIDIA A100 GPU s. The following sections compare the performance of NVIDIA A100 GPUs with NVIDIA T4 and NVIDIA RTX GPUs using MLPerf Inference v0.7 as a benchmark.
The following table provides details of the PowerEdge R7525 server configuration and software environment for MLPerf Inference v0.7:
Component | Description |
Processor | AMD EPYC 7502 32-Core Processor |
Memory | 512 GB (32 GB 3200 MT/s * 16) |
Local disk | 2x 1.8 TB SSD (No RAID) |
Operating system | CentOS Linux release 8.1 |
GPU | NVIDIA A100-PCIe-40G, T4-16G, and RTX8000 |
CUDA Driver | 450.51.05 |
CUDA Toolkit | 11.0 |
Other CUDA-related libraries | TensorRT 7.2, CUDA 11.0, cuDNN 8.0.2, cuBLAS 11.2.0, libjemalloc2, cub 1.8.0, tensorrt-laboratory mlperf branch |
Other software stack | Docker 19.03.12, Python 3.6.8, GCC 5.5.0, ONNX 1.3.0, TensorFlow 1.13.1, PyTorch 1.1.0, torchvision 0.3.0, PyCUDA 2019.1, SacreBLEU 1.3.3, simplejson, OpenCV 4.1.1 |
System profiles | Performance |
For more information about how to run the benchmark, see Running the MLPerf Inference v0.7 Benchmark on Dell EMC Systems.
MLPerf Inference v0.7 performance results
The MLPerf inference benchmark measures how fast a system can perform machine learning (ML) inference using a trained model in various deployment scenarios. The following results represent the Offline and Server scenarios of the MLPerf Inference benchmark. For more information about different scenarios, models, datasets, accuracy targets, and latency constraints in MLPerf Inference v0.7, see Deep Learning Performance with MLPerf Inference v0.7 Benchmark.
In the MLPerf inference evaluation framework, the LoadGen load generator sends inference queries to the system under test, in our case, the PowerEdge R7525 server with various GPU configurations. The system under test uses a backend (for example, TensorRT, TensorFlow, or PyTorch) to perform inferencing and sends the results back to LoadGen.
MLPerf has identified four different scenarios that enable representative testing of a wide variety of inference platforms and use cases. In this blog, we discuss the Offline and Server scenario performance. The main differences between these scenarios are based on how the queries are sent and received:
- Offline—One query with all samples is sent to the system under test. The system under test can send the results back once or multiple times in any order. The performance metric is samples per second.
- Server—Queries are sent to the system under test following a Poisson distribution (to model real-world random events). One query has one sample. The performance metric is queries per second (QPS) within latency bound.
Note: Both the performance metrics for Offline and Server scenario represent the throughput of the system.
In all the benchmarks, two NVIDIA A100 GPUs outperform eight NVIDIA T4 GPUs and three NVIDIA RTX800 GPUs for the following models:
- ResNet-50 image classification model
- SSD-ResNet34 object detection model
- RNN-T speech recognition model
- BERT language processing model
- DLRM recommender model
- 3D U-Net medical image segmentation model
The following graphs show PowerEdge R7525 server performance with two NVIDIA A100 GPUs, eight NVIDIA T4 GPUs, and three NVIDIA RTX8000 GPUs with 99% accuracy target benchmarks and 99.9% accuracy targets for applicable benchmarks:
- 99% accuracy (default accuracy) target benchmarks: ResNet-50, SSD-Resnet34, and RNN-T
- 99% and 99.9% accuracy (high accuracy) target benchmarks: DLRM, BERT, and 3D-Unet
99% accuracy target benchmarks
ResNet-50
The following figure shows results for the ResNet-50 model:
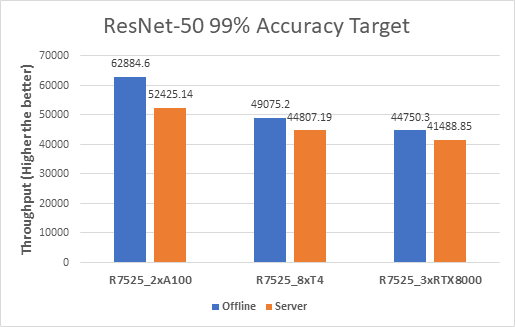
Figure 2. ResNet-50 Offline and Server inference performance
From the graph, we can derive the per GPU values. We divide the system throughput (containing all the GPUs) by the number of GPUs to get the Per GPU results as they are linearly scaled.
SSD-Resnet34
The following figure shows the results for the SSD-Resnet34 model:
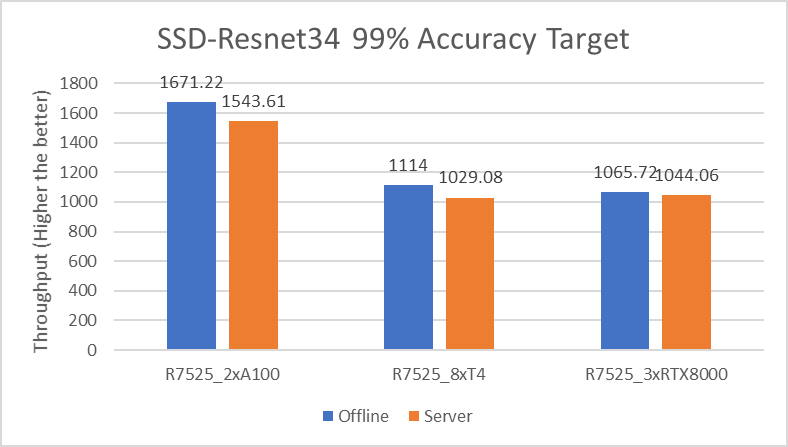
Figure 3. SSD-Resnet34 Offline and Server inference performance
RNN-T
The following figure shows the results for the RNN-T model:
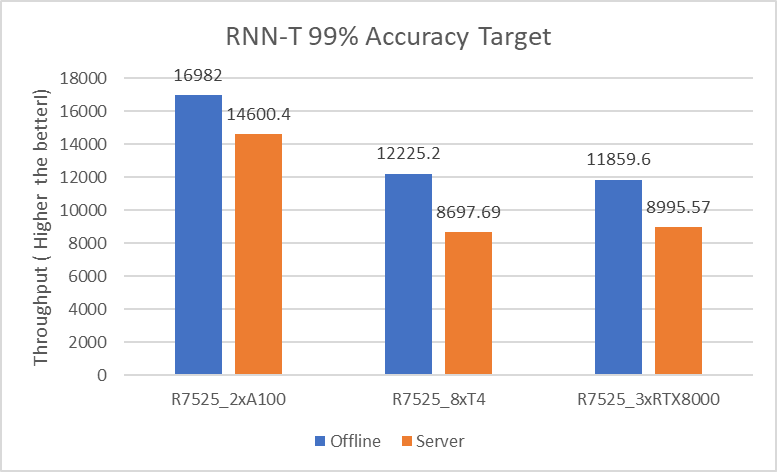
Figure 4. RNN-T Offline and Server inference performance
99.9% accuracy target benchmarks
DLRM
The following figures show the results for the DLRM model with 99% and 99.9% accuracy:
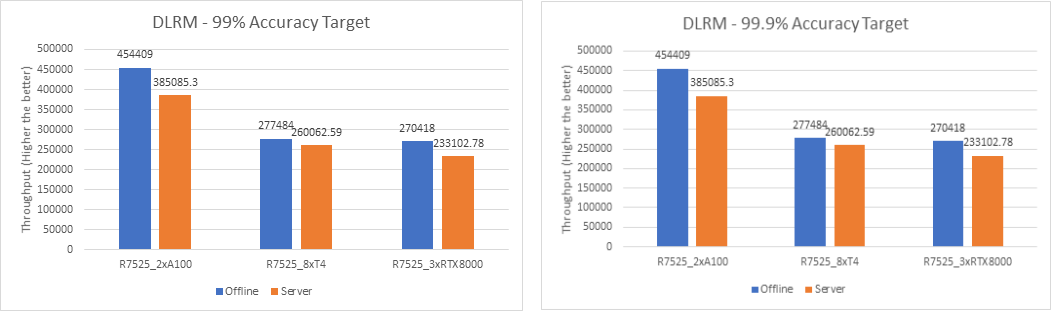
Figure 5. DLRM Offline and Server Scenario inference performance – 99% and 99.9% accuracy
For the DLRM recommender and 3D U-Net medical image segmentation (see Figure 7) models, both 99% and 99.9% accuracy have the same throughput. The 99.9% accuracy benchmark also satisfies the required accuracy constraints with the same throughput as that of 99%.
BERT
The following figures show the results for the BERT model with 99% and 99.9% accuracy:
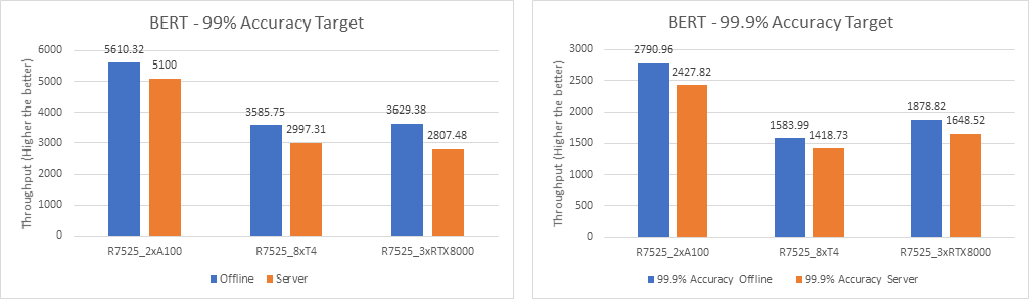
Figure 6. BERT Offline and Server inference performance – 99% and 99.9% accuracy
For the BERT language processing model, two NVIDIA A100 GPUs outperform eight NVIDIA T4 GPUs and three NVIDIA RTX8000 GPUs. However, the performance of three NVIDIA RTX8000 GPUs is a little better than that of eight NVIDIA T4 GPUs.
3D U-Net
For the 3D-Unet medical image segmentation model, only the Offline scenario benchmark is available.
The following figure shows the results for the 3D U-Net model Offline scenario:
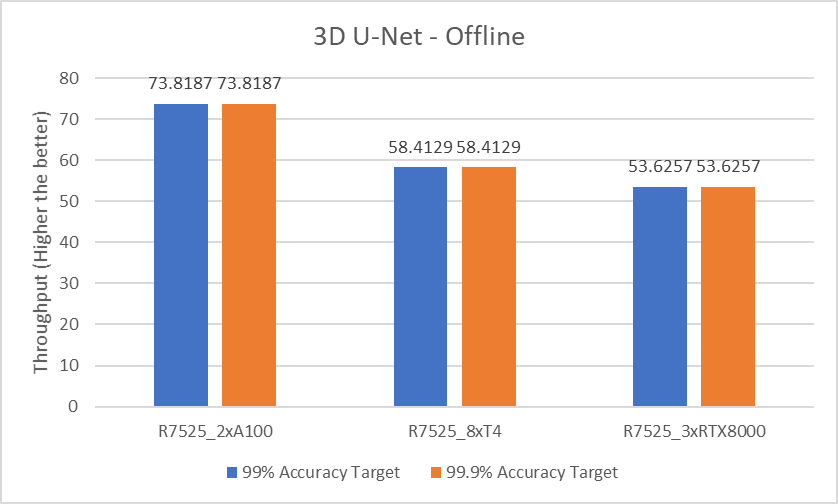
Figure 7. 3D U-Net Offline inference performance
For the 3D-Unet medical image segmentation model, since there is only offline scenario benchmark for 3D-Unet the above graph represents only Offline scenario.
The following table compares the throughput between two NVIDIA A100 GPUs, eight NVIDIA T4 GPUs, and three NVIDIA RTX8000 GPUs with 99% accuracy target benchmarks and 99.9% accuracy targets:
Model | Scenario | Accuracy | 2 x A100 GPUs vs 8 x T4 GPUs | 2 x A100 GPUs vs 3 x RTX8000 GPUs |
ResNet-50 | Offline | 99% | 5.21x | 2.10x |
Server | 4.68x | 1.89x | ||
SSD-Resnet34 | Offline | 6.00x | 2.35x | |
Server | 5.99x | 2.21x | ||
RNN-T | Offline | 5.55x | 2.14x | |
Server | 6.71x | 2.43x | ||
DLRM | Offline | 6.55x | 2.52x | |
Server | 5.92x | 2.47x | ||
Offline | 99.9% | 6.55x | 2.52x | |
Server | 5.92x | 2.47x | ||
BERT | Offline | 99% | 6.26x | 2.31x |
Server | 6.80x | 2.72x | ||
Offline | 99.9% | 7.04x | 2.22x | |
Server | 6.84x | 2.20x | ||
3D U-Net | Offline | 99% | 5.05x | 2.06x |
Server | 99.9% | 5.05x | 2.06x |
Conclusion
With support of NVIDIA A100, NVIDIA T4, or NVIDIA RTX8000 GPUs, Dell EMC PowerEdge R7525 server is an exceptional choice for various workloads that involve deep learning inference. However, the higher throughput that we observed with NVIDIA A100 GPUs translates to performance gains and faster business value for inference applications.
Dell EMC PowerEdge R7525 server with two NVIDIA A100 GPUs delivers optimal performance for various inference workloads, whether it is in a batch inference setting such as Offline scenario or Online inference setting such as Server scenario.
Next steps
In future blogs, we will discuss sizing the system (server and GPU configurations) correctly based on the type of workload (area and task).

Unveiling the Power of the PowerEdge XE9680 Server on the GPT-J Model from MLPerf™ Inference
Tue, 16 Jan 2024 18:30:32 -0000
|Read Time: 0 minutes
Abstract
For the first time, the latest release of the MLPerf™ inference v3.1 benchmark includes the GPT-J model to represent large language model (LLM) performance on different systems. As a key player in the MLPerf consortium since version 0.7, Dell Technologies is back with exciting updates about the recent submission for the GPT-J model in MLPerf Inference v3.1. In this blog, we break down what these new numbers mean and present the improvements that Dell Technologies achieved with the Dell PowerEdge XE9680 server.
MLPerf inference v3.1
MLPerf inference is a standardized test for machine learning (ML) systems, allowing users to compare performance across different types of computer hardware. The test helps determine how well models, such as GPT-J, perform on various machines. Previous blogs provide a detailed MLPerf inference introduction. For in-depth details, see Introduction to MLPerf inference v1.0 Performance with Dell Servers. For step-by-step instructions for running the benchmark, see Running the MLPerf inference v1.0 Benchmark on Dell Systems. Inference version v3.1 is the seventh inference submission in which Dell Technologies has participated. The submission shows the latest system performance for different deep learning (DL) tasks and models.
Dell PowerEdge XE9680 server
The PowerEdge XE9680 server is Dell’s latest two-socket, 6U air-cooled rack server that is designed for training and inference for the most demanding ML and DL large models.
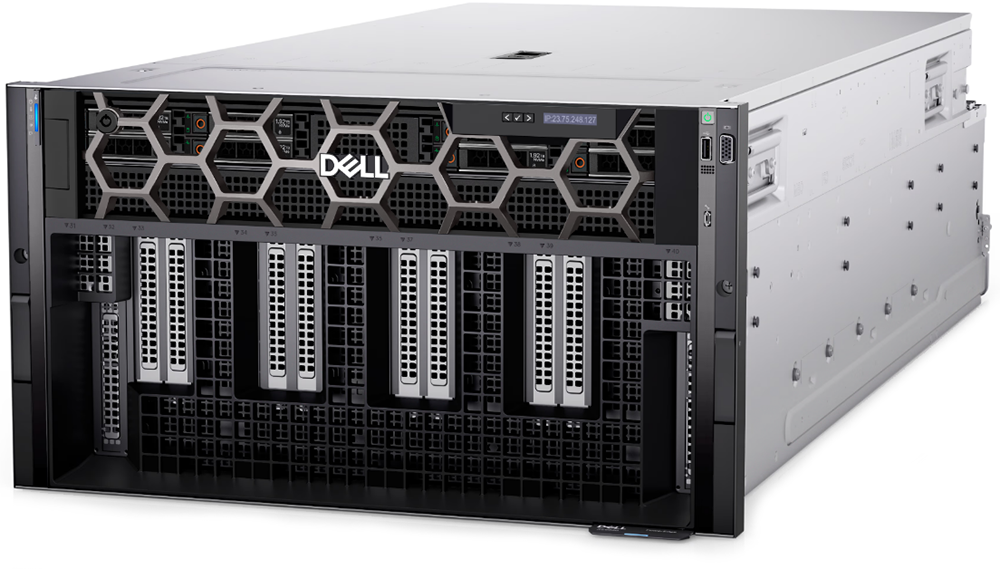
Figure 1. Dell PowerEdge XE9680 server
Key system features include:
- Two 4th Gen Intel Xeon Scalable Processors
- Up to 32 DDR5 DIMM slots
- Eight NVIDIA HGX H100 SXM 80 GB GPUs
- Up to 10 PCIe Gen5 slots to support the latest Gen5 PCIe devices and networking, enabling flexible networking design
- Up to eight U.2 SAS4/SATA SSDs (with fPERC12)/ NVMe drives (PSB direct) or up to 16 E3.S NVMe drives (PSB direct)
- A design to train and inference the most demanding ML and DL large models and run compute-intensive HPC workloads
The following figure shows a single NVIDIA H100 SXM GPU:
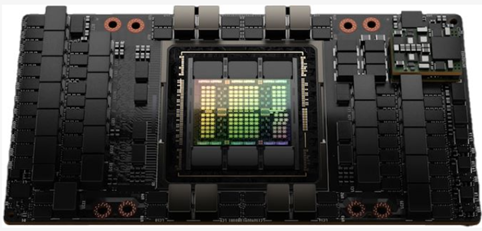
Figure 2. NVIDIA H100 SXM GPU
GPT-J model for inference
Language models take tokens as input and predict the probability of the next token or tokens. This method is widely used for essay generation, code development, language translation, summarization, and even understanding genetic sequences. The GPT-J model in MLPerf inference v3.1 has 6 B parameters and performs text summarization tasks on the CNN-DailyMail dataset. The model has 28 transformer layers, and a sequence length of 2048 tokens.
Performance updates
The official MLPerf inference v3.1 results for all Dell systems are published on https://mlcommons.org/benchmarks/inference-datacenter/. The PowerEdge XE9680 system ID is ID 3.1-0069.
After submitting the GPT-J model, we applied the latest firmware updates to the PowerEdge XE9680 server. The following figure shows that performance improved as a result:
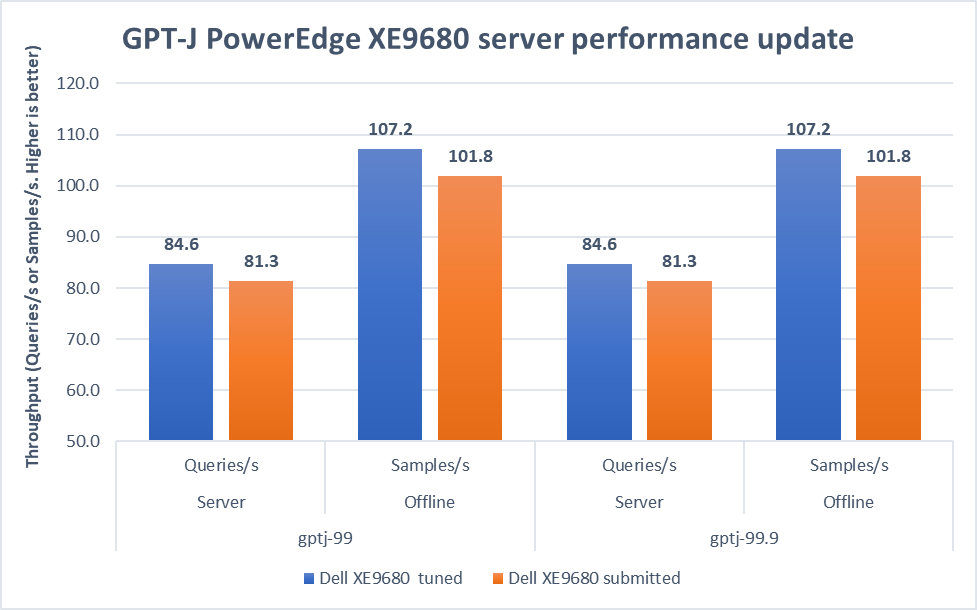
Figure 3. Improvement of the PowerEdge XE9680 server on GPT-J Datacenter 99 and 99.9, Server and Offline scenarios [1]
In both 99 and 99.9 Server scenarios, the performance increased from 81.3 to an impressive 84.6. This 4.1 percent difference showcases the server's capability under randomly fed inquires in the MLPerf-defined latency restriction. In the Offline scenarios, the performance saw a notable 5.3 percent boost from 101.8 to 107.2. These results mean that the server is even more efficient and capable of handling batch-based LLM workloads.
Note: For PowerEdge XE9680 server configuration details, see https://github.com/mlcommons/inference_results_v3.1/blob/main/closed/Dell/systems/XE9680_H100_SXM_80GBx8_TRT.json
Conclusion
This blog focuses on the updates of the GPT-J model in the v3.1 submission, continuing the journey of Dell’s experience with MLPerf inference. We highlighted the improvements made to the PowerEdge XE9680 server, showing Dell's commitment to pushing the limits of ML benchmarks. As technology evolves, Dell Technologies remains a leader, constantly innovating and delivering standout results.
[1] Unverified MLPerf® v3.1 Inference Closed GPT-J. Result not verified by MLCommons Association.
The MLPerf name and logo are registered and unregistered trademarks of MLCommons Association in the United States and other countries. All rights reserved. Unauthorized use is strictly prohibited. See www.mlcommons.org for more information.