


Choosing a PowerEdge Server and NVIDIA GPUs for AI Inference at the Edge

Dell Technologies submitted several benchmark results for the latest MLCommonsTM Inference v3.0 benchmark suite. An objective was to provide information to help customers choose a favorable server and GPU combination for their workload. This blog reviews the Edge benchmark results and provides information about how to determine the best server and GPU configuration for different types of ML applications.
Results overview
For computer vision workloads, which are widely used in security systems, industrial applications, and even in self-driven cars, ResNet and RetinaNet results were submitted. ResNet is an image classification task and RetinaNet is an object detection task. The following figures show that for intensive processing, the NVIDIA A30 GPU, which is a double-wide card, provides the best performance with almost two times more images per second than the NVIDIA L4 GPU. However, the NVIDIA L4 GPU is a single-wide card that requires only 43 percent of the energy consumption of the NVIDIA A30 GPU, considering nominal Thermal Design Power (TDP) of each GPU. This low-energy consumption provides a great advantage for applications that need lower power consumption or in environments that are more challenging to cool. The NVIDIA L4 GPU is the replacement for the best-selling NVIDIA T4 GPU, and provides twice the performance with the same form factor. Therefore, we see that this card is the best option for most Edge AI workloads.
Conversely, the NVIDIA A2 GPU exhibits the most economical price (compared to the NVIDIA A30 GPU's price), power consumption (TDP), and performance levels among all available options in the market. Therefore, if the application is compatible with this GPU, it has the potential to deliver the lowest total cost of ownership (TCO).
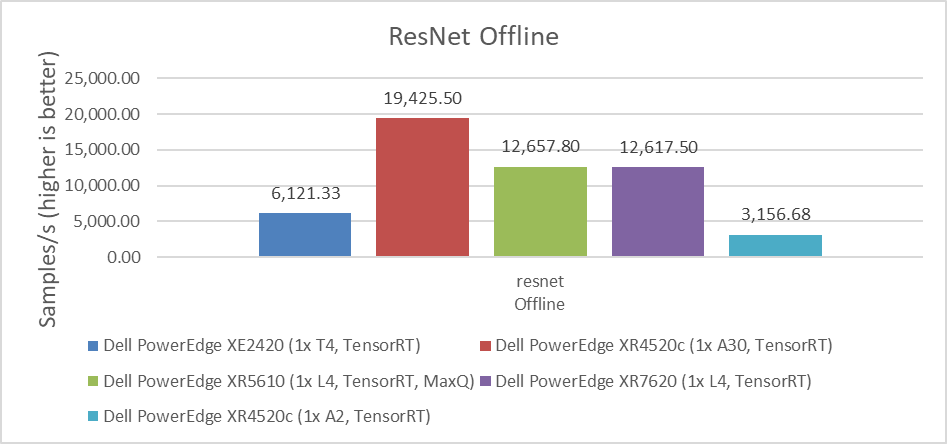
Figure 1: Performance comparison of NVIDIA A30, L4, T4, and A2 GPUs for the ResNet Offline benchmark
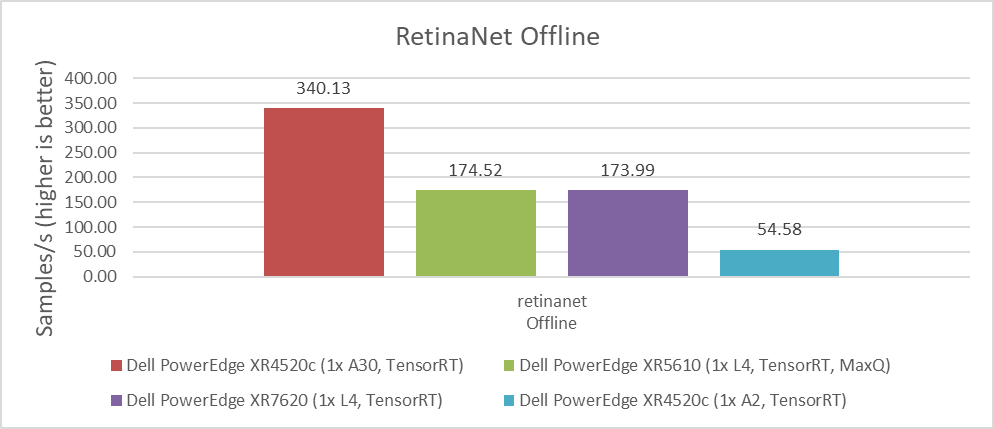
Figure 2: Performance comparison of NVIDIA A30, L4, T4, and A2 GPUs for the RetinaNet Offline benchmark
The 3D-UNet benchmark is the other computer vision image-related benchmark. It uses medical images for volumetric segmentation. We saw the same results for default accuracy and high accuracy. Moreover, the NVIDIA A30 GPU delivered significantly better performance over the NVIDIA L4 GPU. However, the same comparison between energy consumption, space, and cooling capacity discussed previously applies when considering which GPU to use for each application and use case.
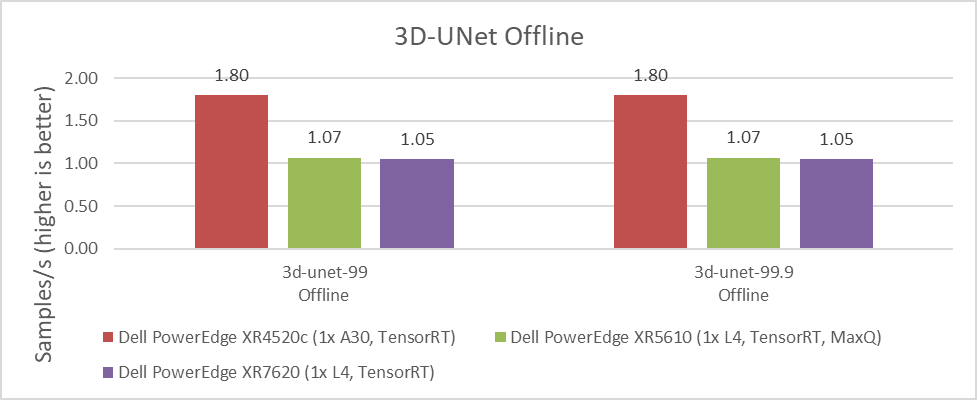
Figure 3: Performance comparison of NVIDIA A30, L4, T4, and A2 GPUs for the 3D-UNet Offline benchmark
Another important benchmark is for BERT, which is a Natural Language Processing model that performs tasks such as question answering and text summarization. We observed similar performance differences between the NVIDIA A30, L4, T4, and A2 GPUs. The higher the value, the better.
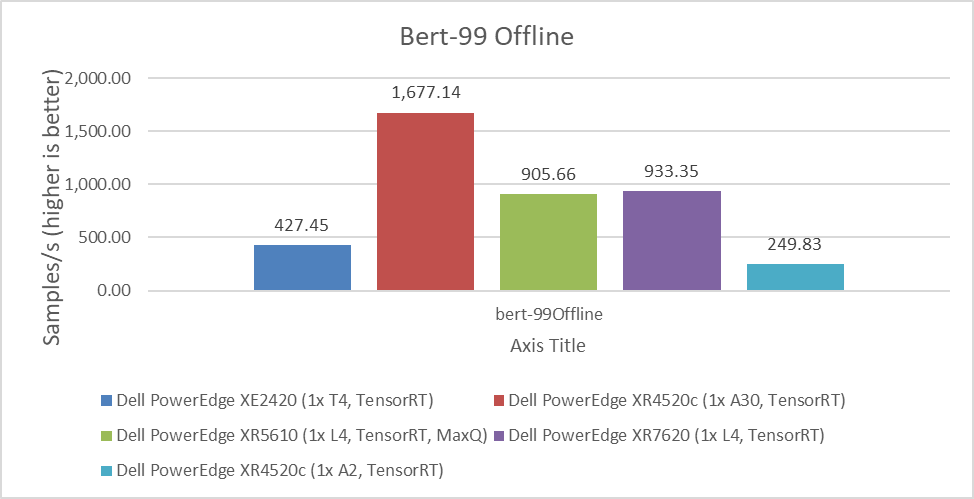
Figure 4: Performance comparison of NVIDIA A30, L4, T4, and A2 GPUs for the BERT Offline benchmark
MLPerf benchmarks also include latency results, which are the time that systems take to process requests. For some use cases, this processing time can be more critical than the number of requests that can be processed per second. For example, if it takes several seconds to respond to a conversational algorithm or an object detection query that needs a real-time response, this time can be particularly impactful on the experience of the user or application.
As shown in the following figures, the NVIDIA A30 and NVIDIA L4 GPUs have similar latency results. Depending on the workload, the results can vary due to which GPU provides the lowest latency. For customers planning to replace the NVIDIA T4 GPU or seeking a better response time for their applications, the NVIDIA L4 GPU is an excellent option. The NVIDIA A2 GPU can also be used for applications that require low latency because it performed better than the NVIDIA T4 GPU in single stream workloads. The lower the value, the better.
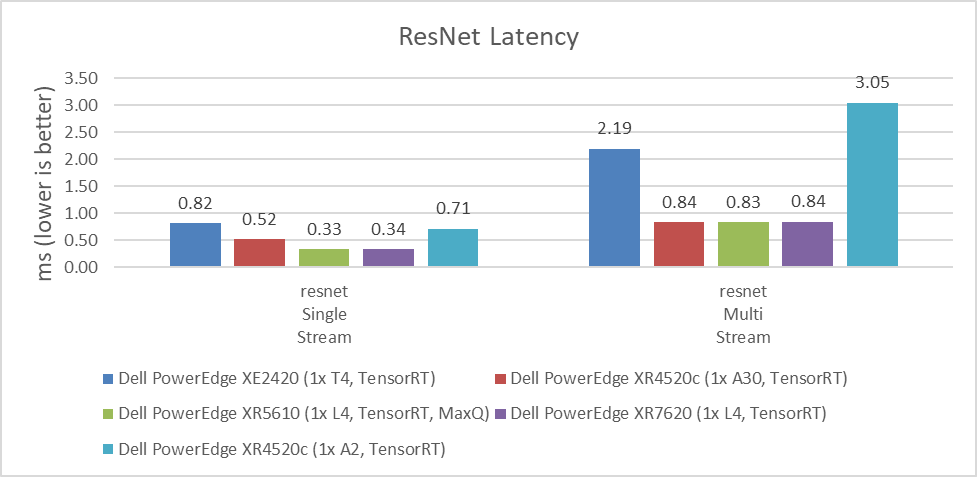
Figure 4: Latency comparison of NVIDIA A30, L4, T4, and A2 GPUs for the ResNet single-stream and multistream benchmark
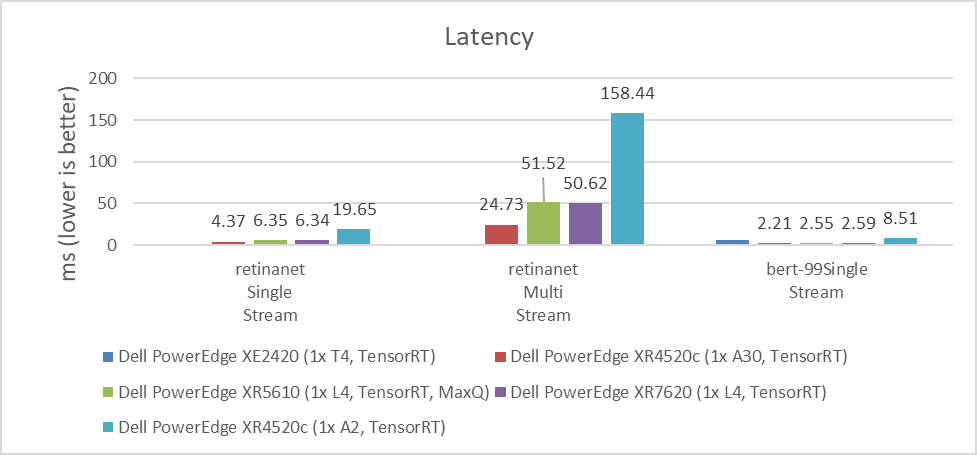
Figure 5: Latency comparison of NVIDIA A30, L4, T4, and A2 GPUs for the RetinaNet single-stream and multistream benchmark and the BERT single-stream benchmark
Dell Technologies submitted to various benchmarks to help understand which configuration is the most environmentally friendly as the data center’s carbon footprint is a concern today. This concern is relevant because some edge locations have power and cooling limitations. Therefore, it is important to understand performance compared to power consumption.
The following figure affirms that the NVIDIA L4 GPU has equal or better performance per watt compared to the NVIDIA A2 GPU, even with higher power consumption. For Throughput and Perf/watt values, higher is better; for Power(watt) values, lower is better.
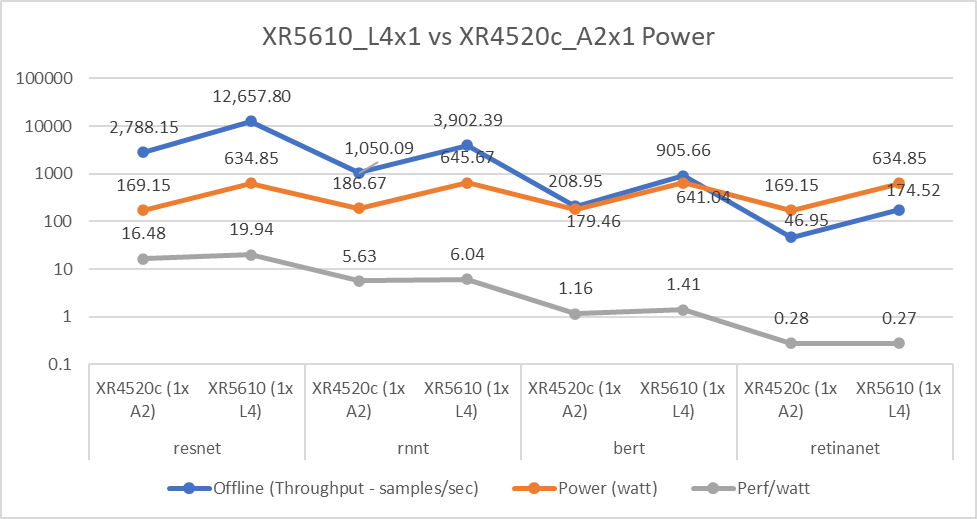
Figure 6: NVIDIA L4 and A2 GPU power consumption comparison
Conclusion
With measured workload benchmarks on MLPerf Inference 3.0, we can conclude that all NVIDIA GPUs tested for Edge workloads have characteristics that address several use cases. Customers must evaluate size, performance, latency, power consumption, and price. When choosing which GPU to use and depending on the requirements of the application, one of the evaluated GPUs will provide a better result for the final use case.
Another important conclusion is that the NVIDIA L4 GPU can be considered as an exceptional upgrade for customers and applications running on NVIDIA T4 GPUs. The migration to this new GPU can help consolidate the amount of equipment, reduce the power consumption, and reduce the TCO; one NVIDIA L4 GPU can provide twice the performance of the NVIDIA T4 GPU for some workloads.
Dell Technologies demonstrates on this benchmark the broad Dell portfolio that provides the infrastructure for any type of customer requirement.
The following blogs provide analyses of other MLPerfTM benchmark results:
- Dell Servers Excel in MLPerf™ Inference 3.0 Performance
- Dell Technologies’ NVIDIA H100 SXM GPU submission to MLPerf™ Inference 3.0
- Empowering Enterprises with Generative AI: How Does MLPerf™ Help Support
- Comparison of Top Accelerators from Dell Technologies’ MLPerf™
References
For more information about Dell Power Edge servers, go to the following links:
- Dell’s PowerEdge XR7620 for Telecom/Edge Compute
- Dell’s PowerEdge XR5610 for Telecom/Edge Compute
- PowerEdge XR4520c Compute Sled specification sheet
- PowerEdge XE2420 Spec Sheet
For more information about NVIDIA GPUs, go to the following links:
MLCommonsTM Inference v3.0 results presented in this document are based on following system IDs:
| ID | Submitter | Availability | System |
|---|---|---|---|
2.1-0005 | Dell Technologies | Available | Dell PowerEdge XE2420 (1x T4, TensorRT) |
2.1-0017 | Dell Technologies | Available | Dell PowerEdge XR4520c (1x A2, TensorRT) |
2.1-0018 | Dell Technologies | Available | Dell PowerEdge XR4520c (1x A30, TensorRT) |
2.1-0019 | Dell Technologies | Available | Dell PowerEdge XR4520c (1x A2, MaxQ, TensorRT) |
2.1-0125 | Dell Technologies | Preview | Dell PowerEdge XR5610 (1x L4, TensorRT, MaxQ) |
2.1-0126 | Dell Technologies | Preview | Dell PowerEdge XR7620 (1x L4, TensorRT) |
Table 1: MLPerfTM system IDs
Related Blog Posts

Promising MLPerf™ Inference 3.1 Performance of Dell PowerEdge XE8640 and XE9640 Servers with NVIDIA H100 GPUs
Wed, 04 Oct 2023 20:54:55 -0000
|Read Time: 0 minutes
Abstract
The recent release of MLPerf Inference v3.1 showcased the latest performance results from Dell's new PowerEdge XE8640 and PowerEdge XE9640 servers, and another submission from the PowerEdge R760xa server. The data underscores the outstanding performance of PowerEdge servers. These benchmarks illustrate the surging demand for compute power, with PowerEdge servers consistently emerging on top across various models, claiming numerous top titles. This blog examines the expected performance for image classification, object detection, question answering, speech recognition, medical image segmentation and summarization, focusing specifically on the capabilities of the PCIe and SXM form factor NVIDIA H100 Tensor Core GPUs in the new generation PowerEdge systems.
Overview of top title results
The PowerEdge XE8640 and XE9640 servers won several #1 titles.
For instance, the PowerEdge XE8640 server emerged as a winner in all benchmarks in the data center suite such as image classification, object detection, question answering, speech recognition, medical image segmentation, and summarization relative to other systems having four NVIDIA H100 SXM GPUs. The PowerEdge XE9640 server received #1 titles for all benchmarks previously mentioned relative to other liquid-cooled systems having four NVIDIA H100 SXM GPUs.
Comparison from the previous rounds of submission
The following figure shows the improvement customers can derive by using the new generation PowerEdge XE8640 and XE9640 servers from our previous generation PowerEdge XE8545 server.
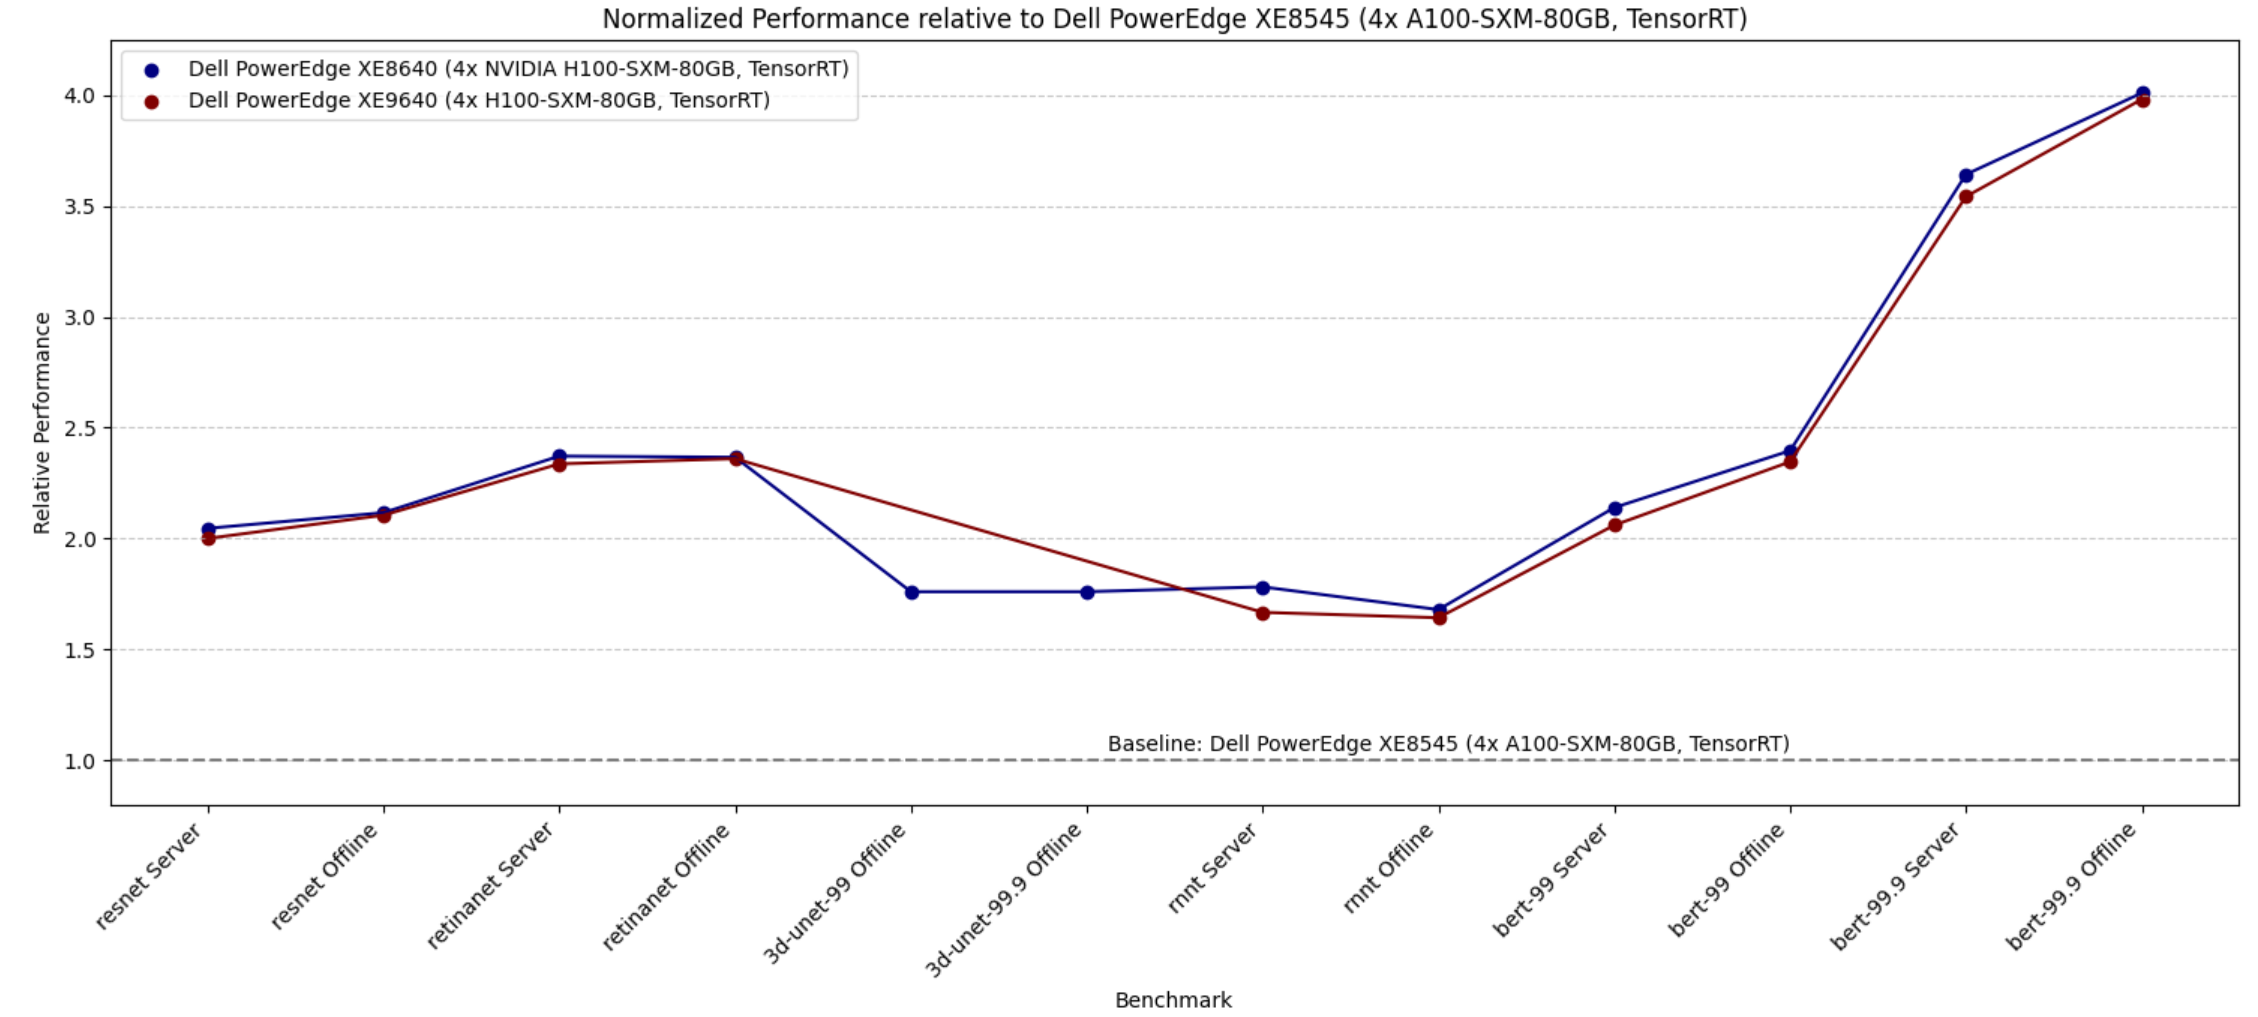
Figure 1. Relative performance of PowerEdge XE8640 and PowerEdge XE9640 servers using the PowerEdge XE8545 server as a baseline reference (for the Y axis, the higher the better)
The graph shows that the relative performance improvement from the PowerEdge XE8545 server with four NVIDIA A100 SXM Tensor Core GPUs as a baseline (from MLPerf Inference v3.0) and the new generation severs such as the PowerEdge XE8640 and PowerEdge XE9640 servers using NVIDIA H100 Tensor Core GPUs. The improvement in performance is substantial, as evident from the graph. End users can derive a two- to four-times improvement in performance for different tasks in MLPerf Inference benchmarks. We see relatively higher performance with BERT benchmarks because of the NVIDIA H100 GPU’s FP8 support.
Comparing air-cooled and liquid-cooled servers
The following figure shows the raw performance of PowerEdge XE8640 and XE9640 servers; this graph and the following graph provide relative scores. The graph includes all the benchmarks in the Inference closed data center suite that we submitted. Note that different benchmarks have different scales. All the benchmarks are presented in one graph, therefore, the y-axis is expressed logarithmically.
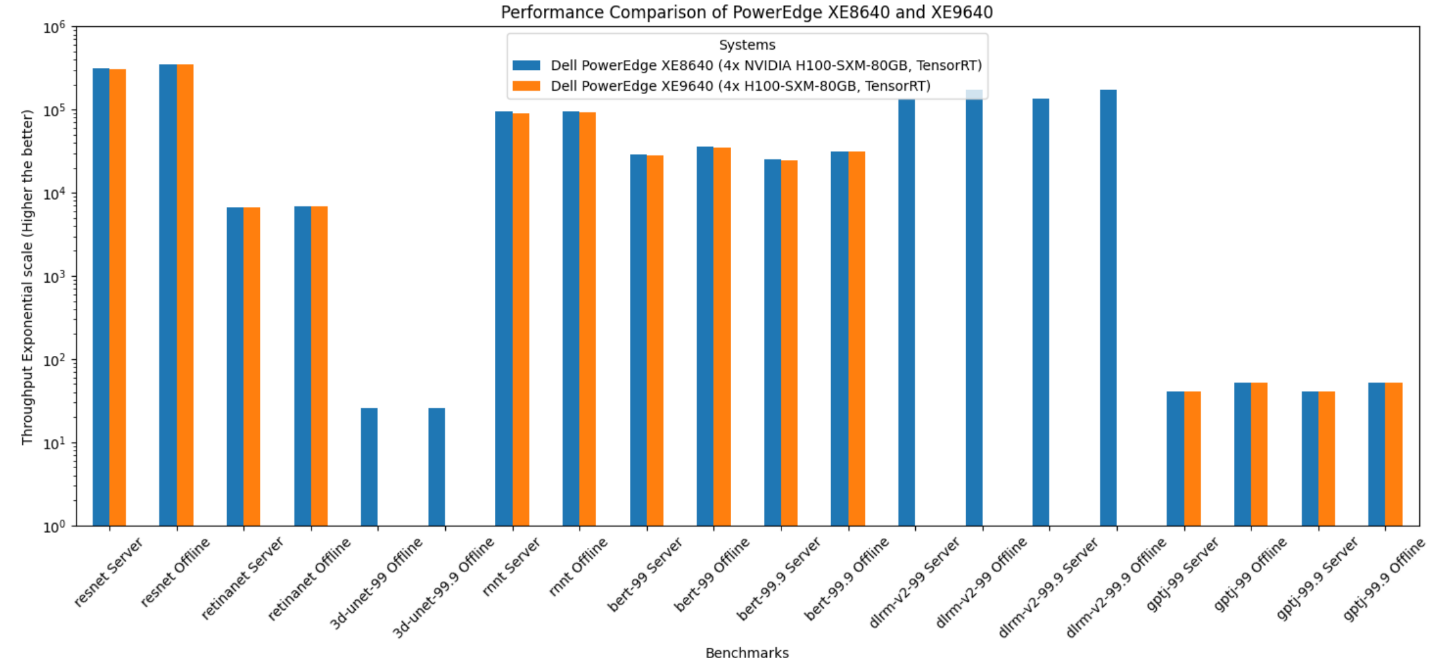
Figure 2. Performance of PowerEdge XE8640 and PowerEdge XE9640 servers
PowerEdge XE8640 and XE9640 servers are both great choices for inference workloads with four NVIDIA H100 SXM Tensor Core GPUs. The PowerEdge XE9640 server is a liquid-cooled server and the PowerEdge XE8640 server is an air-cooled server. The following figure shows the difference in performance between these systems; they both performed optimally. Both systems have similar effective throughput and render excellent performance as the CPU and GPU configurations are the same.
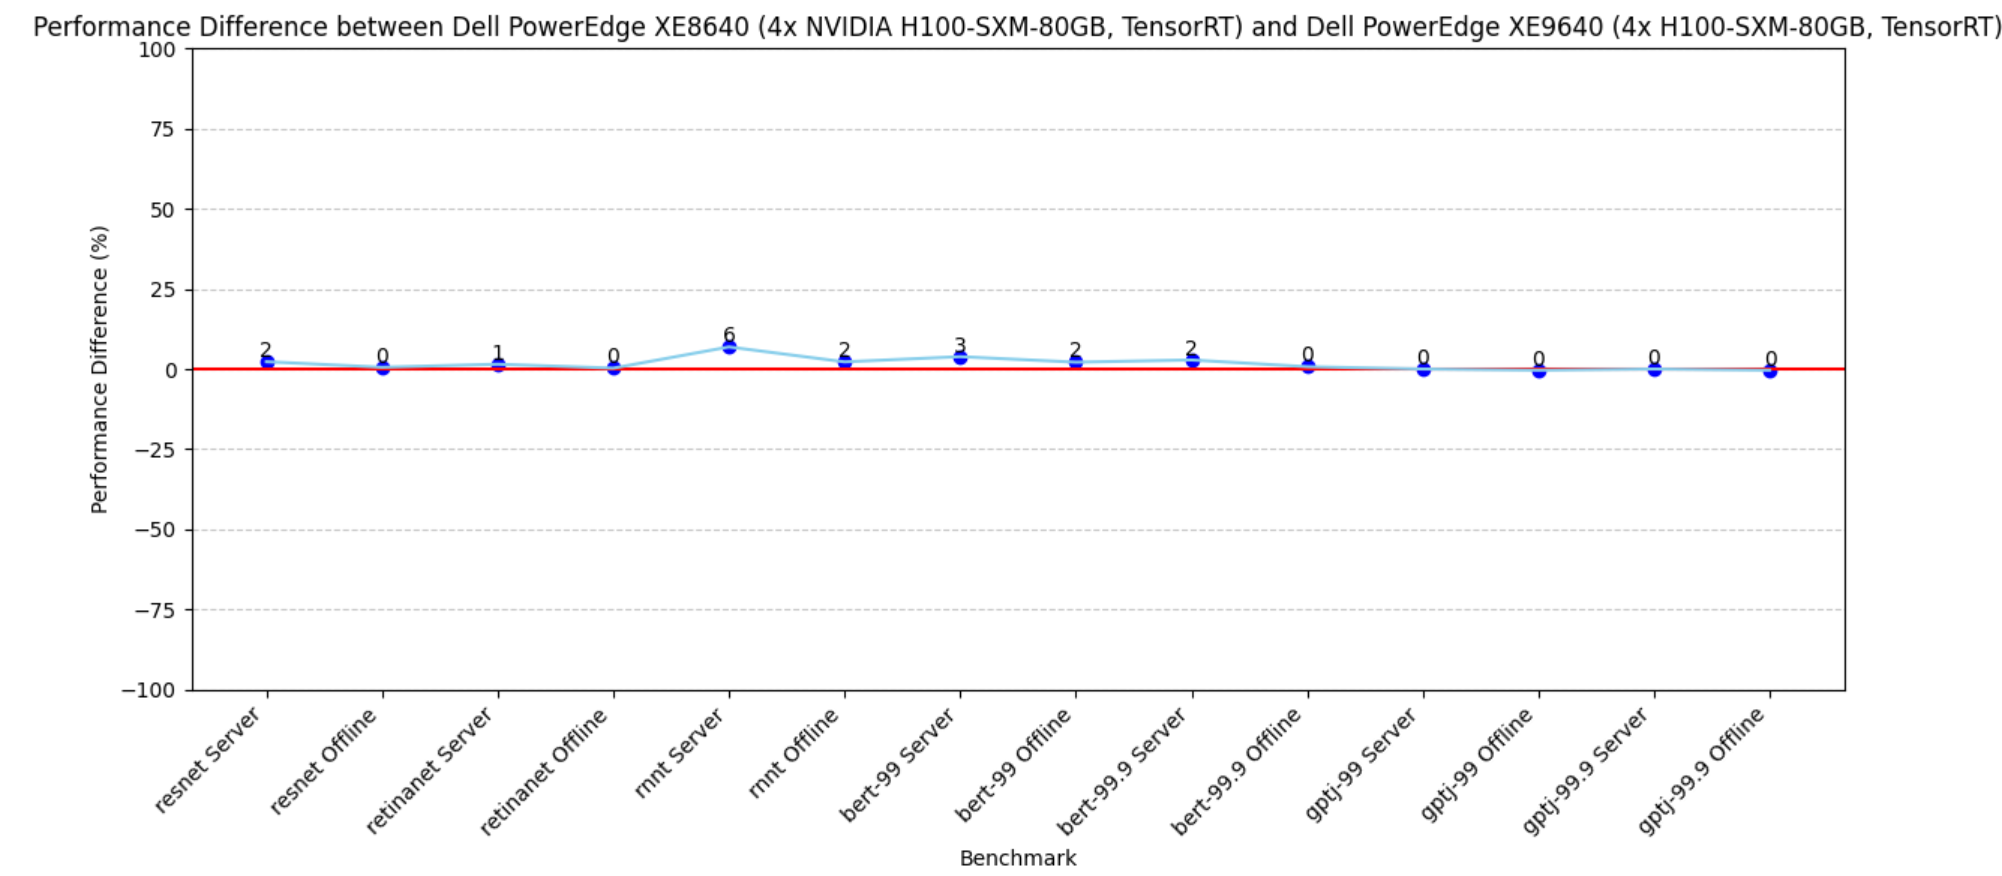
Figure 3. Performance difference between PowerEdge XE9640 and XE8640 servers using the PowerEdge XE9640 server as a baseline
Impact of SXM over PCIe form factors
The following figure shows the performance of the PowerEdge R760xa server with NVIDIA H100 PCIe GPUs as the baseline and shows the performance improvement of PowerEdge XE9640 and PowerEdge XE8640 servers with NVIDIA H100 Tensor Core SXM GPUs. The graph demonstrates that the PowerEdge XE8640 server with NVIDIA H100 SXM GPUs performs approximately 1.25 to 1.7 times better than the PowerEdge R760xa server with NVIDIA H100 PCIe GPUs.
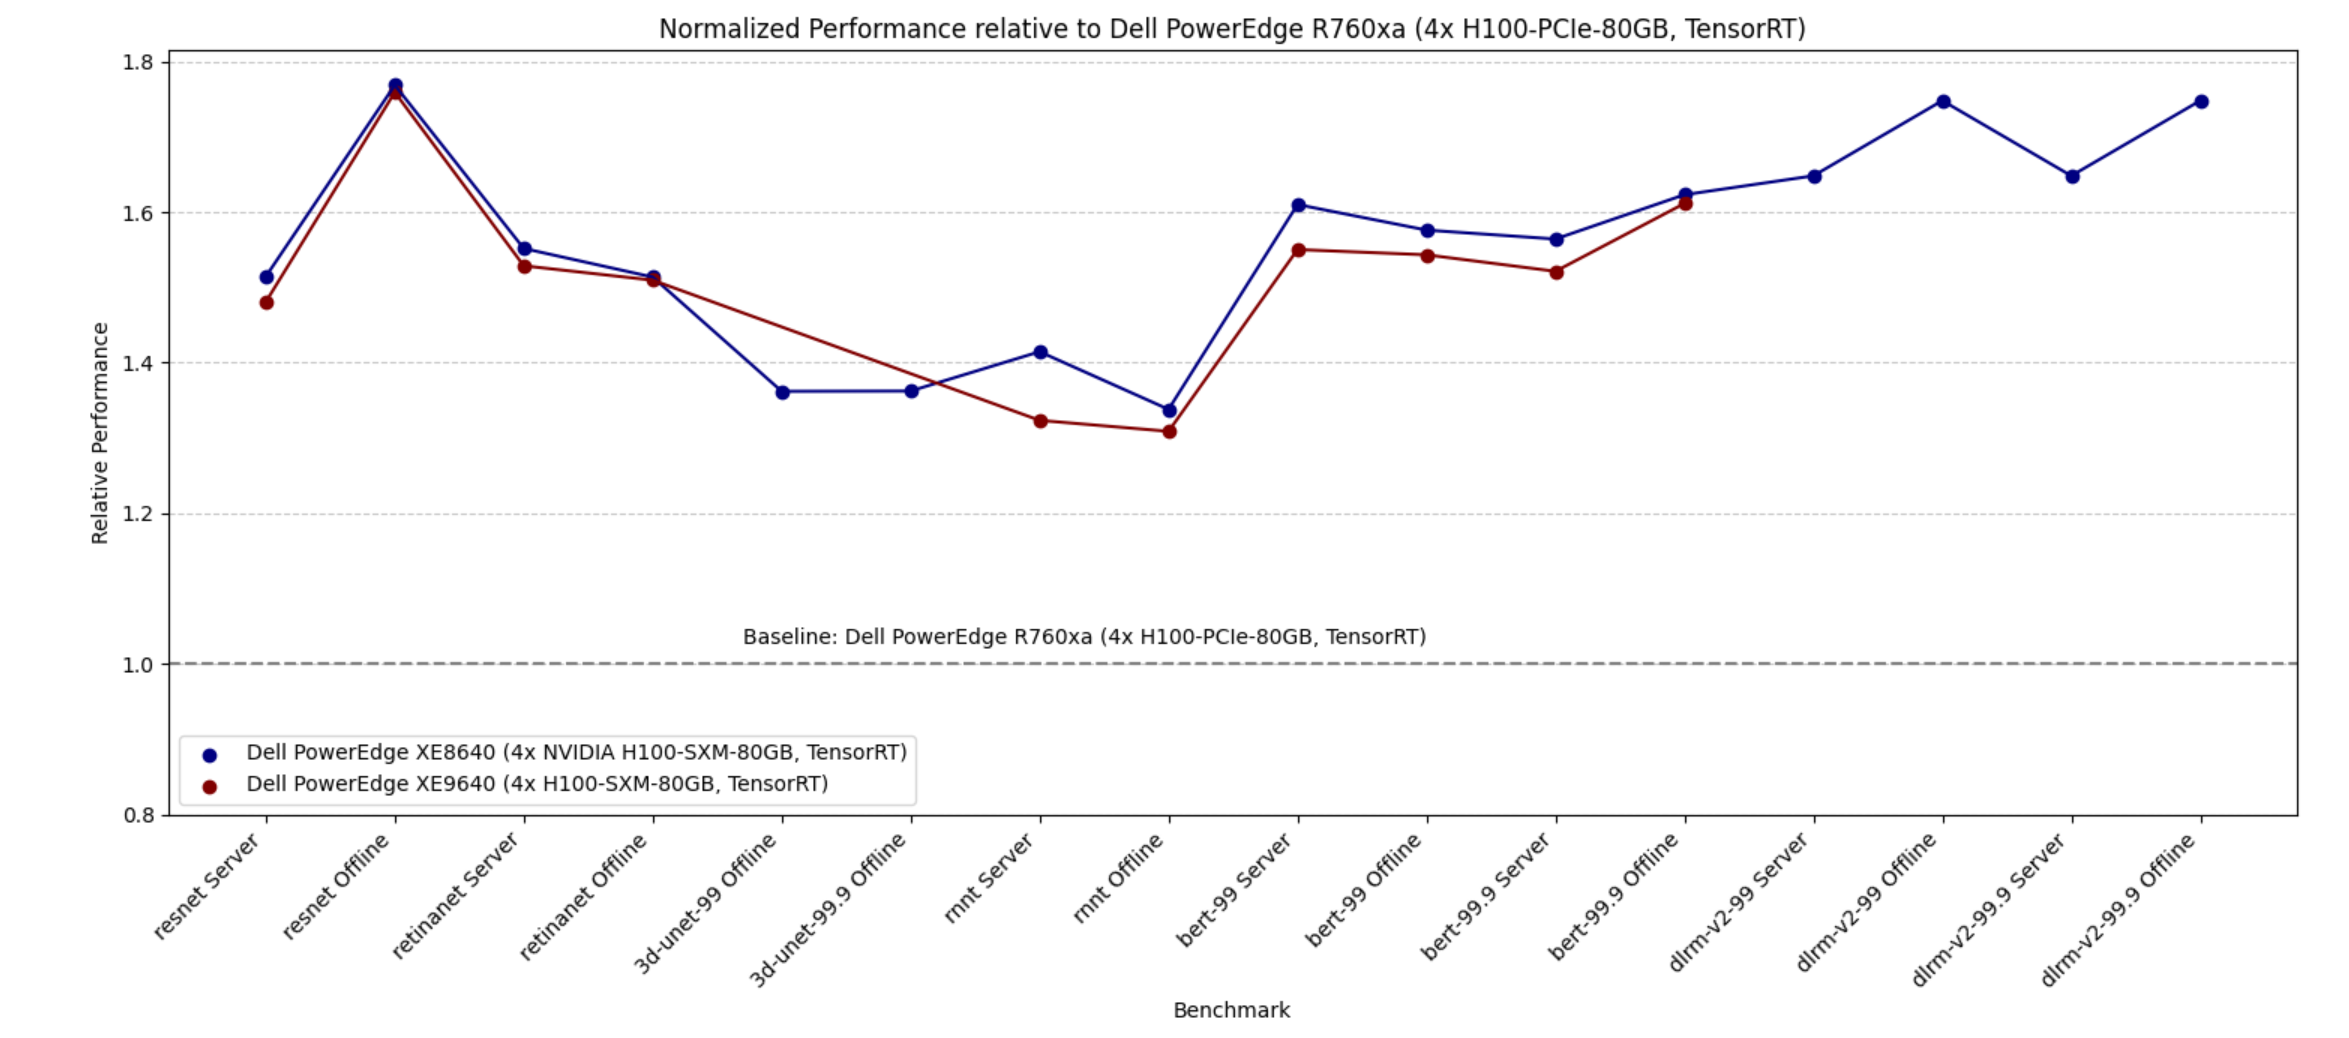
Figure 4. Performance difference between PowerEdge XE9640 and XE8640 servers with 4x H100 SXM and PowerEdge R760xa server with 4x H100 PCIe as a baseline
Because the NVIDIA H100 SXM GPUs have higher Thermal Design Power (TDP), if high performance is imperative, then using NVIDIA SXM GPUs is a great choice.
Comparing efficiency of new and previous generation servers
The following figure shows the performance of the previous generation PowerEdge XE8545 server with NVIDIA A100 SXM GPUs compared to the new generation servers such as the PowerEdge R760xa server with the NVIDIA H100 PCIE form factor and the PowerEdge XE8640 and XE9640 servers with the NVIDIA H100 SXM form factor. We see that all the new generation servers rendered higher performance. Furthermore, our new generation PowerEdge R760xa server with four NVIDIA H100 PCIe GPUs is more power efficient than our previous generation PowerEdge XE8545 server with four NVIDIA A100 SXM GPUs. This result is because NVIDIA A100 SXM GPUs have higher TDP relative to the NVIDIA H100 PCIe GPU.
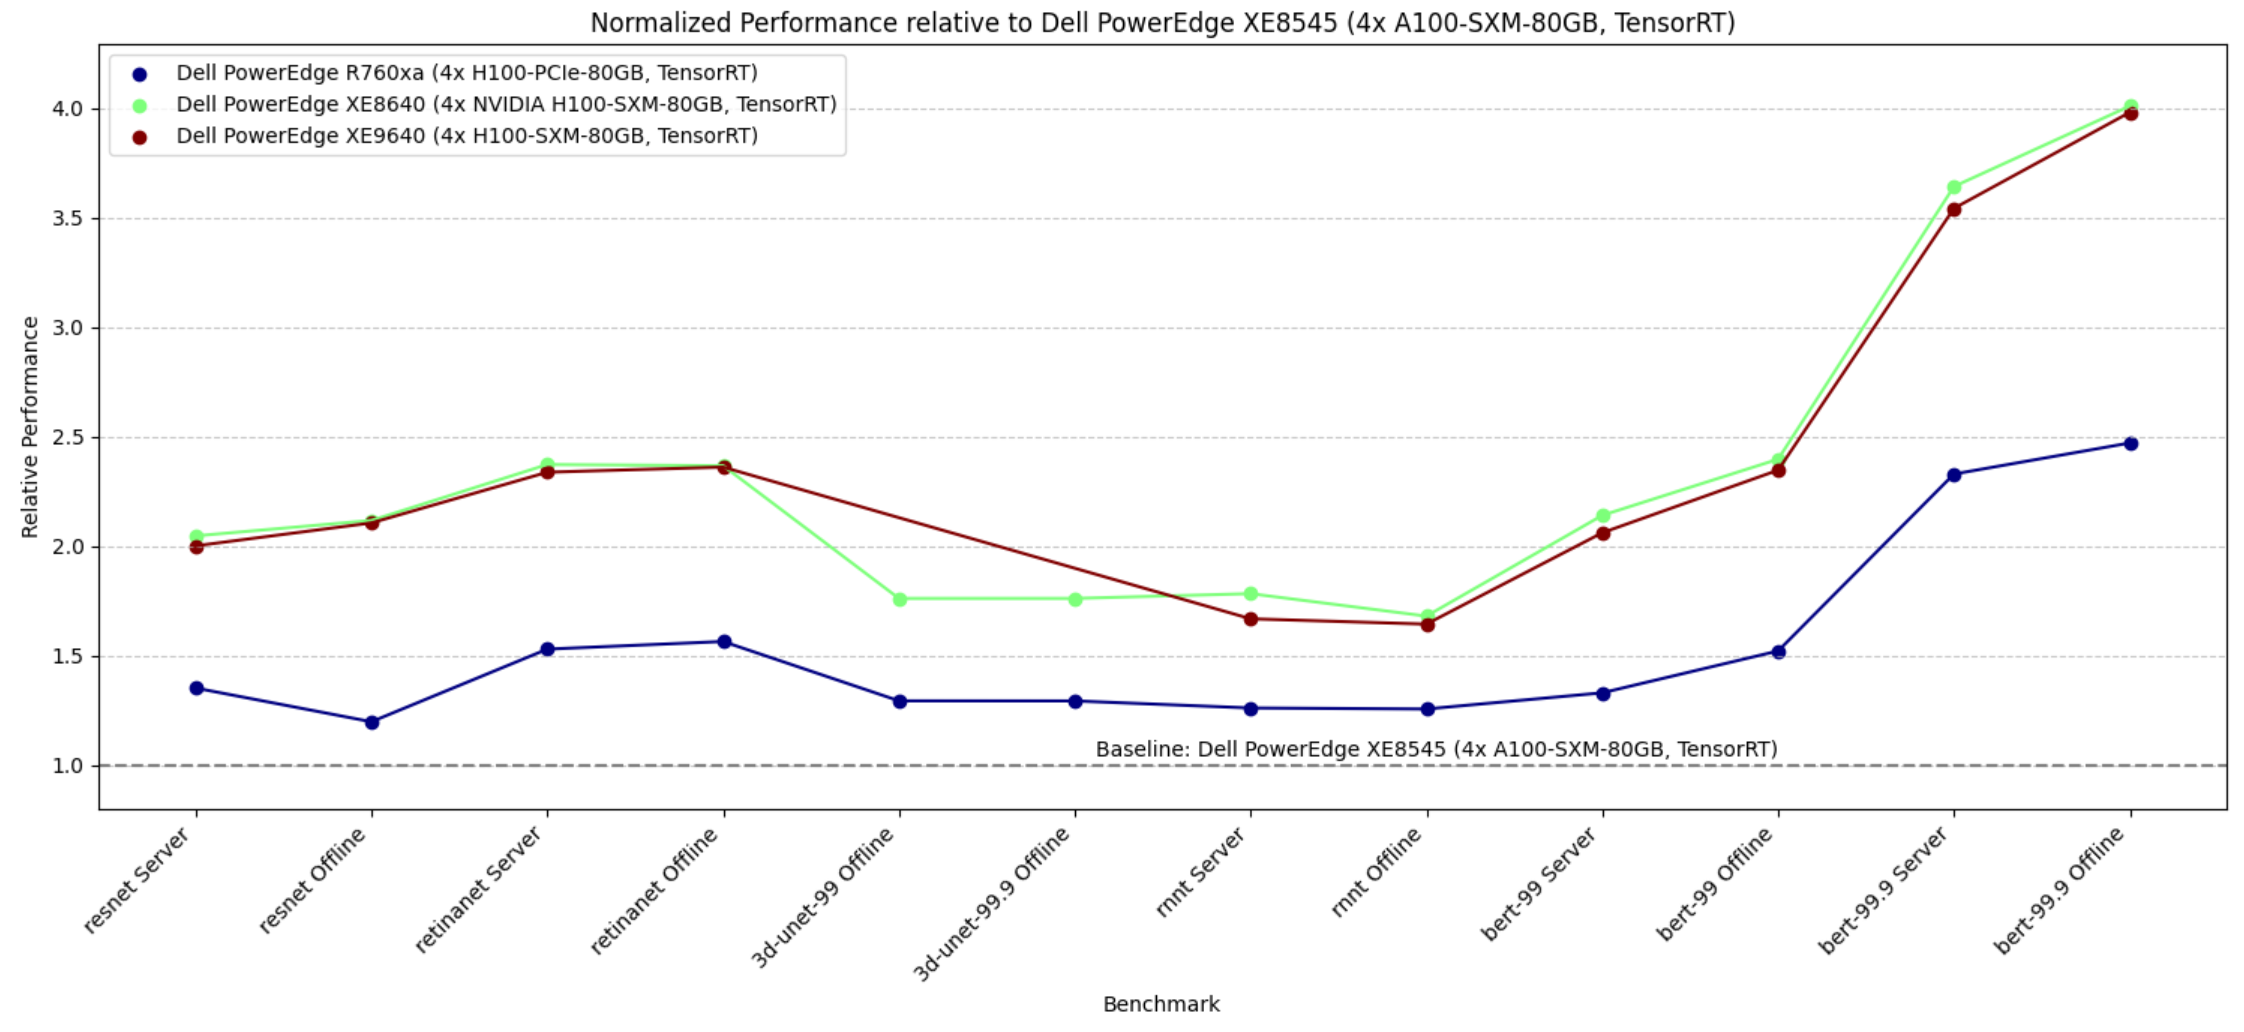
Figure 5. Relative performance of PowerEdge R760xa, PowerEdge XE9640, and PowerEdge XE8640 servers using the PowerEdge XE8545 server as a baseline
Hardware overview
The following sections describe the system components. The appendix lists the system configurations in the benchmark.
Dell PowerEdge XE8640 server
The PowerEdge XE8640 server is an air-cooled 4U server that accelerates traditional AI training and inferencing, modeling, simulation, and other high-performance computing (HPC) applications with optimized compute, turning data and automating insights into outcomes with a four-way GPU platform. Its powerful architecture and the power of two 4th Generation Intel Xeon processors with a high core count of up to 56 cores and the latest on-chip innovations to boost AI and machine learning operations.
The following figure shows the PowerEdge XE8640 server:
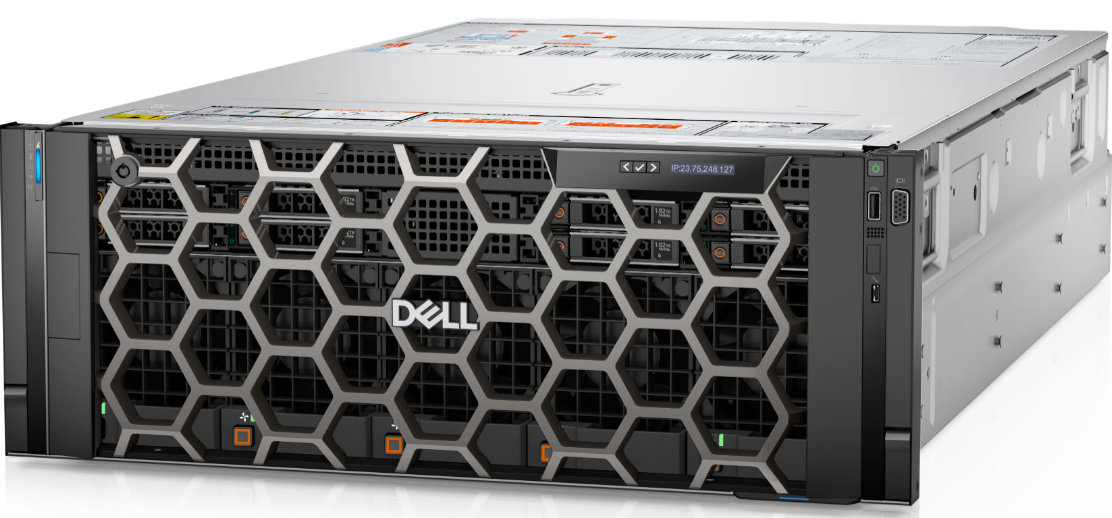
Figure 6. Dell PowerEdge XE8640 server
Dell PowerEdge XE9640 server
The PowerEdge XE9640 server is a purpose-built direct liquid-cooled (DLC) 2U server for AI and HPC workloads. NVIDIA NVLink and Intel Xelink technologies in the PowerEdge XE9640 server allow seamless communication between the GPUs, pooling their memory and cores to tackle memory-coherent workloads such as large language models (LLM) efficiently.
The following figure shows the PowerEdge XE9640 server:
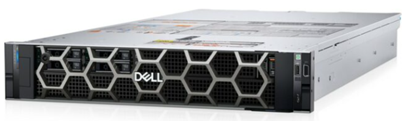
Figure 7. Dell PowerEdge XE8640
NVIDIA H100 Tensor core GPU
The NVIDIA H100 GPU is an integral part of the NVIDIA data center platform. Built for AI, HPC, and data analytics, the platform accelerates over 3,000 applications, and is available everywhere from the data center to the edge, delivering both dramatic performance gains and cost-saving opportunities. The NVIDIA H100 Tensor Core GPU delivers unprecedented performance, scalability,
and security for every workload. With NVIDIA® NVLink® Switch System, up to 256
NVIDIA H100 GPUs can be connected to accelerate exascale workloads, while the dedicated
Transformer Engine supports trillion-parameter language models. The NVIDIA H100 GPU uses
breakthrough innovations in the NVIDIA Hopper™ architecture to deliver industry-leading conversational AI, speeding up large language models by 30 times over the previous generation.
The following figure shows the NVIDIA H100 PCIe accelerator:
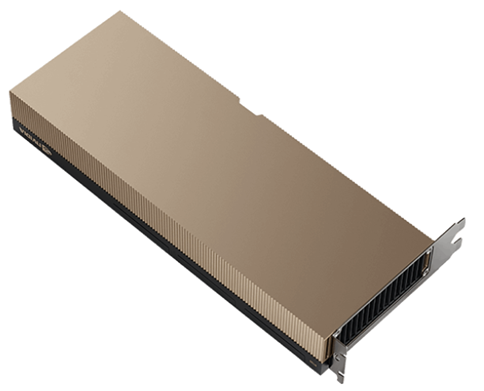
Figure 8. NVIDIA H100 PCIe accelerator
The following figure shows the NVIDIA H100 SXM accelerator:
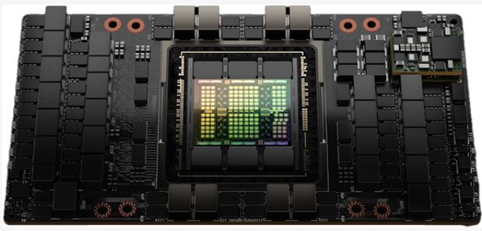
Figure 9. NVIDIA H100 SXM accelerator
Conclusion
The key takeaways include:
- Both the Dell PowerEdge XE8640 and Dell PowerEdge XE9640 servers are an excellent choice for inference. The performance of the air-cooled PowerEdge XE8640 server is almost identical to the liquid-cooled PowerEdge XE9640 server. While the PowerEdge XE9640 server is a 2U server, it requires additional cooling unit attachments. It is a good choice if there are space and temperature constraints, otherwise the PowerEdge XE8640 server is a great choice.
- PowerEdge XE8640 and PowerEdge 9640 servers have received several top titles. They are clear leaders in inference compute.
- New generation PowerEdge XE8640 and PowerEdge XE9640 servers with NVIDIA H100 GPUs have delivered 2- to 4-times improvement relative to the previous generation PowerEdge XE8545 server with NVIDIA A100 GPUs. Upgrading from the PowerEdge XE8545 sever would render higher performance.
- The PowerEdge XE9640 and PowerEdge XE8640 servers with four NVIDIA H100 SXM form-factor GPUs are significantly more effective than the PowerEdge R760xa server with four NVIDIA H100 PCIe GPUs by a factor of 1.25 to 1.7 times.
Our submission results to MLPerf Inference since its inception have continuously demonstrated significant performance improvements. We have submitted to different tasks to provide customers with a wide spectrum of possible results to review. This round marked a new and the first submission to MLPerf with PowerEdge XE8640 and XE9640 servers. Customers can rely on these high compute machines for their fast/low latency inference needs. If constrained by TDP or other factors, the PowerEdge R760xa server with the PCIe form factor is an excellent choice on which to run inference workloads.
Appendix
The following table lists the system configuration details for the servers described in this blog:
Table 1. System configurations
| Dell PowerEdge XE 8640 (4x NVIDIA H100-SXM-80GB, TensorRT) | Dell PowerEdge XE 9640 (4x H100-SXM-80GB, TensorRT) | Dell PowerEdge R760xa (4x H100-PCIe-80GB, TensorRT) | Dell PowerEdge XE 8545 (4x A100-SXM-80GB, TensorRT) |
MLPerf submission ID | 3.1-0066 | 3.1-0067 | 3.1-0064 | 3.0-0011 |
MLPerf system ID | XE8640_H100_SXM_80GBx4_TRT | XE9640_H100_SXM_80GBx4_TRT | R760xa_H100_PCIe_80GBx4_TRT | XE8545_A100_SXM4_80GBx4_TRT |
Operating system | Rocky Linux 9.1 | Ubuntu 22.04 | Ubuntu 20.04.4 | Ubuntu 22.04 |
CPU | Intel Xeon Platinum 8480 | Intel Xeon Platinum 8480+ | Intel Xeon Platinum 8480+ | AMD EPYC 7763 |
Memory | 1 TB | 1 TB | 2 TB | 2 TB |
GPU | NVIDIA H100 SXM 80 GB | NVIDIA H100 PCIE 80 GB | NVIDIA A100 SXM 80 GB CTS | |
GPU count | 4 | |||
Software stack | TensorRT 9.0.0 CUDA 12.2 | TensorRT 8.6.0 CUDA 12.2 | ||
MLCommons results
MLPerf system IDs:
- ID 3.0-0011
- ID 3.1-0064
- ID 3.1-0066
- ID 3.1-0067
Note: We reran the RetinaNet Offline benchmark for the PowerEdge R760xa server and the DLRMv2 benchmark for the PowerEdge XE8640 server to reflect the correct performance that the servers can render. Only these two results are not official due to MLCommons rules.
The MLPerf™ name and logo are trademarks of MLCommons Association in the United States and other countries. All rights reserved. Unauthorized use strictly prohibited. See www.mlcommons.org for more information.

Comparing the NVIDIA H100 and A100 GPUs in Dell PowerEdge R760xa and R750xa Servers
Wed, 04 Oct 2023 16:47:00 -0000
|Read Time: 0 minutes
Abstract
Dell Technologies recently submitted results to the MLPerf™ Inference v3.1 benchmark suite. This blog highlights Dell Technologies’ closed division submission made for the Dell PowerEdge R760xa and Dell PowerEdge R750xa servers with NVIDIA H100 and NVIDIA A100 GPUs.
Introduction
This blog provides comparisons that draw relevant conclusions about the performance improvements that are achieved on the Dell PowerEdge R760xa server with the NVIDIA H100 GPU compared to their respective predecessors, the Dell PowerEdge R750xa server with the NVIDIA A100 GPU. In the Dell PowerEdge R760xa server section of this blog, we compare the performance of the PowerEdge R760xa server to the PowerEdge R750xa server while keeping the NVIDIA H100 GPU constant to demonstrate the improvement of the new generation of PowerEdge servers. Also, we compared the performance of the PowerEdge R760xa server with the NVIDIA H100 GPU to the PowerEdge R750xa server with the NVIDIA A100 GPU to showcase the server plus the GPU generation-to-generation improvements. In the Dell PowerEdge R750xa server section of this blog, we kept the server constant and compared the performance of the NVIDIA H100 GPU to the NVIDIA A100 GPU. For an additional angle, we held the PowerEdge R750xa server and the NVIDIA A100 GPU constant to showcase the performance improvements delivered by software stack updates.
System Under Test (SUT) configuration
Table 1: SUT configuration of the Dell PowerEdge R760xa and Dell PowerEdge R750xa servers for MLPerf Inference v3.1 and v3.0
| Platform | R750xa | R750xa | R760xa |
| MLPerf Version | V3.0 | V3.1 | V3.1 |
| GPU | NVIDIA A100 PCIe 80 GB | NVIDIA A100 PCIe 80 GB NVIDIA H100 PCIe 80 GB | NVIDIA H100 PCIe 80 GB |
| GPU Count | 4 | ||
| MLPerf System ID | R750xa_A100_PCIE_80GBx4_TRT | R750xa_A100_PCIe_80GBx4_TRT R750xa_H100_PCIe_80GBx4_TRT | R760xa_H100_PCIe_80GBx4_TRT |
| CPU | Intel Xeon Gold 6338 CPU @ 2.00 GHz | Intel Xeon Platinum 8480+ | |
| Memory | 512 GB | 512 GB 1 TB | 2 TB |
| Software Stack | TensorRT 8.6 CUDA 12.0 cuDNN 8.8.0 Driver 525.85.12 DALI 1.17.0 | TensorRT 9.0.0 CUDA 12.2 cuDNN 8.9.2 Driver 535.86.10 DALI 1.28.0 | |
The following table shows the technical specifications of the NVIDIA H100 and NVIDIA A100 GPUs:
Table 2: Technical specification comparison of the NVIDIA H100 and NVIDIA A100 GPUs
GPU | NVIDIA A100 | NVIDIA H100 | ||||||
Form factor | SXM4 | PCIe Gen4 | SXM4 | PCIe Gen4 | PCIe Gen5 | NVL PCIe Gen5 | SXM5 | |
GPU architecture | Ampere | Hopper | ||||||
CUDA cores | 6912 | 14592 | 2x 16895 | 16895 | ||||
Memory size | 40 GB | 80 GB | 80 GB | 2x 94 GB (188 GB) | 80 GB | 94 GB | ||
Memory type | HBM2e | HBM2 | HBM2e | HBM2e | HBM3 | HBM2e | ||
Base clock | 1095 MHz | 765 MHz | 1275 MHz | 1065 MHz | 1095 MHz | 1080 MHz | 1590 MHz | 1605 MHz |
Boost clock | 1410 MHz | 1755 MHz | 1785 MHz | 1980 MHz | ||||
Memory clock | 1215 MHz | 1593 MHz | 1512 MHz | 1593 MHz | 2619 MHz | 1593 MHz | ||
MIG support | Yes | Yes/2nd Gen | ||||||
Peak memory bandwidth | 1555 GB/s | 2039 GB/s
| 1935 GB/s | 2039 GB/s | 3938 GB/s | 3352 GB/s | 2359 GB/s | |
Total board power | 400 W | 250 W | 400 W | 300 W | 310/350 W | 400 W | 700 W | |
Dell PowerEdge R760xa server
The PowerEdge R760xa server shines as an Artificial Intelligence (AI) workload server with its cutting-edge inferencing capabilities. This server represents the pinnacle of performance in the AI inferencing space with its processing prowess enabled by Intel Xeon Platinum processors and NVIDIA H100 PCIe 80 GB GPUs. Coupled with NVIDIA TensorRT and CUDA 12.2, the PowerEdge R760xa server is positioned perfectly for any AI workload including but not limited to Large Language Models, computer vision, Natural Language Processing, robotics, and edge computing. Whether you are processing image recognition tasks, natural language understanding, or deep learning models, the PowerEdge R760xa server provides the computational muscle for reliable, precise, and fast results.
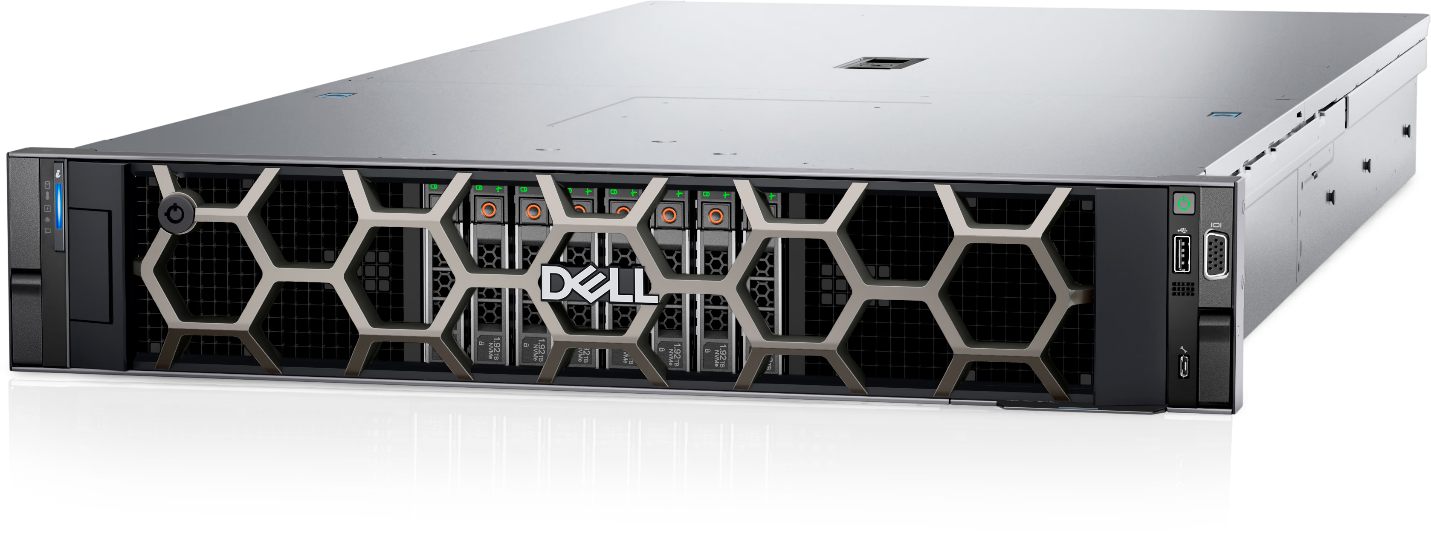
Figure 1: Front view of the Dell PowerEdge R760xa server
 |
|
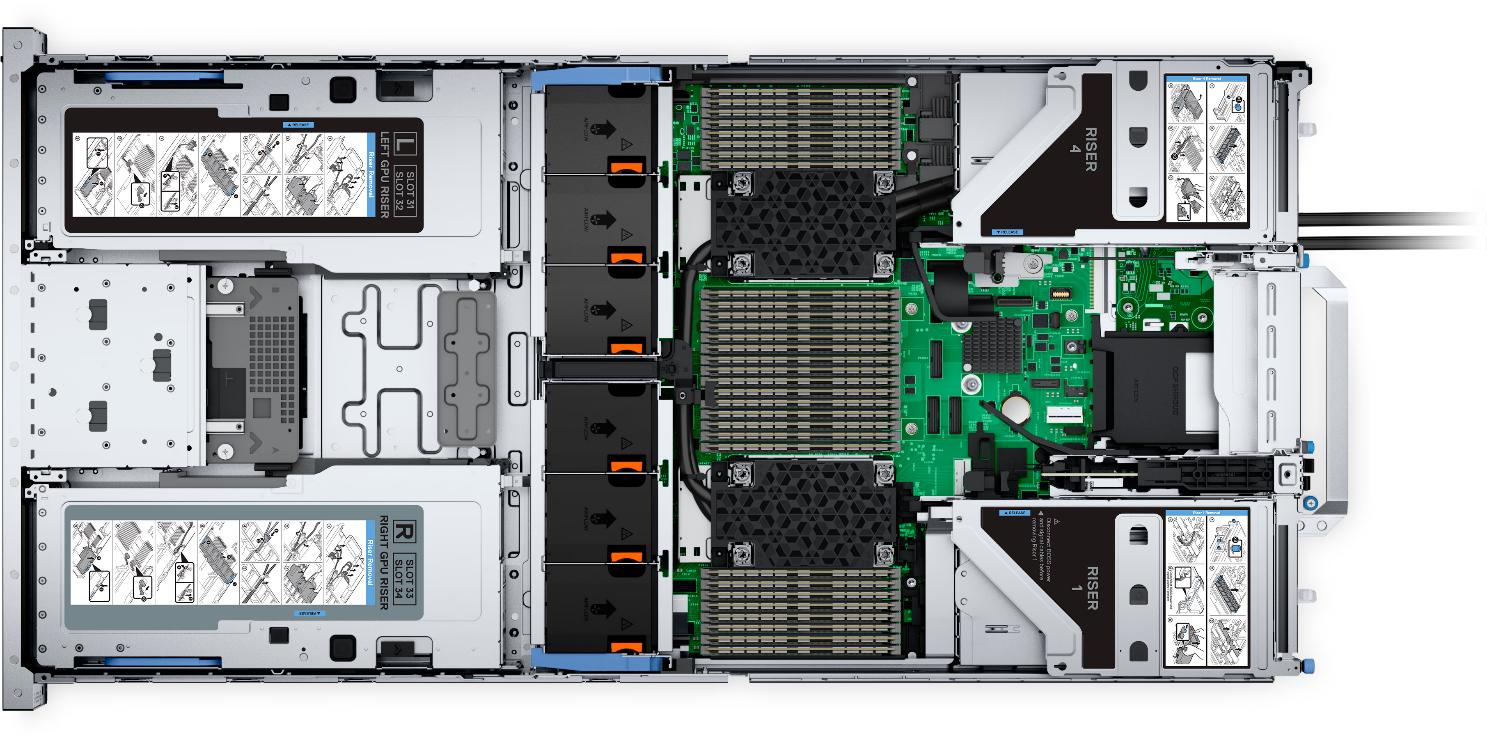
Figure 2: Top view of the Dell PowerEdge R760xa server
The results in the following figures are represented as percentage differences while maintaining a single SUT as the baseline. To determine the percentage difference between the two results, we subtracted the performance value achieved on the first server from the performance value achieved on the second server. We divided the difference by the performance achieved on the second server and multiplied it by 100 to get a percentage. By applying this formula, we obtain the performance delta between the second and first server. This result provides an easy-to-read comparison across two systems and several benchmarks.
The following figure shows the percent difference between the PowerEdge R760xa and PowerEdge R750xa servers while maintaining the NVIDIA H100 GPU constant. Both results were collected from the latest official MLPerf Inference v.3.1 submission with the identical software stack. Across all the benchmarks, the PowerEdge R760xa server comprehensively outperformed its predecessor. The PowerEdge R760xa server shined in the Natural Language Processing task with a noticeable 15 percent improvement. On average, it performed approximately 6 percent better for all workloads.
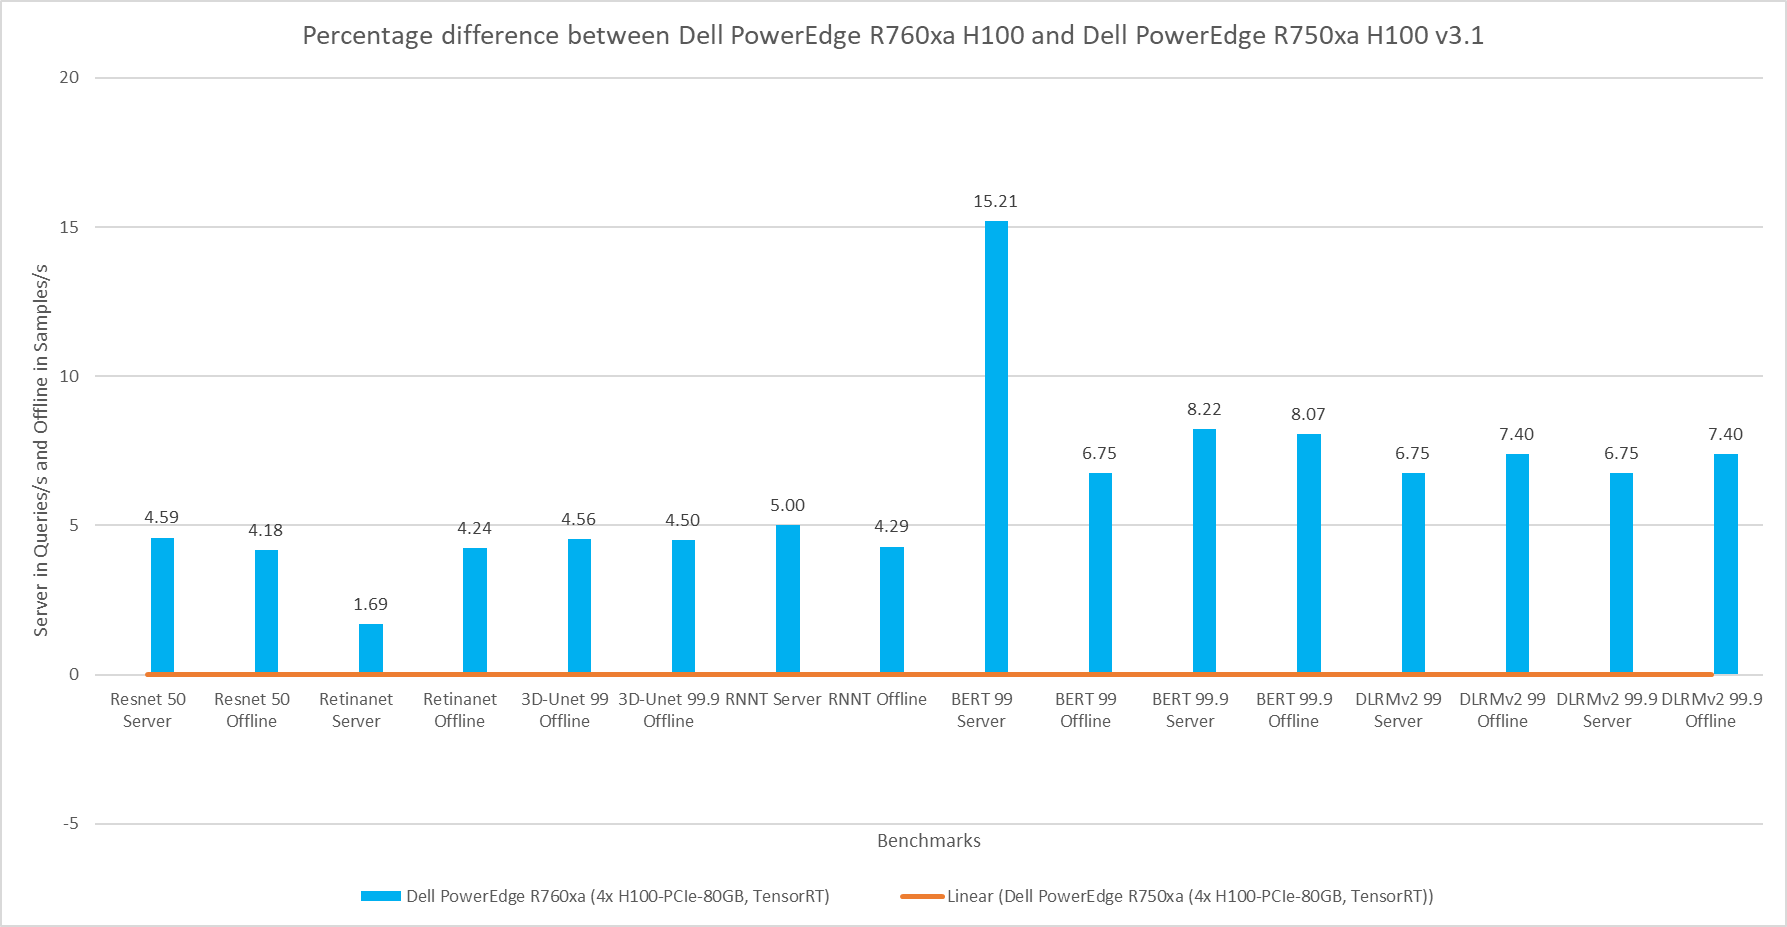
Figure 3: Percentage difference between the Dell PowerEdge R760xa server with the NVIDIA H100 GPU and the Dell PowerEdge R750xa server with the NVIDIA H100 GPU for the v3.1 submission
The following figure shows a comparison of the PowerEdge R760xa server with the NVIDIA H100 GPU to the PowerEdge R750xa server with the NVIDIA A100 GPU. This comparison is expected to yield the highest delta in performance due to the hardware upgrades of both the server and GPU. Both submissions were made to the MLPerf Inference v3.1 round in which the software stack was kept the same. The PowerEdge R760xa server paired with the NVIDIA H100 GPU thoroughly outperformed its predecessor in all workloads. In the high accuracy category of the Natural Language Processing workload, the PowerEdge R760xa server boasts an impressive 178 percent and 197 percent performance improvement in the Server and Offline modes respectively. On average, the newer configuration showcased a noteworthy 71 percent improvement across all the benchmarks.
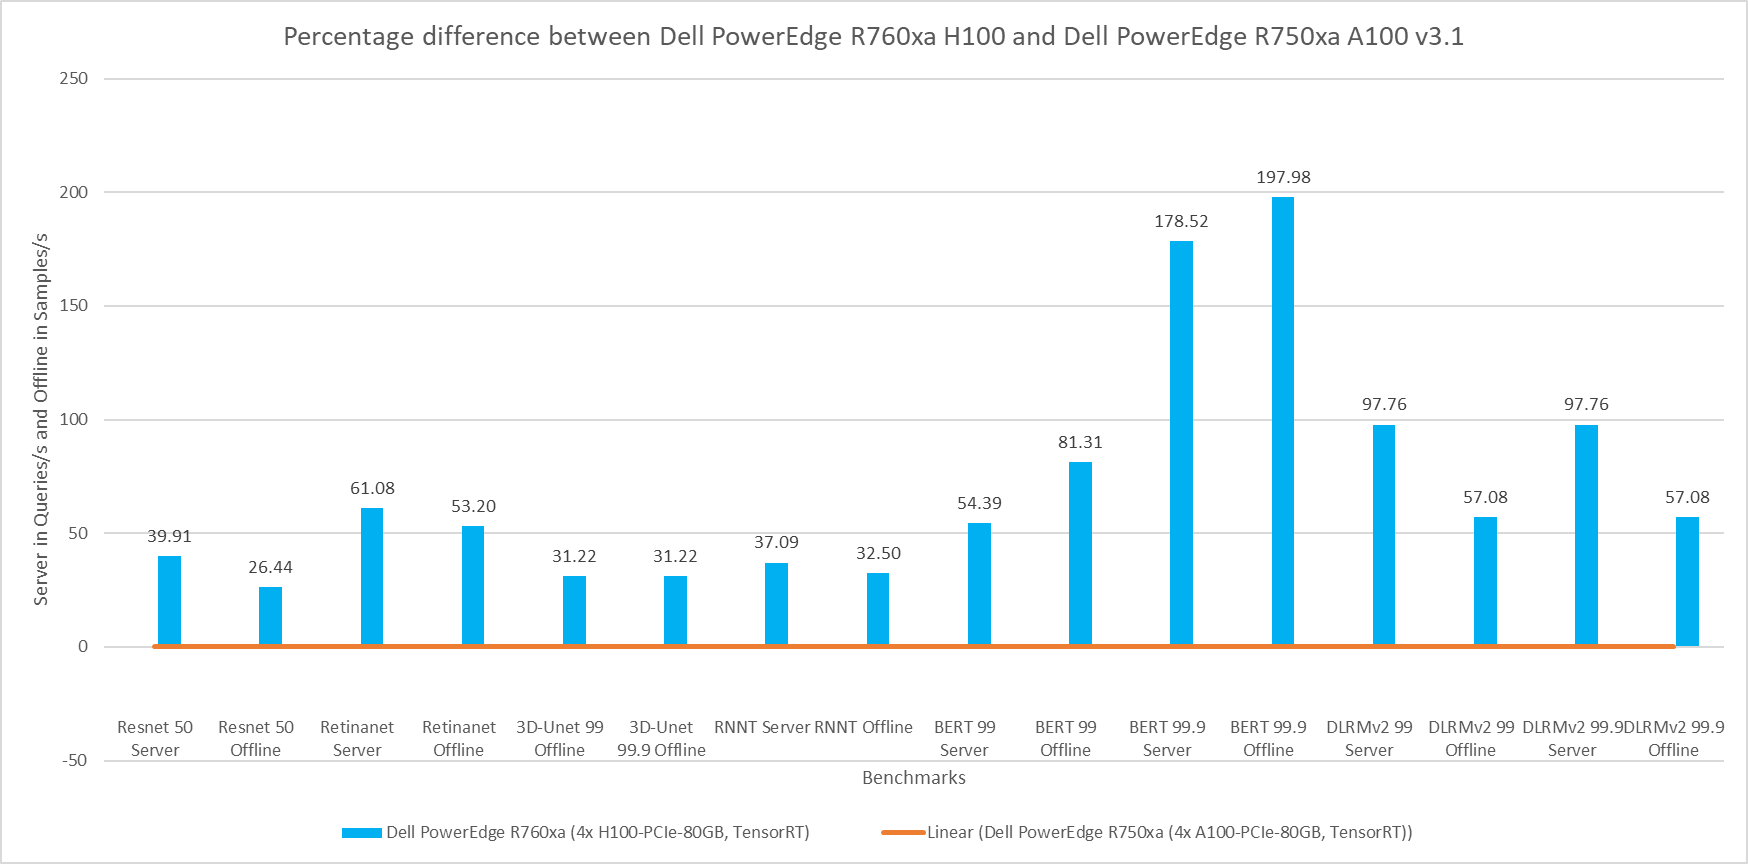
Figure 4: Percentage difference between the Dell PowerEdge R760xa server with the NVIDIA H100 GPU and the Dell PowerEdge R750xa server with the NVIDIA A100 GPU for v3.1
Dell PowerEdge R750xa server
The PowerEdge R750xa server is a perfect blend of technological prowess and innovation. This server is equipped with Intel Xeon Gold processors as well as with the latest NVIDIA GPUs. The PowerEdge R760xa server has been designed for the most demanding AI/ML/DL workloads as it is compatible with the latest NVIDIA TensorRT engine and CUDA version. With up to nine PCIe Gen4 slots and availability in a 1U or 2U configuration, the PowerEdge R750xa server is an excellent option for any demanding workload.
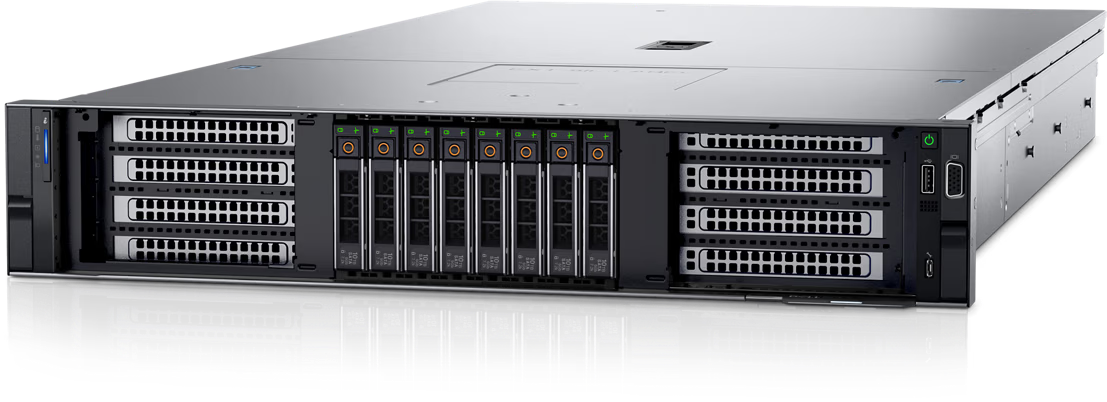
Figure 5: Front view of the Dell PowerEdge R750xa server
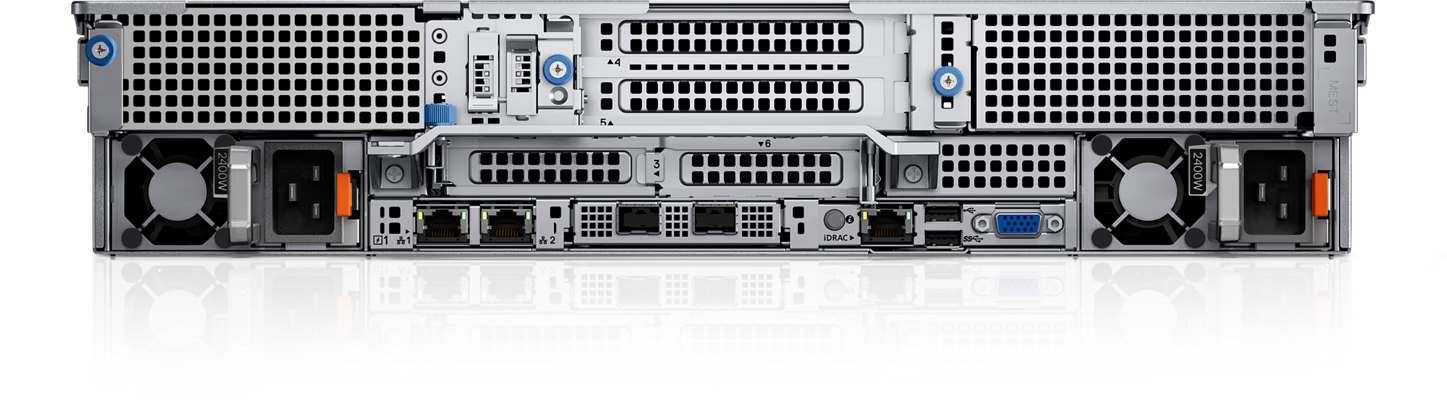
Figure 6: Rear view of the Dell PowerEdge R750xa server
For the following comparison, the Dell PowerEdge R750xa server is held constant but the GPU is updated from the NVIDIA A100 GPU to the NVIDIA H100 GPU. This comparison is useful if you are interested in keeping the server that you already have but are upgrading the GPU. As expected, the server with the NVIDIA H100 GPU shows significant performance improvements across all the workloads. Similar to the previous comparison, the high accuracy Natural Language Processing task on the NVIDIA H100 GPU shows promising performance improvements. In the high accuracy Server scenario for BERT, the NVIDIA H100 GPU showed a 156 percent improvement and in the Offline scenario a 174 percent improvement. On average, the PowerEdge R750xa server paired with the NVIDIA H100 GPU performed approximately 60 percent better than its GPU predecessor.
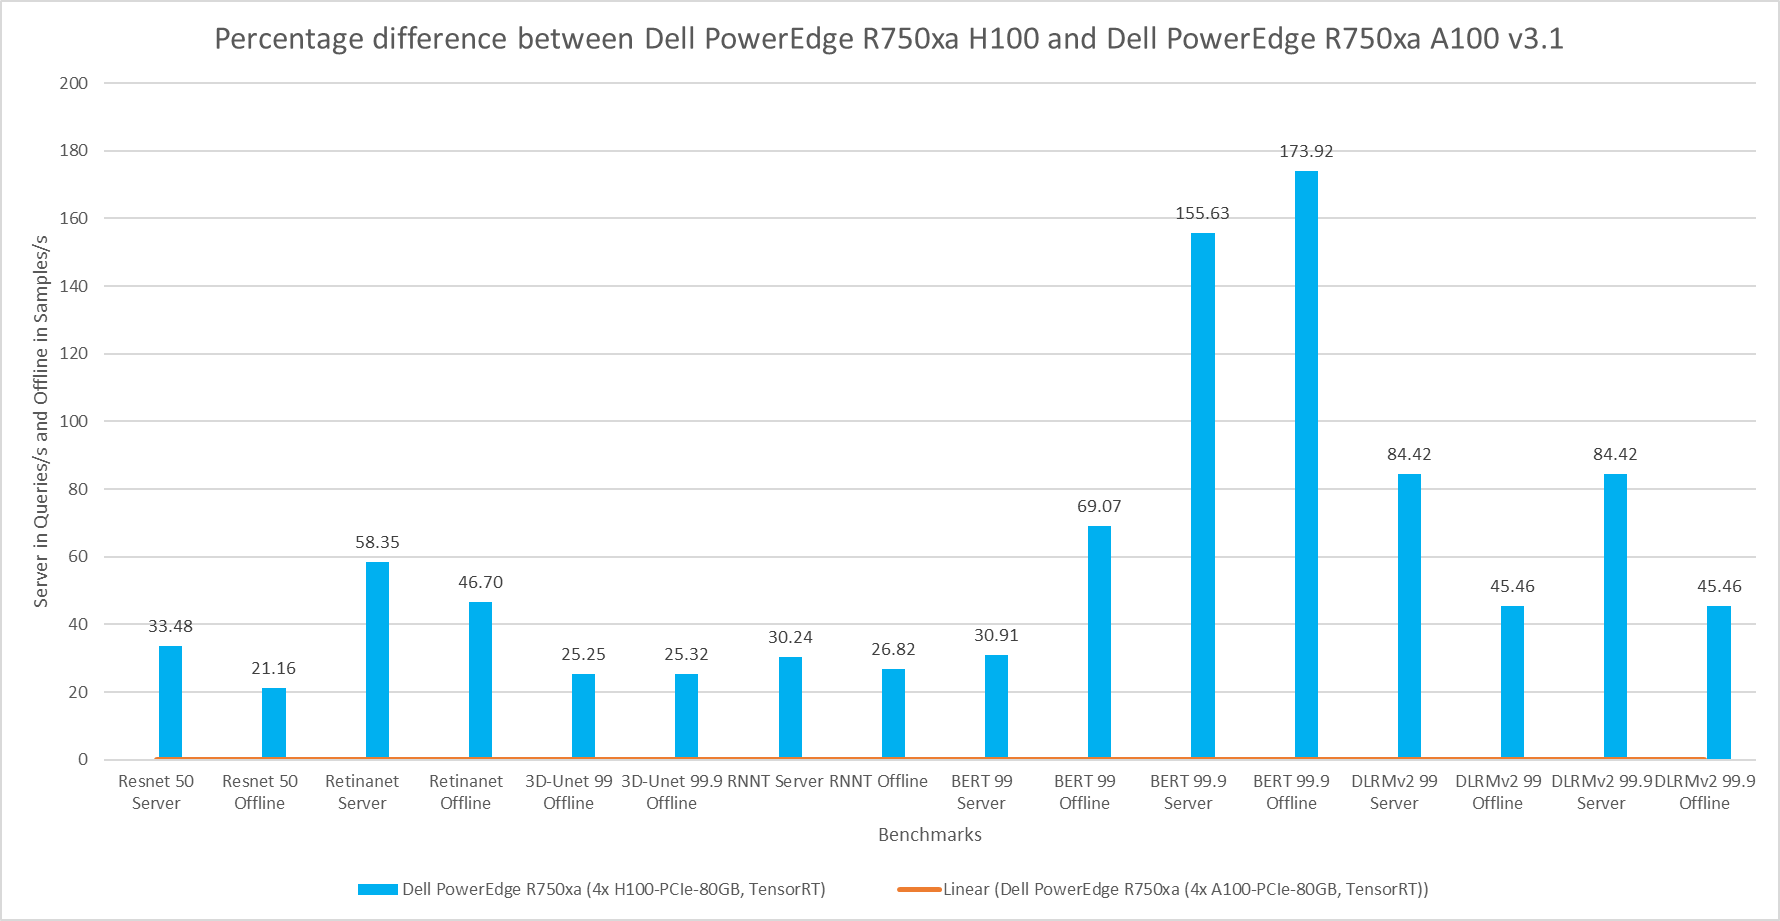
Figure 7: Percentage difference between the Dell PowerEdge R750xa H100 and Dell PowerEdge R750xa A100 for MLPerf Inference v3.1
The comparison shown in the following figure is an interesting comparison across two rounds of submissions. The hardware for the SUT is identical with the Dell PowerEdge R750xa server paired with the NVIDIA A100 GPU. The performance delta from this graph can be attributed to the changes in the software stack. For the vision tasks, RetinaNet and 3D-UNet, the NVIDIA H100 GPU showed a considerable improvement in performance. For the BERT Server scenario, the performance is approximately the same. However, for the BERT Offline scenario in both the default and high accuracy modes, there was a slight regression in performance. This result can be attributed to regressions in the BERT model.
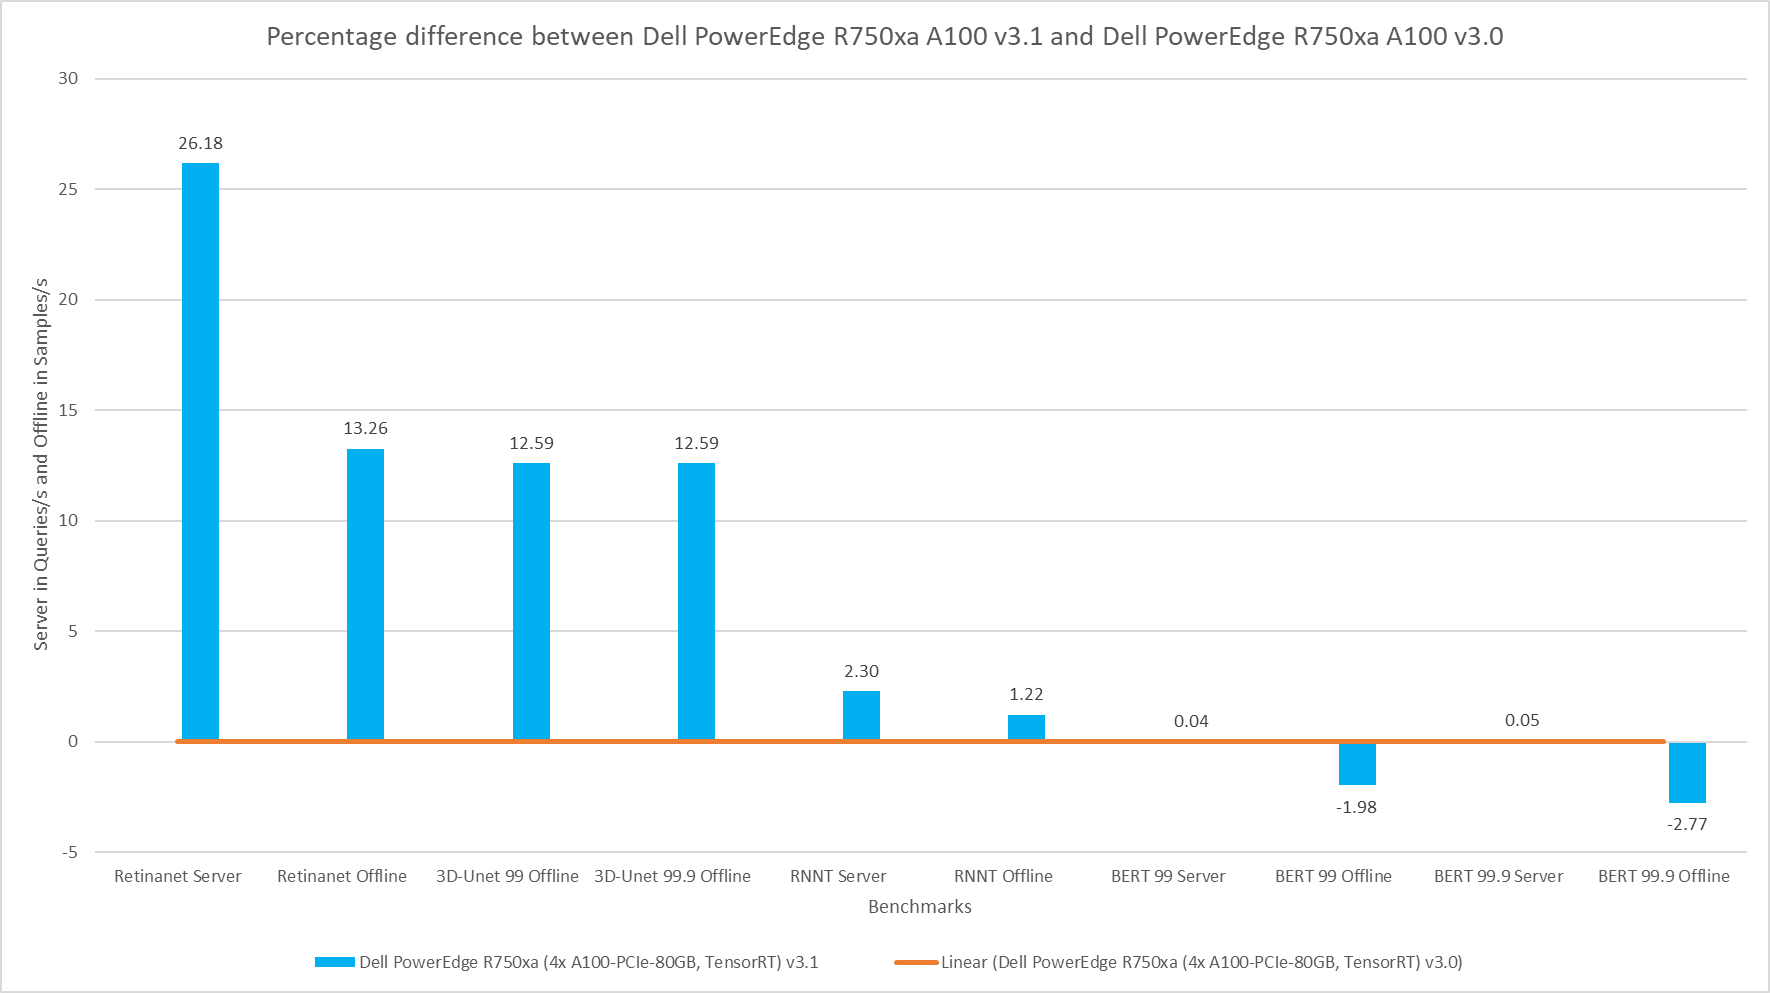
Figure 8: Percentage difference between the Dell PowerEdge R750xa server with the NVIDIA A100 GPU v3.1 submission and the Dell PowerEdge R750xa server with the NVIDIA A100 GPU v3.0 submission
Conclusion
The MLPerf Inference submissions always elicit insightful comparisons. This blog highlighted these comparisons between the MLPerf Inference v3.1 and v3.0 rounds of submission:
- A generation-to-generation comparison of the Dell PowerEdge R760xa server and the Dell PowerEdge R750xa server while keeping the GPU constant on average boasts an impressive 6.22 percent performance improvement.
- An upgrade of the server as well as the GPU from the Dell PowerEdge R750xa server paired with the NVIDIA A100 GPU to the Dell PowerEdge R760xa server paired with the NVIDIA H100 GPU shows a noteworthy boost in performance. You can expect about an average of 71 percent increase in performance across benchmarks by upgrading both the server and the GPU.
- While maintaining the Dell PowerEdge R750xa server and upgrading the GPU from the NVIDIA A100 GPU to the NVIDIA H100 GPU, you can expect an approximate 60 percent increase in performance across benchmarks.
- While maintaining the same SUT across rounds with the Dell PowerEdge R750xa server and the NVIDIA A100 GPU, you can expect on average an 11.36 percent increase in improvement for RetinaNet, 3D-UNet, and RNNT tasks, thanks to software improvements. However, there are minor regressions in performance in the BERT benchmark.
Across the first three comparisons, a pattern of improvement in the Natural Language Processing task was noticeable. With the advent of new Large Language Models, the Dell PowerEdge server is positioned well to handle Generative AI workloads. For the last comparison, we kept the Dell PowerEdge R750xa server and NVIDIA A100 GPU consistent but looked at the performance across different rounds of submission.
MLCommons™ results
Note: We ran the RetinaNet Offline results for the Dell PowerEdge R760xa and Dell PowerEdge R750xa servers with the NVIDIA H100 GPU again after the submission with a larger GPU batch size. These results significantly improved the performance and are a true representation of Dell servers as we saw a 78 percent and 114 percent increase in performance on the PowerEdge R760xa server and PowerEdge R750xa servers respectively. For the Dell PowerEdge R760xa server with four NVIDIA H100 GPUs, the RetinaNet Offline results improved from 2069.79 to 4550.67. The RetinaNet Offline results for the system ID 3.1-0063 and 3.1-0065 submissions are not official due to MLCommons rules because they were rerun after the submission and not officially submitted before the deadline.
MLPerf Inference v3.1 and v3.0 system IDs:
- 3.1-0058, 3.1-0061 Dell PowerEdge R750xa (4x A100-PCIe-80GB, TensorRT)
- 3.1-0062 Dell PowerEdge R750xa (4x H100-PCIe-80GB, TensorRT)
- 3.1-0064 Dell PowerEdge R760xa (4x H100-PCIe-80GB, TensorRT)
- 3.0-0008 Dell PowerEdge R750xa (4x A100-PCIe-80GB, TensorRT)
The MLPerf™ name and logo are trademarks of MLCommons Association in the United States and other countries. All rights reserved. Unauthorized use strictly prohibited. See www.mlcommons.org for more information.