


BWA-GATK Pipeline Performance on Dell EMC PowerEdge R6525 Server
Tue, 30 Mar 2021 18:34:08 -0000
|Read Time: 0 minutes
Overview
We’ve been speculating that AMD Milan with Zen3 cores which allows more cores to share the same L3 cache could perform better for Next Generation Sequencing (NGS) applications. Comparing to the predecessor AMD EPYC Rome, the number of cores sharing the L3 cache is doubled-up from 4 to 8 for the 64 core processor model. In addition to that, the cache (both L1 and L2) is upgraded with new prefetchers, and memory bandwidth is improved.
Since Milan and Rome share the same SP3 socket, Dell EMC PowerEdge R6525 was selected for the case study and able to minimize system-to-system variations. The test server configuration is summarized in Table 1.
Table 1. Tested compute node configuration
Dell EMC PowerEdge R6525 | |
CPU | Tested AMD Milan: 2x 7763 (Milan), 64 Cores, 2.45GHz – 3.5GHz Base-Boost, TDP 280W, 256 MB L3 Cache 2x 7713 (Milan), 64 Cores, 2.0GHz – 3.7GHz Base-Boost, TDP 225W, 256 MB L3 Cache 7543 (Milan), 32 Cores, 2.8GHz – 3.7 GHz Base-Boost, TDP 225W, 256 MB L3 Cache Tested AMD Rome: 7702 (Rome), 64 Cores, 2.0 GHz – 3.35 GHz Base-Boost, TDP 200W, 256 MB L3 Cache |
RAM | DDR4 256G (16Gb x 16) 3200 MT/s |
OS | RHEL 8.3 (4.18.0-240.el8.x86_64) |
Filesystem Network | Mellanox InfiniBand HDR100 |
Filesystem | Dell EMC Ready Solutions for HPC BeeGFS High Capacity Storage |
BIOS System Profile | Performance Optimized |
Logical Processor | Disabled |
Virtualization Technology | Disabled |
BWA | 0.7.15-r1140 |
Sambamba | 0.7.0 |
Samtools | 1.6 |
GATK | 3.6-0-g89b7209 |
The test data was chosen from one of Illumina’s Platinum Genomes. ERR194161 was processed with Illumina HiSeq 2000 submitted by Illumina and can be obtained from EMBL-EBI. The DNA identifier for this individual is NA12878. The description of the data from the linked website shows that this sample has a >30x depth of coverage, and it reaches ~53x.
Performance Evaluation
Characterizing steps in BWA-GATK Pipeline
In a typical BWA-GATK pipeline, there are multiple steps, and each step consists of various applications which behave distinctively. As shown in Table 3, the applications in some steps do not support multi-threading operations. These steps are problematic since there are only a few ways to improve performance.
Table 2. The steps in BWA-GATK pipeline and tools
Steps | Applications | Multi-threading support |
Mapping & Sorting | BWA, samtools, sambamba | Yes |
Mark Duplicates | Sambamba | Yes |
Generate Realigning Targets | GATK RealignerTargetCreator | Yes |
Insertion/Deletion Realigning | GATK IndelRealigner | No |
Base Recalibration | GATK BaseRecalibrator | Yes |
Haplotypercaller | GATK HaplotypeCaller | Yes |
Genotype GVCFs | GATK GenotypeGVCFs | Yes |
Variant Recalibration | GATK VariantRecalibrator | No |
Apply Variant Recalibration | GATK ApplyRecalibration | No |
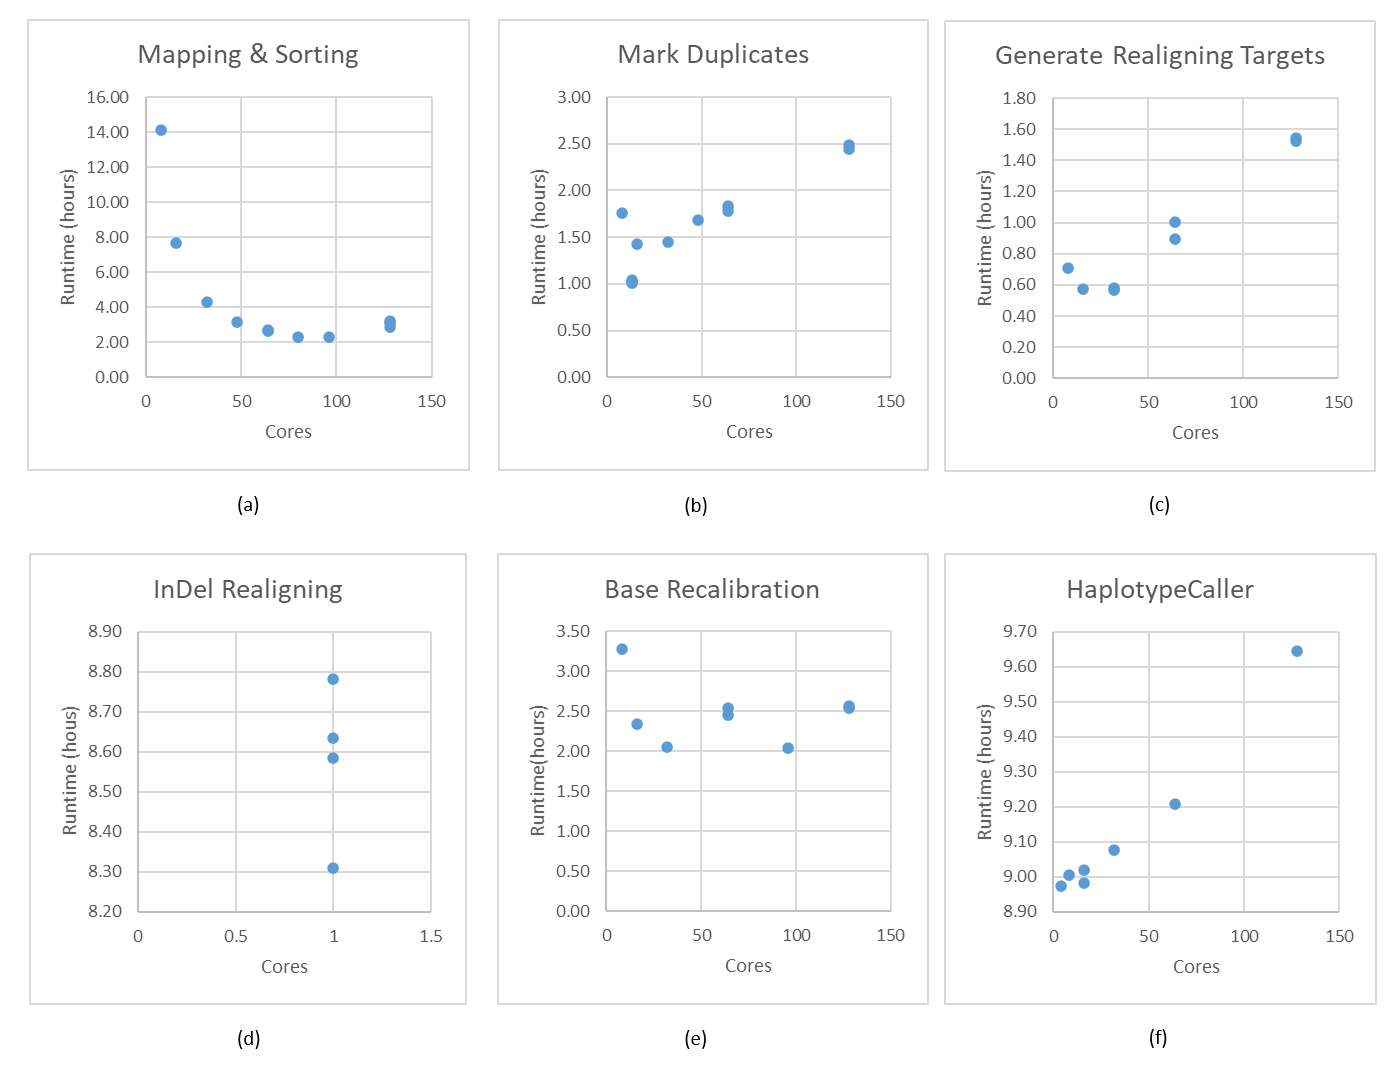
Single thread applications, especially Variant Recalibration and Apply Variant Recalibratrion steps show no runtime variation due to the deterministic algorithm and the inputs for these steps are small. Hence, these two steps are not reported in Figure 1. The first step, Mapping & Sorting scales as the number of cores increases (Figure 1, (a)). Also, Genotype GVCFs is not included in Figure 1 although it supports multi-threading operation for a similar reason.
Burrows-Wheeler Aligner (BWA) is one of the most popular short sequence aligners for non-gapped aligning analysis. BWA scales well until 32 cores, and CPU usage drops down dramatically after 32 cores. The runtime improvement becomes marginal with higher core numbers greater than 32. Using more than 80 cores for this step is the wasting of resources.
Sambamba which is compatible with Picard is used for marking duplicate reads. The behavior of sambamba is plotted in Figure 1, (b). Due to the highly parallelized nature of design, the memory consumption increases to create more hash tables for additional threads. Amazingly, 50x human whole genome sequence (WGS) is not big enough to use more than 13 cores for the well-designed software.
After Mark Duplicates step, Genome Analysis Tool Kit, hence GATK, written in Java plays a critical role in performance measurement and creating answers. These steps do not scale at all as shown in Figure 1, (c) (d) (e) and (f). A better approach will be discussed in future work to handle the misbehavior in multi-core and multi-socket environments.
Single Sample Performance
Socket to Socket Comparison
This test is not a fair comparison since the majority of steps will not take advantage of using all the cores except 7543 with 32 cores. However, this comparison will help to decide which CPU could be best for the throughput test.
Table 3 summarizes the overall runtimes for BWA-GATK pipeline, and it is hard to say which one is better in terms of total runtimes. A lot more tests are required to differentiate the performance differences in GATK steps. Also, the results from 7502 and 7402 were from the previous tests with different environments.
The mapping & Sorting step is the only step that we can peak the true performance variations across different CPUs in Table 3. A rough estimation of performance improvement from 7702 to 7763 is 7% while the performance gain is 5% from 7702 to 7713.
Surprisingly, the Base Recalibration step showed similar results as the Mapping & Sorting step, which is 8% and 3% improvement.
Table 3. BWA-GATK performance comparisons between Milan and Rome. The number of cores used for the test is parenthesized.
Steps | Runtime (hours) | |||||
AMD 7763 64c 2.45GHz | AMD 7713 64c 2.0GHz | AMD 7543 32c 2.8GHz | AMD 7702 64c 2.0GHz | AMD 7502 32c 2.5GHz | AMD 7402 24c 3.0GHz | |
Mapping & Sorting | 2.44 (64) | 2.49 (64) | 3.69 (32) | 2.63 (64) | 4.68 (32) | 5.73 (24) |
Mark Duplicates | 1.07 (13) | 1.10 (13) | 1.01 (13) | 1.01 (13) | 0.93 (13) | 0.94 (13) |
Generate Realigning Targets | 0.55 (32) | 0.56 (32) | 0.50 (32) | 0.58 (32) | 0.45 (32) | 0.44 (32) |
Insertion/Deletion Realigning | 8.73 (1) | 9.13 (1) | 7.73 (1) | 8.78 (1) | 8.30 (1) | 8.21 (1) |
Base Recalibration | 2.27 (32) | 2.38 (32) | 2.17 (32) | 2.46 (32) | 2.52 (32) | 2.67 (24) |
Haplotypercaller | 10.20 (16) | 10.57 (16) | 9.15 (16) | 9.02 (16) | 9.33 (16) | 9.05 (16) |
Genotype GVCFs | 0.02 (32) | 0.02 (32) | 0.01 (32) | 0.02 (32) | 0.01 (32) | 0.01 (24) |
Variant Recalibration | 0.31 (1) | 0.20 (1) | 0.17 (1) | 0.12 (1) | 0.21 (1) | 0.13 (1) |
Apply Variant Recalibration | 0.01 (1) | 0.01 (1) | 0.01 (1) | 0.01 (1) | 0.01 (1) | 0.01 (1) |
Total Runtime (hours) | 25.59 | 26.47 | 24.44 | 24.64 | 26.46 | 27.25 |
Multiple Sample Performance - Throughput
A typical way of running an NGS pipeline is to process multiple samples on a compute node and use multiple compute nodes to maximize the throughput. However, this time the tests were performed on a single compute node due to the limited number of servers available at this moment.
The current pipeline invokes a large number of pipe operations in the first step to minimize the amount of writing intermediate files. Although this saves a day of runtime and lowers the storage usage significantly, the cost of invoking pipes is quite heavy. Hence, this limits the number of concurrent sample processing. Typically, a process silently fails when there is not enough resource left to start an additional process.
However, the failures experiencing during this study are quite different from the previous observations. 10 pipelines started in R6525 with 2x 7763 sustain only 6 pipelines on average with the 50x human WGS. Four pipelines are failed with the broken pipes error which suggests some sort of file operation. Current BeeGFS storage for the test is designed for high capacity, theoretical sequential write bandwidth of 25 GB/s. However, roughly 16 GB/s is achievable where there is not heavy usage loaded on this storage in a shared storage environment. This is not an ideal environment for any benchmark practice; however, the results here are quite helpful to see what the performance of these systems looks like in a real life.
As shown in Table 4, the maximum number of samples that can be processed at the same time is around 4 or 5, and the ~ 4.79 50x human whole genomes per day throughput is achievable with the current environment.
Table 4. Throughput test for Milan 7763
Steps | Runtime (hours) | ||||
1 Sample | 2 Samples | 4 Samples | 6 Samples | 10 Samples | |
Number of Samples Failed | 0 | 0 | 0 | 1 | 4 |
Mapping & Sorting | 2.44 | 2.91 | 4.33 | 5.86 | 8.33 |
Mark Duplicates | 1.07 | 1.40 | 1.69 | 1.31 | 5.51 |
Generate Realigning Targets | 0.55 | 0.88 | 1.77 | 0.50 | 2.07 |
Insertion/Deletion Realigning | 8.73 | 8.97 | 8.92 | 8.92 | 9.70 |
Base Recalibration | 2.27 | 2.50 | 2.79 | 3.26 | 3.67 |
Haplotypercaller | 10.20 | 10.57 | 10.27 | 9.91 | 9.96 |
Genotype GVCFs | 0.02 | 0.11 | 0.10 | 0.10 | 0.15 |
Variant Recalibration | 0.31 | 0.25 | 0.20 | 0.21 | 0.36 |
Apply Variant Recalibration | 0.01 | 0.02 | 0.01 | 0.01 | 0.03 |
Total Runtime (hours) | 25.59 | 27.62 | 30.08 | 30.08 | 39.79 |
Genomes per day | 0.94 | 1.74 | 4.79 | 3.99 | 3.62 |
Conclusion
The field of NGS data analysis has been moving fast in terms of data growth and data variations. However, the community has not been done much work adapting new technologies available such as accelerators. Instead of improving the quality of codes, the community is faced with analyzing the data without multi-thread processing since GATK version 4 and up does not support multi-threading anymore while the number of cores in a CPU increases fast.
It is time that users need to think about how this problem can be tackled. One simple way to avoid this problem is to perform data-level parallelization. Although the decision-making of when to split data is pretty hard, it is certainly tractable with careful interventions in an existing BWA-GATK pipeline without diluting statistical power with a sheer number of data. If each smaller data chunk goes through an individual pipeline on each core and is merged at the end, it could be possible to achieve better performance on a single sample. This performance gain could lead to higher throughput if the overall runtime reduces significantly.
Nonetheless, Milan 7763 or 7713 are an excellent candidate to cover both current multi-threading-based pipelines and future data-level parallelization driven pipelines with more available cores.
Related Blog Posts

Tuxedo Pipeline Performance on Dell EMC PowerEdge R6525
Tue, 27 Apr 2021 03:48:30 -0000
|Read Time: 0 minutes
Overview
Gene expression analysis is as important as identifying Single Nucleotide Polymorphism (SNP), insertion/deletion (indel), or chromosomal restructuring. Ultimately, all physiological and biochemical events depend on the final gene expression products, proteins. Although most mammals have an additional controlling layer before protein expression, knowing how many transcripts exist in a system helps to characterize the biochemical status of a cell. Ideally, technology would enable us to quantify all proteins in a cell, which would significantly advance the progress of Life Science. However, we are far from achieving this.
This blog provides the test results of one popular RNA-Seq data analysis pipeline known as the Tuxedo pipeline (1). The Tuxedo pipeline suite offers a set of tools for analyzing a variety of RNA-Seq data, including short-read mapping, identification of splice junctions, transcript, and isoform detection, differential expression, visualizations, and quality control metrics. The tested workflow is a differentially expressed gene (DEG) analysis, and the detailed steps in the pipeline are shown in Figure 1.
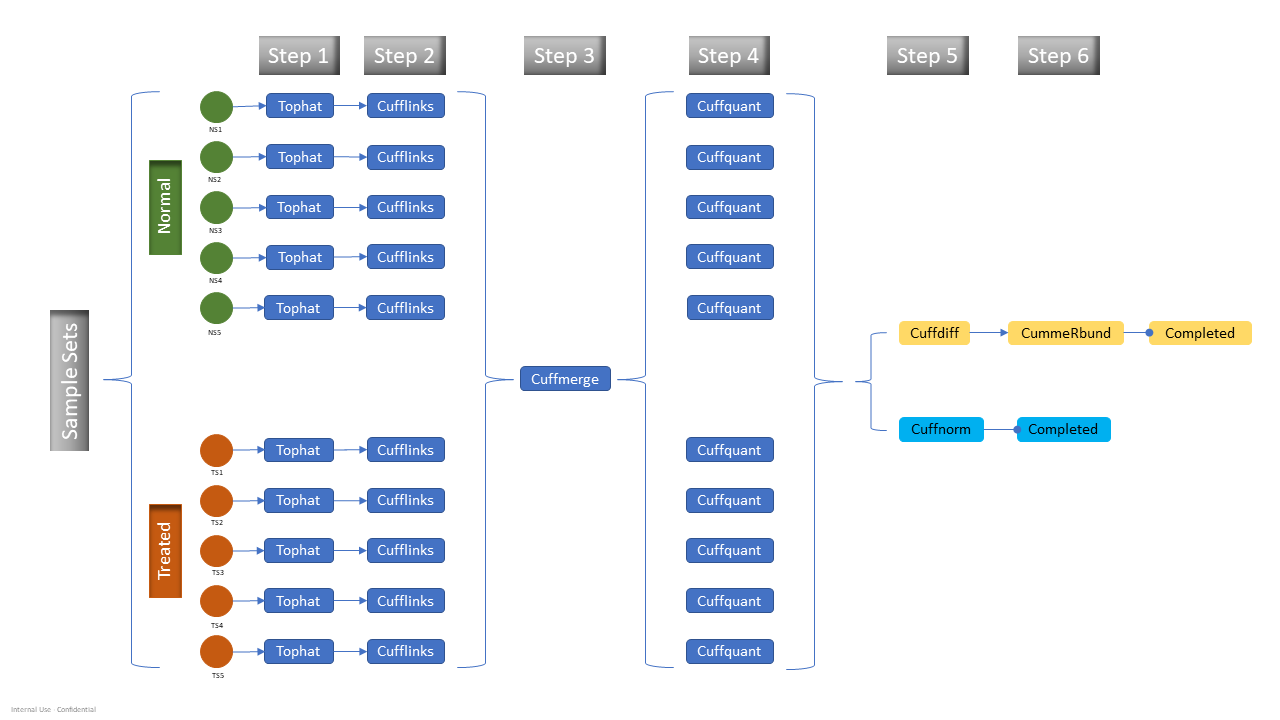
Figure 1. Updated tuxedo pipeline with cuffquant step
A single node study with AMD EPYC 7002 series (Rome) and AMD EPYC 7003 series (Milan) on Dell EMC PowerEdge R6525 server was done. The configurations of the test system are summarized in Table 1.
Table 1. Tested compute node configuration
| Dell EMC PowerEdge R6525 | |
|---|---|
| CPU | Tested AMD Milan: 2x 7763 (Milan), 64 Cores, 2.45 GHz – 3.5 GHz Base-Boost, TDP 280 W, 256 MB L3 Cache 2x 7713 (Milan), 64 Cores, 2.0 GHz – 3.7 GHz Base-Boost, TDP 225 W, 256 MB L3 Cache 7543 (Milan), 32 Cores, 2.8 GHz – 3.7 GHz Base-Boost, TDP 225 W, 256 MB L3 Cache
Tested AMD Rome: 7702 (Rome), 64 Cores, 2.0 GHz – 3.35 GHz Base-Boost, TDP 200 W, 256 MB L3 Cache |
| RAM | DDR4 256 GB (16 Gb x 16) 3200 MT/s |
| Operating system | RHEL 8.3 (4.18.0-240.el8.x86_64) |
| Interconnect | Mellanox InfiniBand HDR100 |
| Filesystem | Dell EMC Ready Solutions for HPC BeeGFS High Capacity Storage |
| BIOS system profile | Performance optimized |
| Logical processor | Disabled |
| Virtualization technology | Disabled |
| tophat | 2.1.1 |
| bowtie2 | 2.2.5 |
| R | 3.6 |
| bioconductor cummerbund | 2.26.0 |
A performance study of the RNA-Seq pipeline is not trivial because the nature of the workflow requires non-identical input files yet similar input files in size. Hence, 185 RNA-Seq paired-end read data are collected from a public data repository. All the read datafiles contain around 25 Million Fragments (MF) and have similar read lengths. The samples for a test are randomly selected from the pool of the 185 paired-end read files. Although these test data will not have any biological meaning, certainly these data with the high level of noise will put the tests in the worst-case scenario.
Performance Evaluation
Throughput test - Single pipeline with more than two samples, biological, and technical duplicates
Typical RNA-Seq studies consist of multiple samples, sometimes 100s of different samples, normal versus disease, or untreated versus treated samples. These samples tend to have a high level of noise due to biological reasons; hence, the analysis requires vigorous data preprocessing procedure.
A number of various samples were processed, with different RNA-Seq data selected from 185 paired-end reads dataset, to see how much data a single node can process. Typically, when the number of samples increases, the runtime of the Tuxedo pipeline increases. However, as shown in the figure below, the runtimes with two sample tests using 7713, are higher than the runtimes from four samples. The standard error from five repeated runs does not overlap with four and eight sample results. The interference of other users may cause this large variance. The current testing environment, especially a shared file system designed for large capacity, is not ideal for a Next Generation Sequencing (NGS) data analysis benchmark.
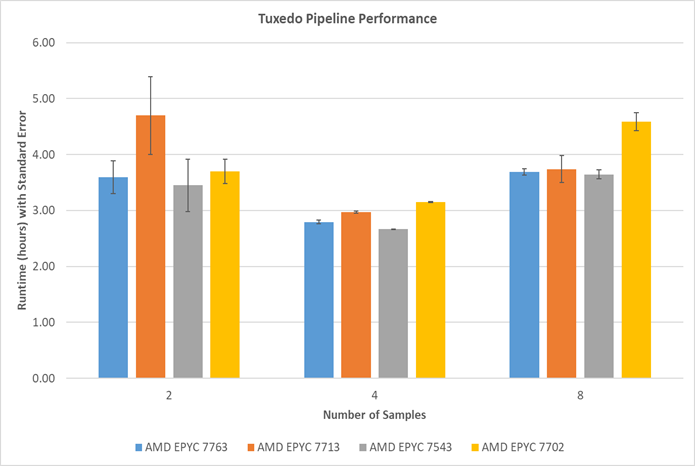
Figure 2. Runtime comparisons among various AMD EPYC 7003 Series processors: Standard error is estimated from an estimated standard deviation based on a sample (STDDEV.S function in Excel)
The eight sample test results show that AMD Milan processors perform better than one of the Rome processors (7702) in a higher workload.
Conclusion
Many tests are still required to obtain a better insight from the AMD Milan processors for the NGS data analysis area. Unfortunately, the tests could not exceed eight samples due to storage limitations. However, there seems to be plenty of room for a higher throughput that processes more than eight samples together. AMD Milan 7763 performed 20% better than AMD Rome 7702. AMD Milan 7713 performed 18% better in eight sample tests for the Tuxedo pipeline as described in Figure 2.

The Dell PowerEdge C6615: Maximizing Value and Minimizing TCO for Dense Compute and Scale-out Workloads
Mon, 02 Oct 2023 21:35:01 -0000
|Read Time: 0 minutes
In the ever-evolving landscape of data centers and IT infrastructure, meeting the demands of scale-out workloads is a continuous challenge. Organizations seek solutions that not only provide superior performance but also optimize Total Cost of Ownership (TCO).
Enter the new Dell PowerEdge C6615, a modular node designed to address these challenges with innovative solutions. Let's delve into the key features and benefits of this groundbreaking addition to the Dell PowerEdge portfolio.
Industry challenges
- Maximizing Rack utilization: One of the primary challenges in the data center world is maximizing rack utilization. The Dell PowerEdge C6615 addresses this by offering dense compute options.
- Cutting-edge processors: High-performance processors are crucial for scalability and security. The C6615 is powered by a 4th Generation AMD EPYC 8004 series processor, ensuring top-tier performance.
- Total Cost of Ownership (TCO): TCO is a critical consideration that encompasses power and cooling efficiency, licensing costs, and seamless integration with existing data center infrastructure. The C6615 is designed to reduce TCO significantly.
Introducing the Dell PowerEdge C6615
The Dell PowerEdge C6615 is a modular node designed to revolutionize data center infrastructure. Here are some key highlights:
 Price-performance ratio: The C6615 offers outstanding price per watt for scale-out workloads, with up to a 315% improvement compared to a one-socket (1S) server with AMD EPYC 9004 Series server processor.
- Optimized thermal solution: It features an optimized thermal solution that allows for air-cooling configurations with up to 53% improved cooling performance compared to the previous generation chassis.
- Density-optimized compute: The C6615's architecture is tailored for scale-out WebTech workloads, offering exceptional performance with reduced TCO.
- High-speed NVMe storage: It provides high-speed NVMe storage for applications with intensive IOPS requirements, ensuring efficient performance.
- Efficient scalability: With 40% more cores per rack compared to the AMD EPYC 9004 Series server processors, the C6615 allows for quicker and more efficient scalability.
- SmartNIC: It includes a SmartNIC with hardware-accelerated networking and storage, saving CPU cycles and enhancing security.
Key features
To maximize efficiency and reduce environmental impact, the PowerEdge C6615 incorporates several key features:
 Power and thermal efficiency: The 2U chassis with four nodes enhances power and thermal efficiency, eliminating the need for liquid cooling.
- Flexible I/O options: It supports up to two PCIe Gen5 slots and one 16 PCIe Gen5 OCP 3.0 slot for network cards, ensuring versatile connectivity.
- Security: Security is integrated at every phase of the PowerEdge lifecycle, from supply chain protection to Multi-Factor Authentication (MFA) and role-based access controls.
Accelerating performance
In benchmark testing, the C6615 outperforms the competition:
- HPL Benchmark: It showcases up to a 335% improvement in performance per watt per dollar and a 210% increase in performance per CPU dollar compared to other 1S systems with the AMD EPYC 9004 Series server processor.
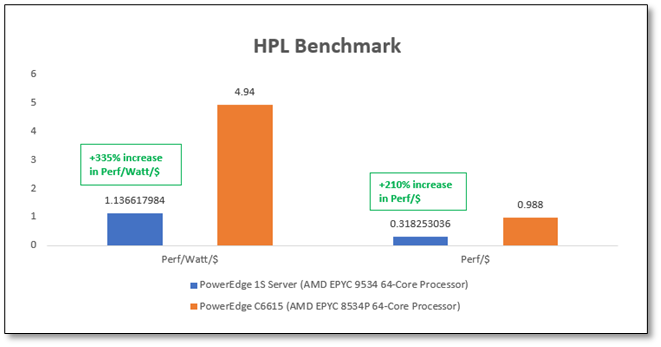
Figure 1. HPL benchmark performance
- SPEC_CPU2017 Benchmark: Results demonstrate up to a 205% improvement in performance per watt per dollar and a remarkable 128% increase in performance per CPU dollar compared to similar systems.
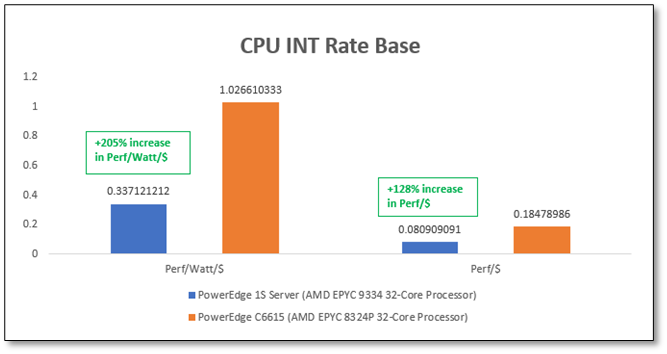
Figure 2. SPEC_CPU2017 benchmark performance
Final thoughts
The seamless integration of the Dell PowerEdge C6615 into existing processes and toolsets is facilitated by comprehensive iDRAC9 support for all components. This ensures a smooth transition while leveraging the full potential of your server infrastructure.
Dell's commitment to environmental sustainability is evident in its use of recycled materials and energy-efficient options, helping to reduce carbon footprints and operational costs.
In conclusion, the Dell PowerEdge C6615 emerges as a leading dense compute solution, delivering exceptional value and unmatched performance. For more information, visit the PowerEdge Servers Powered by AMD site and explore how this innovative solution can transform your data center operations.
Note: Performance results may vary based on specific configurations and workloads. It's recommended to consult with Dell or an authorized partner for tailored solutions.
Author: David Dam