


AMD EPYC Milan Processors and FFC Mode Accelerate Oracle 244%
Thu, 06 May 2021 18:54:59 -0000
|Read Time: 0 minutes
Intriguing, right? The Oracle team at Dell Technologies recently configured a Dell EMC PowerEdge server equipped with the new AMD EPYC processors to test the performance of an Oracle 19c database feature called Force Full Cache (FFC) mode. When using FFC mode, the Oracle server attempts to cache the full database footprint in buffer cache memory. This effectively reduces the read latency from what would have been experienced with the storage system to memory access speed. Writes are still sent to storage to ensure durability and recovery of the database. What’s fascinating is that by using Oracle’s FFC mode, the AMD EPYC processors can accelerate database operations while bypassing most storage I/O wait times.
For this performance test our PowerEdge R7525 server was populated with two AMD EPYC 7543 processors with a speed of 2.8 GHz, each with 32 cores. There are several layers of cache in these processors:
- Zen3 processor core, includes an L1 write-back cache
- Each core has a private 512 KB L2 cache
- Up to eight Zen3 cores share a 32 MB L3 cache
Each processor also supports 8 memory channels and each memory channel supports up to 2 DIMMS. With all these cache levels and memory channels our hypothesis was that the AMD EPYC processors were going to deliver amazing performance. Although we listed the processor features we believe will most impact performance, in truth there is much more to these new processors that we haven’t covered. The AMD webpage on modern data workloads is an excellent overview. For a deep dive into RDBMS tuning, this white paper provides more great technical detail.
For the sake of comparison, we also ran an Oracle database without FFC mode on the same server. Both database modes used the exact same technology stacks:
- Oracle Enterprise Edition 19c (19.7.0.0.200414)
- Red Hat Enterprise Linux 8.2
- VMware vSphere ESXi 7.0 Update 1
We virtualized the Oracle database instance since that is the most common deployment model in use today. AMD and VMware are continuously working to optimize the performance of high value workloads like Oracle. In the paper, “Performance Optimizations in VMware vSphere 7.0 U2 CPU Scheduler for AMD EPYC Processors” VMware shows how their CPU scheduler achieves up to 50% better performance than vSphere 7.0 U1. As the performance gap narrows between bare metal and virtualized applications, the gains in agility with virtualization outweigh the minor performance overhead of a hypervisor. The engineering team performing the testing used VMware vSphere virtualization to configure a primary Oracle virtual machine that was cloned to a common starting configuration.
HammerDB is a leading benchmarking tool used with databases like Oracle, Microsoft SQL Server and others. The engineering team used HammerDB to generate a TPROC-C workload on the database VM. The TPROC-C benchmark is referred to as an Online Transaction Processing (OLTP) workload because it simulates terminal operators executing transactions. When running the TPROC-C workload the storage system must support thousands of small read and write request per minute. With a traditional configuration, Oracle’s buffer cache would only be able to accelerate a portion of the reads and writes. The average latency of the system will increase when more reads and writes go to storage system as the wait times are greater for physical storage operations than memory. This is what the team expects to observe with the Oracle database that is not configured for FFC mode. Storage I/O is continually getting faster but not nearly as fast as I/O served from memory.
Once the test tool warms the cache, most of the reads will be serviced from memory rather than from storage, providing what we hope will be a significant boost in performance. We will not be able to separate out the individual performance benefits of using AMD EPYC processors combined with Oracle’s FFC mode, however, the efficiencies gained via AMD caches, memory channels, and a VMware vSphere optimizations will make this performance test fun!
Before reviewing the performance results, it is important that we review the virtual machine, storage, and TPROC-C workload configurations. One important difference between the baseline virtual machine (no FFC mode) and the database configuration with FFC mode enabled is the memory allocated to the SGA. A key consideration is that the logical database size is smaller than the individual buffer cache. See the Oracle 19c Database Performance Tuning Guide for a complete list of considerations. In this case the SGA size is 784 GB to accommodate caching the entire database in the Oracle buffer cache. All other configuration parameters like vCPU, memory, and disk storage were identically configured.
Using memory technologies like Force Full Cache mode should be a key consideration for the Enterprise as the AMD EPYC processors enable the PowerEdge R7525 servers to support up to 4 TB of LRDIMM. Depending upon the database and its growth rate, this could support many small to medium- sized systems. The advantage for the business is the capability to accelerate the database by configuring a Dell EMC PowerEdge R7525 server and AMD processors with enough memory to cache the entire database.
Table 1: Virtual Machine configuration and SGA size
Component | Oracle Baseline | Oracle Force Full Cache Mode |
vCPU | 32 | 32 |
Memory | 960 GB | 960 GB |
Disk Storage | 400 GB | 400 GB |
SGA Size | 64 GB | 784 GB |
This database storage configuration includes using VMware vSphere’s Virtual Machine File System (VMFS) and Oracle’s Automatic Storage Management (ASM) on Direct Attached Storage (DAS). The storage configuration is detailed in the table below. ASM Normal redundancy mirrors each extent providing the capability to protect against one disk failure.
Table 2: Storage and ASM configuration
Storage Group | Size (GB) | ASM Redundancy |
Data | 800 | Normal |
Redo | 50 | Normal |
FRA | 50 | Normal |
TEMP | 250 | Normal |
OCR | 50 | Normal |
We used HammerDB to create a TPROC-C database with 5,000 simulated warehouses which generated approximately 500 GB of data, whichwas small enough to be loaded entirely in the buffer cache. Other HammerDB settings we used included those shown in this table:
Table 3: HammerDB: TPROC-C test configuration
Setting | Value |
Time Driver Script | Yes |
Total Transactions per user | 1,000,000 |
Minutes of Ramp Up Time | 5 |
Minutes of Test Duration | 55 |
Use All Warehouses | Yes |
Number of Virtual Users | 16 |
New Orders Per Minute (NOPM) is a metric that indicates the number of orders that were fully processed in one minute. This performance metric provides insight into the performance of the database system and can be used to compare two different systems running the same TPROC-C workload. The AMD EYPC processors combined with FFC mode delivered an outstanding 244% more NOPM than the baseline system. This is a powerful finding because it shows how tuning the hardware and software stack can accelerate database performance without adding more resources. In this case the optimal technology stack included AMD EYPC processors which, when combined with Oracle’s FFC mode, accelerated NOPM by 2.4 times the baseline.
Figure 1: New Orders Per Minute Comparison
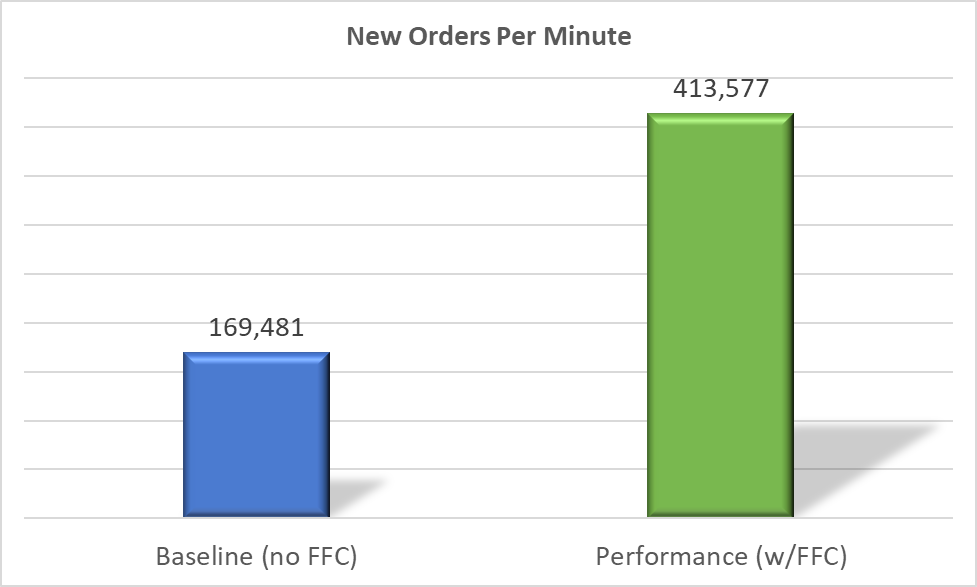
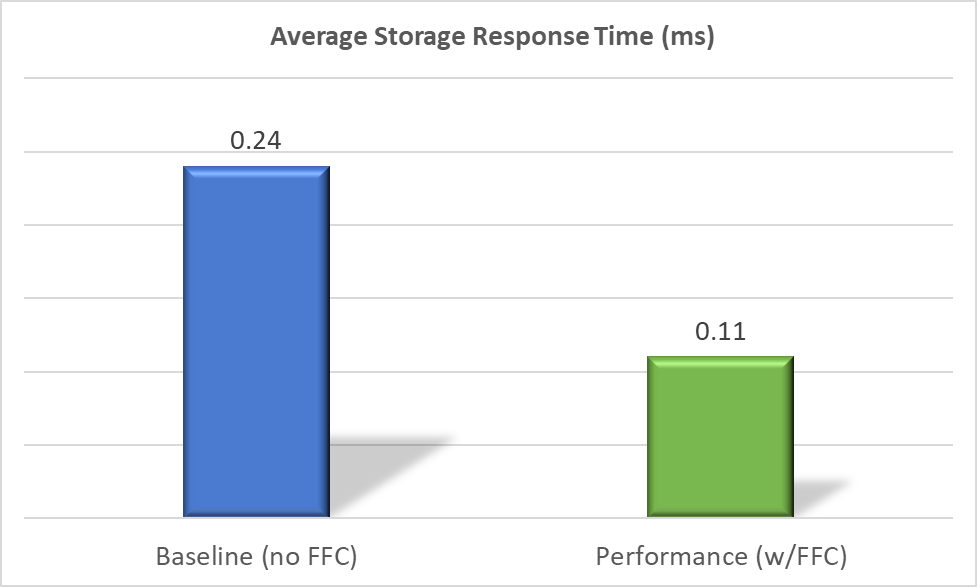
What factors played a role in boosting performance? The Average Storage Response Time chart for the baseline test shows that the system’s average storage response time was .24 milliseconds. The goal of OLTP production systems is that most storage response times should be less than 1 millisecond as this is an indication of healthy storage performance. Thus, the baseline system was demonstrating good performance; however, even with the minimal storage response times the system only achieved 169,481 NOPM.
With FFC mode enabled, the entire database resided in the database buffer cache. This resulted in fewer physical reads and faster average storage response times. Results show the average storage response time with FFC was less than half the baseline numbers at just .11 milliseconds, or 2.2 times faster than the baseline. With most of the I/O activity working in memory the AMD EYPC processor cache and memory channel features provided a big boost in accelerating the database workload!
Figure 2: Average Storage Response Time
The combination of AMD EYPC processors with Oracle’s Force Full Cache mode should provide extremely good performance for databases that are smaller than 4 TBs. Our test results show an increase in 244% in New Orders per Minute and faster response time, meaning that this solution stack built on the PowerEdge R7525 can accelerate an Oracle database that fits the requirements of FFC mode. Every database system is different, and results will vary. But in our tests this AMD-based solution provided substantial performance.
Supporting detail:
Table 4: PowerEdge R7525 Configuration
Component | Detail |
Processors | 2 x AMD EPYC 7543 32-Core processors @ 2800 MHz |
Memory | 16 x 128GB @ 3200 MHz (for a total of 2TB) |
Storage | 8 x Dell Express Flash NVMe P4610 1.6TB SFF (Intel 2.5 inch 8GT/s) |
Embedded NIC | 1 x Broadcom Gigabit Ethernet BC5720 |
Integrated NIC | 1 x Broadcom Advanced Dual Port 25 Gb Ethernet |
Related Blog Posts

Part I: Is AMD ROCm™ Ready to Deploy Leading AI Workloads?
Thu, 09 Nov 2023 23:21:48 -0000
|Read Time: 0 minutes
 PowerEdge R7615
 AMD Instinct MI210 Accelerator
Today, Innovation is GPU constrained, and we are seeing explosive growth in AI workloads, namely transformer based models for Generative AI. This blog explores AMD ROCm™ software and AMD GPUs, and AMD readiness for primetime.
AMD ROCm™ or Radeon Open eCosystem (ROCm) was launched in 2016 as an open-source software foundation for GPU computing in Linux, providing developers with tools to leverage GPUs compute capacity to advance their workloads across applications including high performance computing and advanced rendering. It provides a comprehensive set of tools and libraries for programming GPUs in a variety of languages, including C++, Python, and R.
| AMD ROCm™ can be used to accelerate a variety of workloads, such as:
- Scientific computing and computer-aided design (CAD): AMD ROCm™ can accelerate scientific simulations, such as molecular dynamics and computational fluid dynamics.
- Artificial Intelligence: AMD ROCm™ can be used to train and deploy AI models faster and more efficiently.
- Data science: AMD ROCm™ can accelerate data processing and analytics tasks.
- Graphics and visualization: AMD ROCm™ can create and render high-performance graphics and visualizations.
With the broad and rising adoption of Generative AI driving the need for parallel computational power of GPUs to train, fine-tune, and deploy deep learning models, AMD ROCm™ has expanded support for the leading AI frameworks in TensorFlow, PyTorch, ONNX runtime, and more recently Hugging Face.
Hugging Face and AMD announced a collaboration to support AMD ROCm™ and hardware platforms to deliver leadership transformer performance on AMD CPUs and GPUs for training and inference. The initial focus will be on AMD Instinct™ MI2xx and MI3xx series GPUs¹.
AMD and Hugging Face plan to support transformer architectures for natural language processing, computer vision, and speech. Plans also include traditional computer vision models and recommendation models.
| “We will integrate AMD ROCm™ SDK seamlessly in our open-source libraries, starting with the transformers library.”
Further, Hugging Face highlighted plans for a new Optimum library dedicated to AMD¹. In addition to the growing ecosystem for AI software support for AMD ROCm™, Dell™ offers a portfolio of leading edge PowerEdge™ hardware supporting AMD ROCm™ and the AMD MI210 across Dell™ PowerEdge™ R760xa and R7615 servers.
The breadth of hardware offerings gives enterprise users of AMD ROCm™ robust hardware choices to pair with fast-advancing software support.
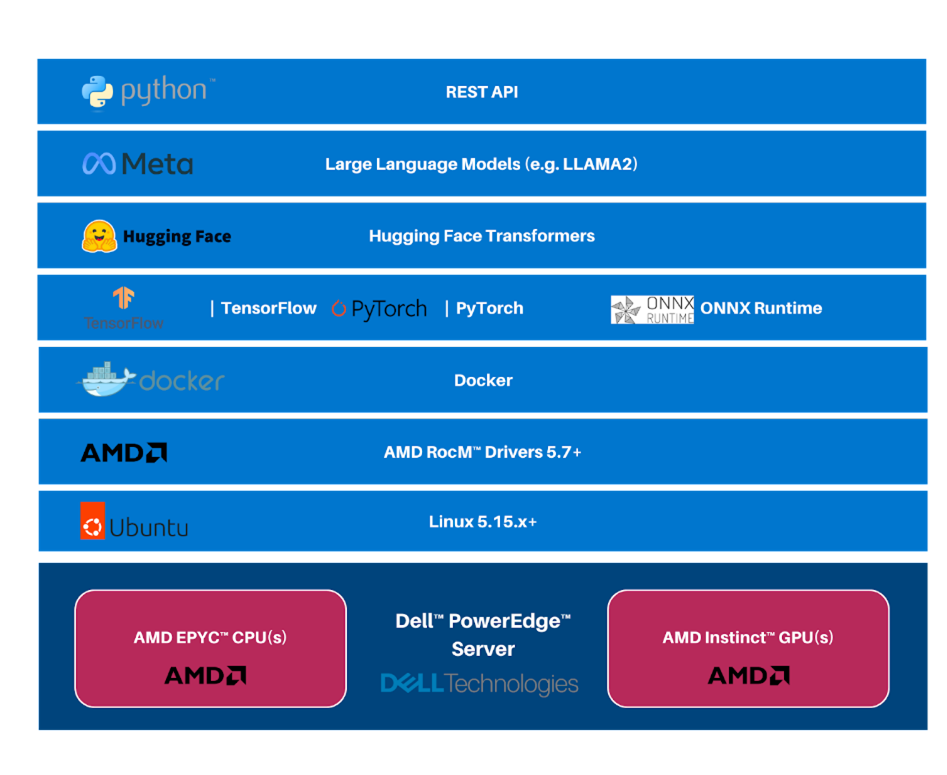
The architecture above showcases the robust availability of AMD ROCm™ software and Hugging Face integration, allowing developers to run leading transformer models optimized on AMD Instinct™ GPUs today. Dell™ offers a robust portfolio of PowerEdge™ servers that support GPUs supported by AMD ROCm™.
This enables customers to easily get the hardware needed to test, develop, and deploy AI solutions with AMD ROCm™.
| So is AMD ROCm™ Ready for AI Workloads?
Though the AMD ROCm™ adoption and ecosystem maturity are nascent, the support of leading AI frameworks and collaboration with key ecosystem partners such as Hugging Face, paired with AMD advancements in GPU Hardware, make it ready to take on the leading AI workloads today.
In part II of this blog series, we will put the architecture to the test and develop a LLM-based chatbot on Dell™ PowerEdge™ servers with AMD ROCm™ and AMD GPUs.
| References
https://huggingface.co/blog/huggingface-and-amd
| Authors
Steen Graham, CEO of Scalers AI
Delmar Hernandez, Dell PowerEdge Technical Marketing
Mohan Rokkam, Dell PowerEdge Technical Marketing

Part II | How to Run Hugging Face Models with AMD ROCm™ on Dell™ PowerEdge™?
Tue, 14 Nov 2023 16:27:00 -0000
|Read Time: 0 minutes
In case you’re interested in learning more about how Dell and Hugging Face are working together, check out the November 14 announcement detailing how the two companies are simplifying GenAI with on-premises IT.
 PowerEdge R7615
 AMD Instinct MI210 Accelerator
In our first blog, we explored the readiness of the AMD ROCm™ ecosystem to run modern Generative AI workloads. This blog provides a step-by-step guide to running Hugging Face models on AMD ROCm™ and insights on setting up TensorFlow, PyTorch, and GPT-2.
Dell PowerEdge offers a rich portfolio of AMD ROCm™ solutions, including Dell™ R7615, R760xa, R7615, and R7625 PowerEdge™ servers.
For this blog, we selected the Dell PowerEdge R7615.
| System Configuration Details
Operating system: Ubuntu 22.04.3 LTS
Kernel version: 5.15.0-86-generic
Docker Version: Docker version 24.0.6, build ed223bc
ROCm version: 5.7
Server: Dell™ PowerEdge™ R7615
CPU: AMD EPYC™ 9354P 32-Core Processor
GPU: AMD Instinct™ MI210
| Step-by-Step Guide
1. First, Install the AMD ROCm™ driver, libraries, and tools. Follow the detailed installation instructions for your Linux based platform.
To ensure these installations are successful, check the GPU info using `rocm-smi.`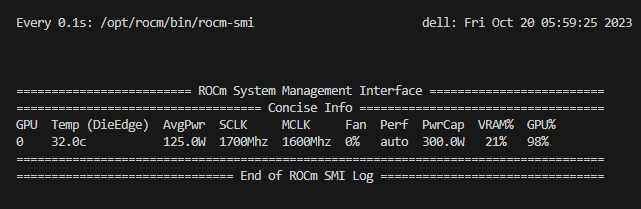
2. Next, we will select code snippets from Hugging Face. Hugging Face offers the most comprehensive developer tools for leading AI models. We will choose GPT2 code snippets for both TensorFlow and PyTorch.
| Running GPT2 on AMD ROCm™ with TensorFlow
Here, we use the AMD ROCm™ docker image for TensorFlow and launch GPT2 inference on an AMD™ GPU.
3. Use docker images for TensorFlow with AMD ROCm™ backend support to expedite the setup
Unset sudo docker run -it \ --network=host \ --device=/dev/kfd \ --device=/dev/dri \ --ipc=host \ --shm-size 16G \ --group-add video \ --cap-add=SYS_PTRACE \ --security-opt seccomp=unconfined \ --workdir=/dockerx \ -v $HOME/dockerx:/dockerx rocm/tensorflow:latest /bin/bash |
4. Run TensorFlow code from Hugging Face to infer GPT2 successfully inside a Docker container with the AMD™ GPU, using the following snippet
Python from transformers import TFGPT2LMHeadModel, GPT2Tokenizer
tokenizer = GPT2Tokenizer.from_pretrained("gpt2") GPT2 = TFGPT2LMHeadModel.from_pretrained("gpt2") prompt = "What is Quantum Computing?"
input_ids = tokenizer.encode(prompt, return_tensors='tf')
output = GPT2.generate(input_ids, max_length = 100) print(tokenizer.decode(output[0], skip_special_tokens = True)) |
| Running GPT2 on AMD ROCm™ with PyTorch
5. Use docker images for PyTorch with AMD ROCm™ backend support to expedite the setup
Unset sudo docker run -it \ --network=host \ --device=/dev/kfd \ --device=/dev/dri \ --ipc=host \ --shm-size 16G \ --group-add=video \ --cap-add=SYS_PTRACE \ --security-opt seccomp=unconfined \ --workdir=/dockerx \ -v $HOME/dockerx:/dockerx rocm/pytorch:rocm5.7_ubuntu22.04_py3.10_pytorch_2.0.1 /bin/bash |
6. Use the snippet below to run a PyTorch from Hugging Face script in a Docker container
| Python from transformers import GPT2Tokenizer, GPT2LMHeadModel
tokenizer = GPT2Tokenizer.from_pretrained('gpt2', device_map="auto") model = GPT2LMHeadModel.from_pretrained('gpt2', device_map="auto") prompt = "What is Quantum Computing?"
encoded_input = tokenizer(prompt, return_tensors='pt') encoded_input = encoded_input.to('cuda')
output = model.generate(**encoded_input, max_length=100) print(tokenizer.decode(output[0], skip_special_tokens = True)) |
| As you can see, AMD ROCm™ has a rich ecosystem of support for leading AI frameworks like PyTorch, TensorFlow, and Hugging Face to set up and deploy industry-leading transformer models.
If you are interested in trying different models from Hugging Face, you can refer to the comprehensive set of transformer models supported here: https://huggingface.co/docs/transformers/index
Our next blog shows you how to run Llama-2 in a chat application, arguably the leading large language model available to developers today using Hugging Face.
| References
- https://huggingface.co/amd
- https://huggingface.co/docs/transformers/index
- https://rocm.docs.amd.com/en/latest/deploy/linux/quick_start.html
- https://medium.com/@qztseng/install-and-build-tensorflow2-3-on-amd-gpu-with-rocm-7c812f922f57
- https://hub.docker.com/r/rocm/pytorch/tags
| Authors:
Steen Graham, CEO of Scalers AI
Delmar Hernandez, Dell PowerEdge Technical Marketing
Mohan Rokkam, Dell PowerEdge Technical Marketing