
Our results
Our results
-
To learn more about how we have calculated the wins in this report, go to http://facts.pt/calculating-and-highlighting-wins. Unless we state otherwise, we have followed the rules and principles we outline in that document.
Table 1: Results of our Weathervane 2.0 testing.
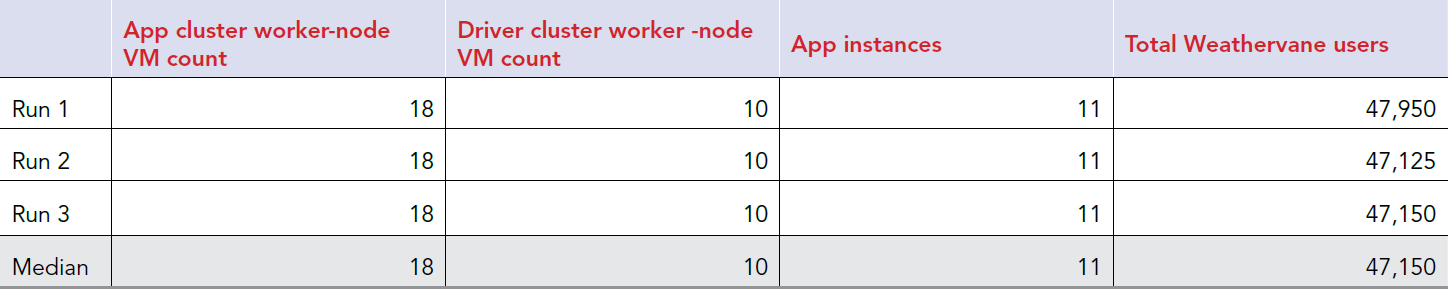
Figures 1 through 5 show system-level outputs for the Dell EMC PowerEdge R750 server used in our testing.
Figure 1: CPU utilization for the Dell EMC PowerEdge R750 server used in our testing. Source: Principled Technologies.
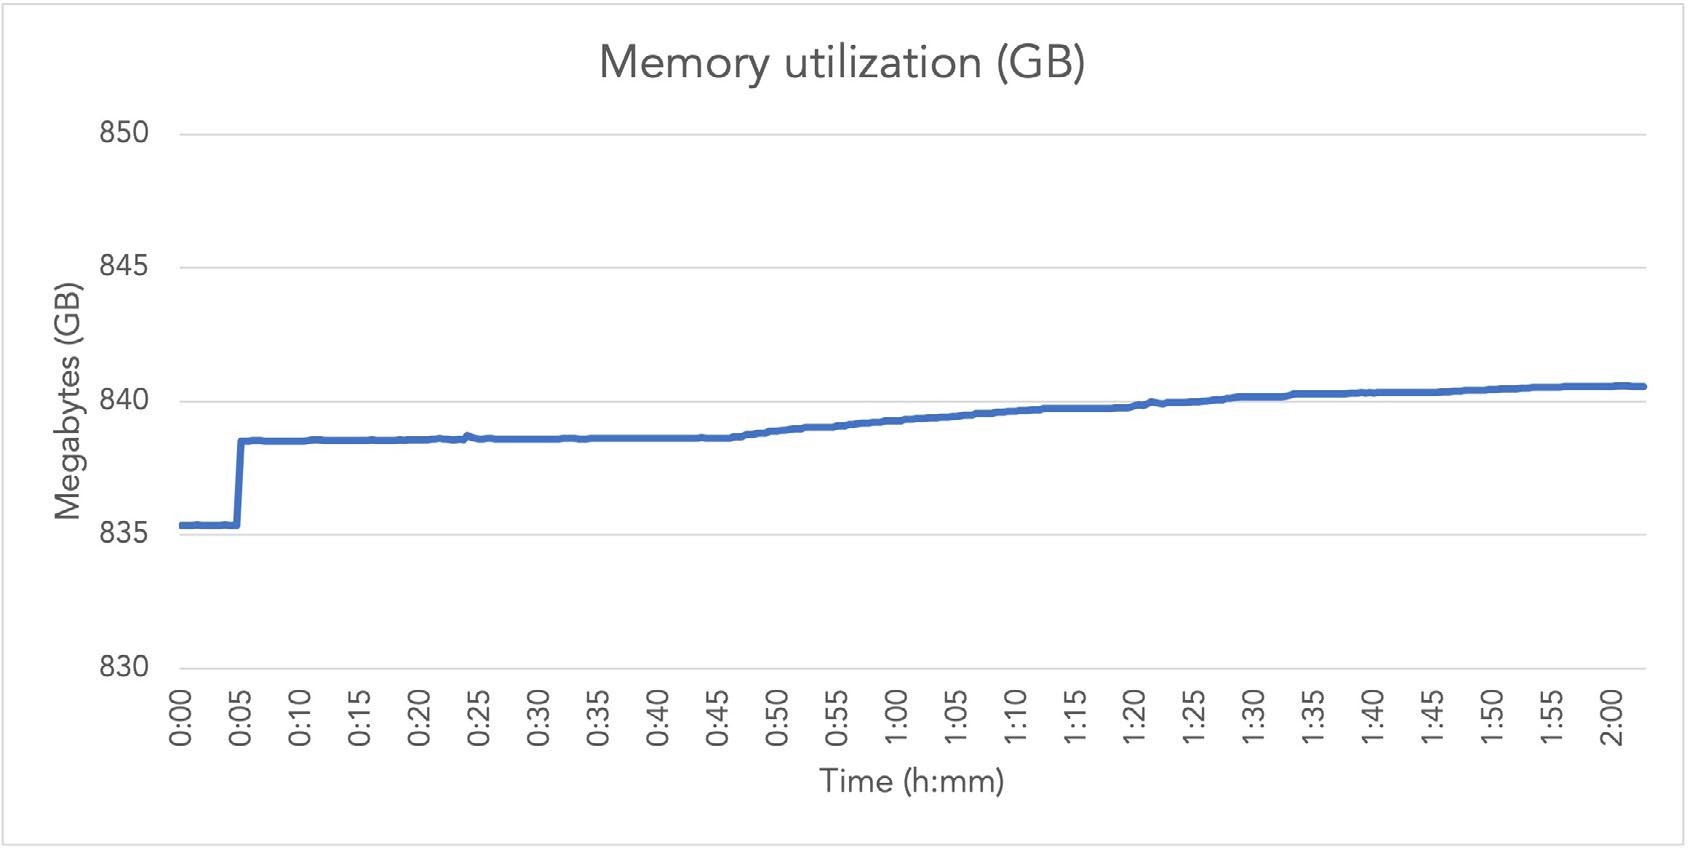
Figure 2: Memory utilization for the Dell EMC PowerEdge R750 server used in our testing. Source: Principled Technologies.

Figure 3: The total IOPS processed by the Dell EMC PowerEdge R750 server used in our testing. Source: Principled Technologies.

Figure 4: The total read IOPS processed by the Dell EMC PowerEdge R750 server used in our testing. Source: Principled Technologies.
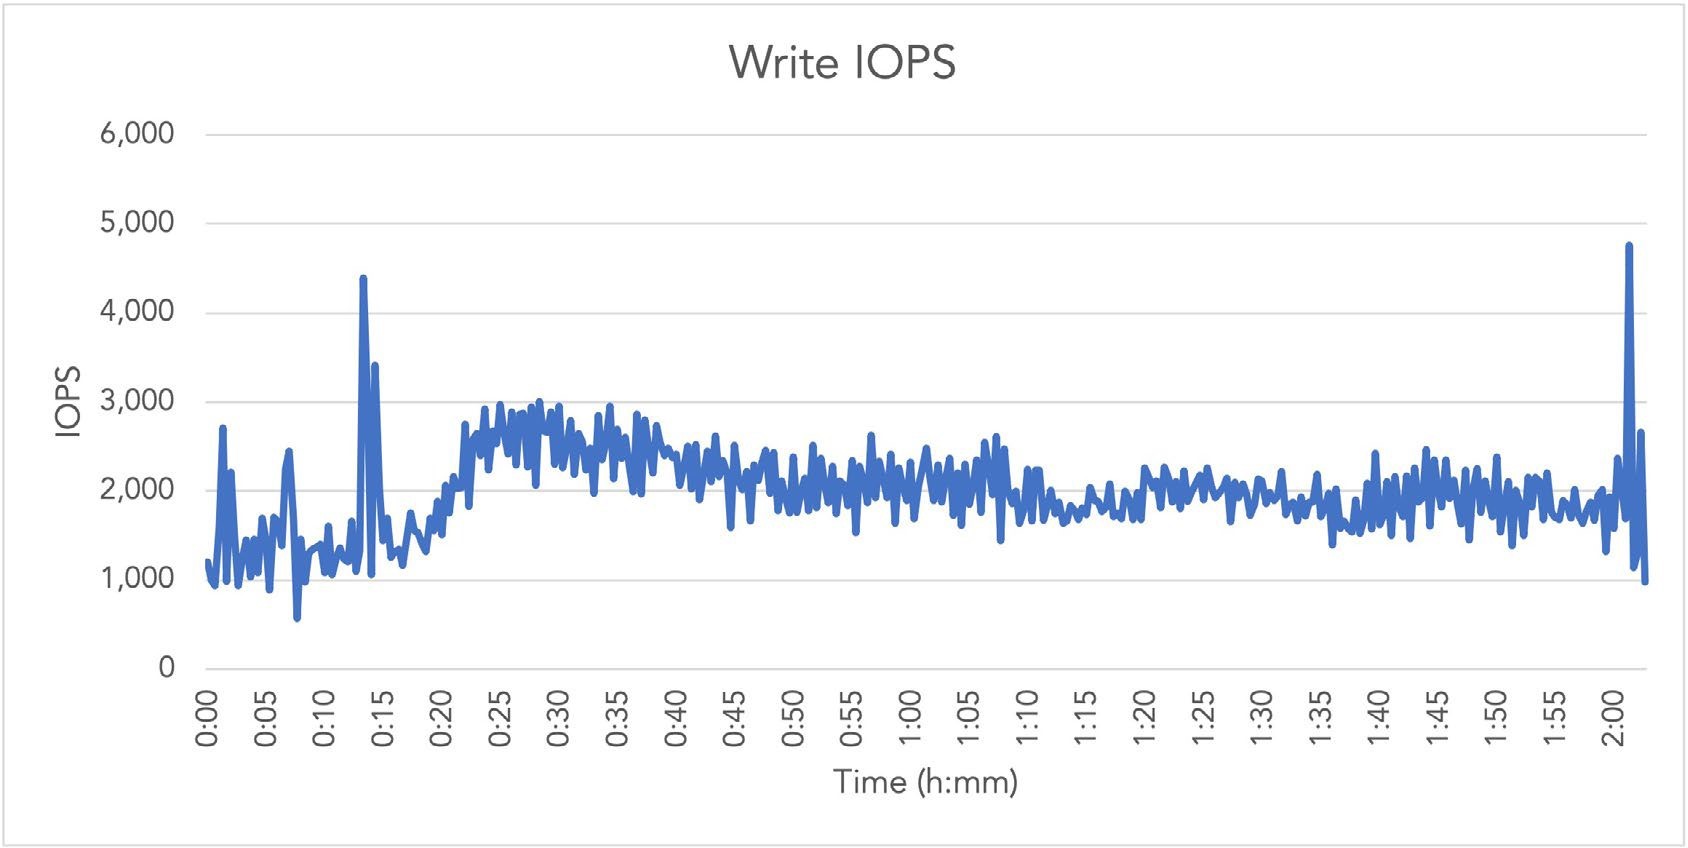
Figure 5: The total write IOPS processed by the Dell EMC PowerEdge R750 server used in our testing. Source: Principled Technologies.