
Comparison results and technical highlights
Comparison results and technical highlights
-
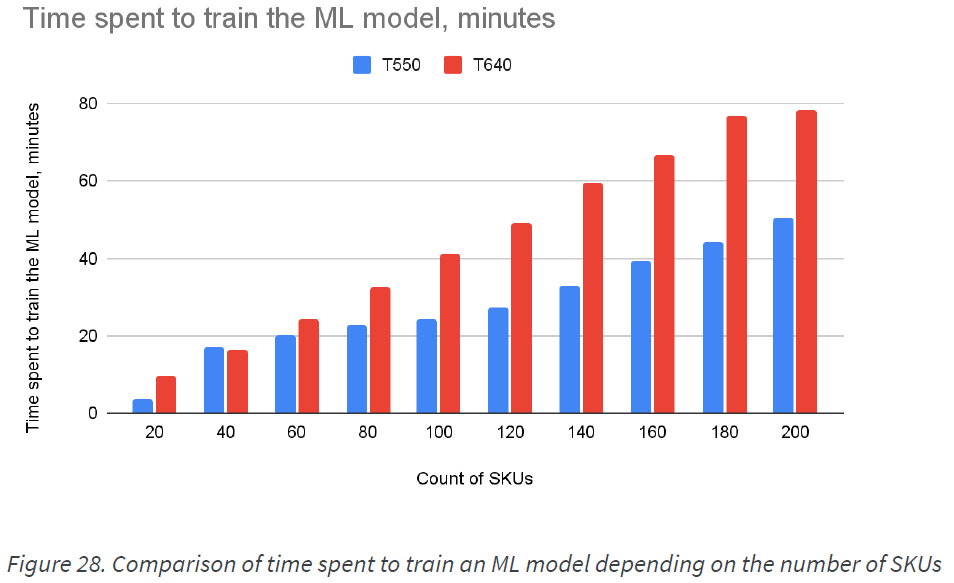
We tested and compared the performance regarding inventory management in handling a different amount of store keeping units (SKUs). The solution allows doing the main calculations using GPU and CPU. See the performance comparison below.
GPU results processing comparison results
We tested and compared the performance regarding inventory management in handling a different amount of store keeping units (SKUs). The solution allows doing the main calculations using GPU and CPU. See the performance comparison below.
GPU results processing comparison results

When the main calculations are done on GPU, on average, Dell EMC PowerEdge T550 uses 41.4% less CPU than T640.

On average, Dell EMC PowerEdge T550 CPU temperature is 7% lower than T640.
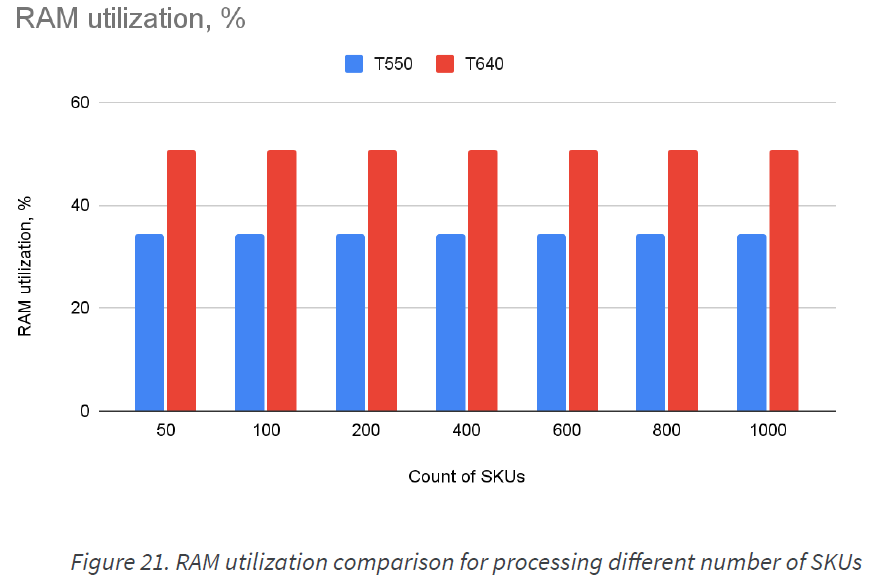
On average, Dell EMC PowerEdge T550 uses 31.9% less RAM than T640.

On average, Dell EMC PowerEdge T550 has 22.2% less GPU utilization than T640.

On average, Dell EMC PowerEdge T550 consumes 35.1% less power than T640.
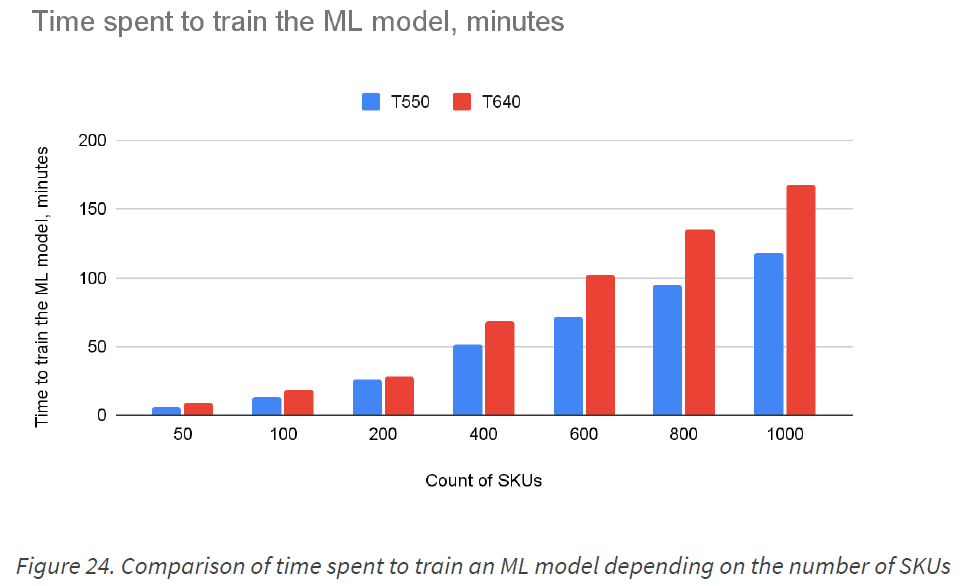
On average, Dell EMC PowerEdge T550 uses 25.8% less time to train the ML model than T640.
CPU workload comparison results
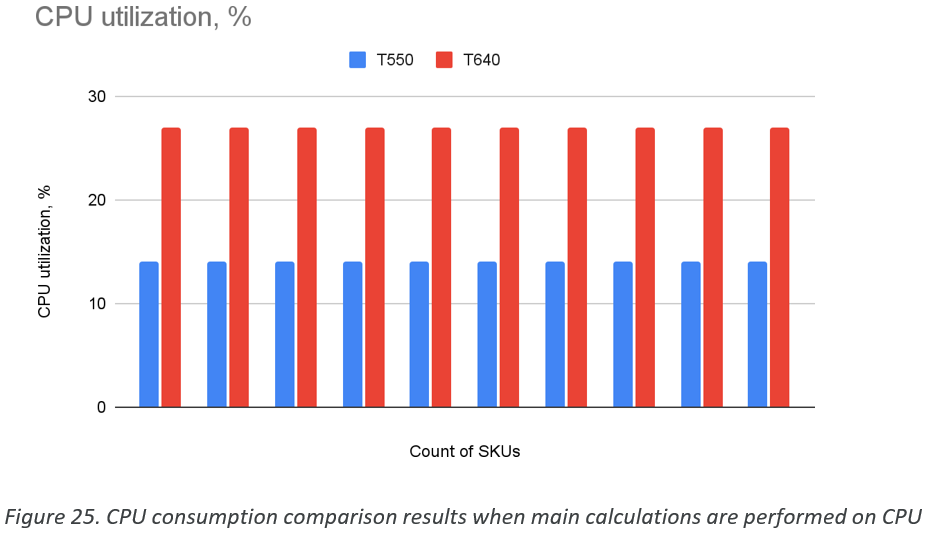
On average, Dell EMC PowerEdge T550 uses 48.2% less CPU than T640.
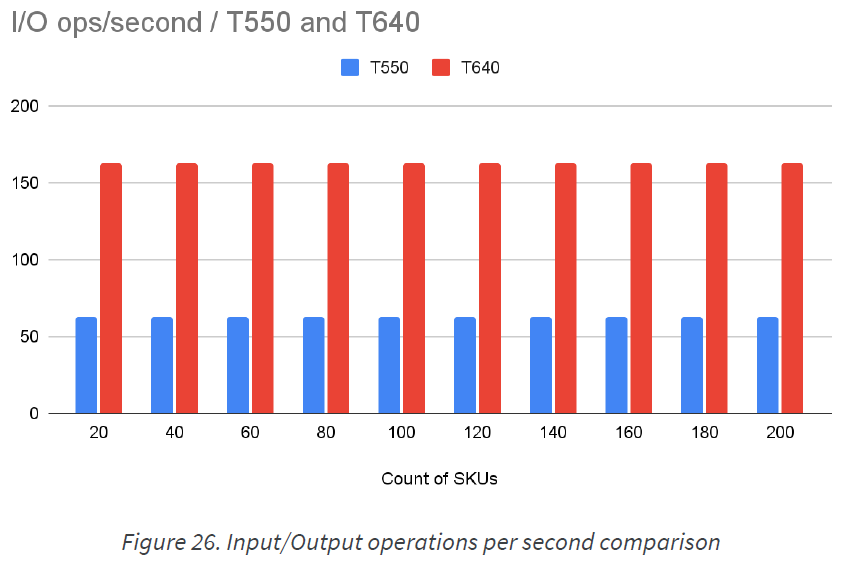
On average, Dell EMC PowerEdge T550 uses 61.3% less time for I/O operations than T640.

On average, Dell EMC PowerEdge T550 uses 41.2% less RAM than T640.
On average, Dell EMC PowerEdge T550 uses 35.3% less time to train the ML model than T640.
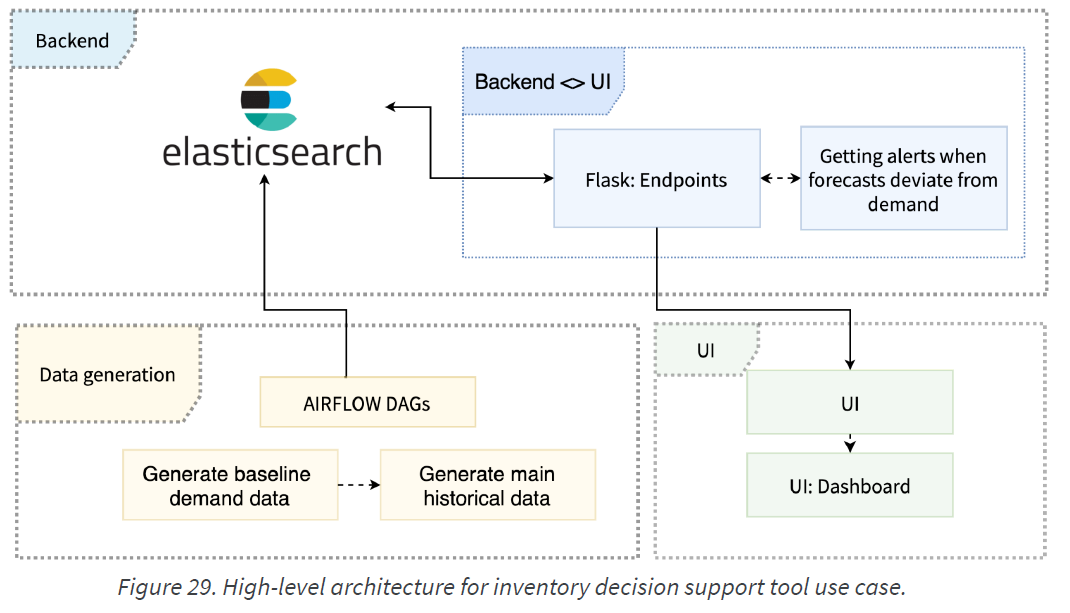
Reference architecture for use case 3
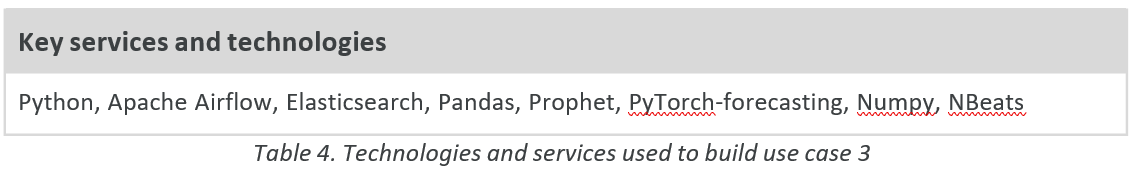
Key services and technologies
Implementation highlights
- Visualizing data: using REST API to fetch data from Elasticsearch (distributed search and analytics engine) and then constructing alerts on the backend.
- Simulating data: using Airflow DAGs (Directed Acyclic Graphs) that collect tasks together, organized with dependencies and relationships to say how they should run:
starter_dag:
- Deletes indices in Elasticsearch;
- Generates baseline data for prediction (see Table 5):

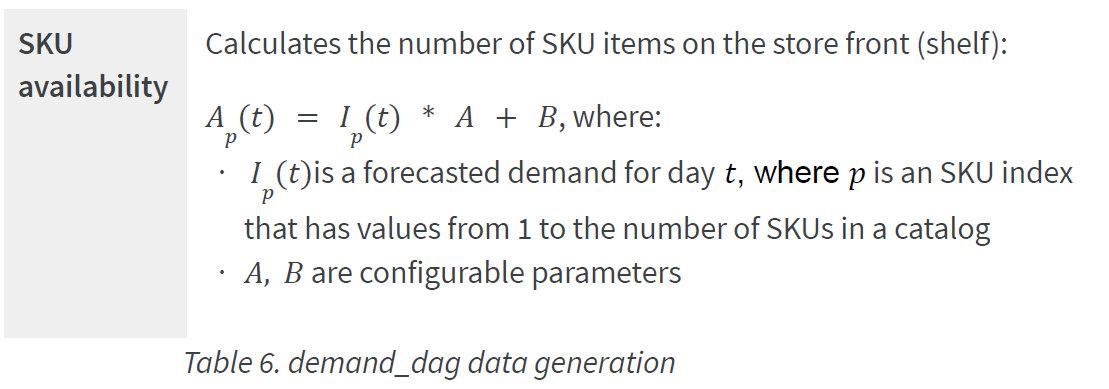
Demand_dag:
- generates price, SKU availability, preferences for the future number of days until the next Saturday (see Table 6):
- model training and forecasting.
Demand forecast models
For the inherent performance testing, we implemented 3 models:
- Facebook Prophet
- NBeats
- TemporalFusionTransformer
During the testing, NBeats model has shown the best results and is used by default.
NBeats is a block-based deep neural architecture for univariate time series point forecasting that is similar in its philosophy to very deep models (for example, ResNet) used in more common deep learning applications such as image recognition.
This model takes into account long-term trends and seasonality. NBeats was applied to M3 and M4 datasets from Kaggle competitions. In each case, it beats the accuracy of existing models that combine ML and statistical approaches on common datasets. For the current generated dataset of 25 SKUs, this algorithm shows SMAPE equals 62.4%.
Learn more about NBeats model at N-BEATS: NEURAL BASIS EXPANSION ANALYSIS FOR INTERPRETABLE TIME SERIES FORECASTING.
Workflow:
- Preparing configuration (coefficients) for the historical dataset.
- Generating historical data and storing it in the Elasticsearch indices.
- Training the demand forecasting models.
- Generating historical forecasts and storing them in the Elasticsearch index.
- Using data collected from the Elasticsearch, calculating difference metric (RMSE), and showing an alert if the threshold is exceeded.