
Dell Enterprise Storage Analytics
Dell Enterprise Storage Analytics
-
While Dell Unisphere provides the system administrator with all the tools necessary to monitor performance of PowerMax arrays, the VMware administrator typically must use other tools to monitor performance. For VMware administrators, VMware vRealize Operations Manager (vROps) is an automated operations management solution that provides integrated performance, capacity, and configuration management for highly virtualized and cloud infrastructure. vROps can help VMware administrators more effectively manage the performance of their VMware environments. VMware vROps provides the ability to create plug-ins, known as adapters, to monitor vendor components within the virtual environment. Dell has created Dell Enterprise Storage Analytics (ESA) to fulfill this need. ESA links vRealize Operations Manager with a Dell Adapter. The adapter is bundled with a connector that enables vRealize Operations Manager to collect performance metrics. ESA leverages the power of existing vCenter features to aggregate data from multiple sources and process the data with proprietary analytic algorithms.
ESA software is delivered in a zip file (.pak extension) and releases multiple times a year to keep current with the latest vROps. It can be downloaded from https://www.dell.com/support/home/en-us. Using ESA, adapter instances are created for each PowerMax array and vSphere vCenter. Using the adapter, the VMware administrator is provided access to the performance metrics of the storage components underlying the VMware infrastructure, all within the context of vROps.
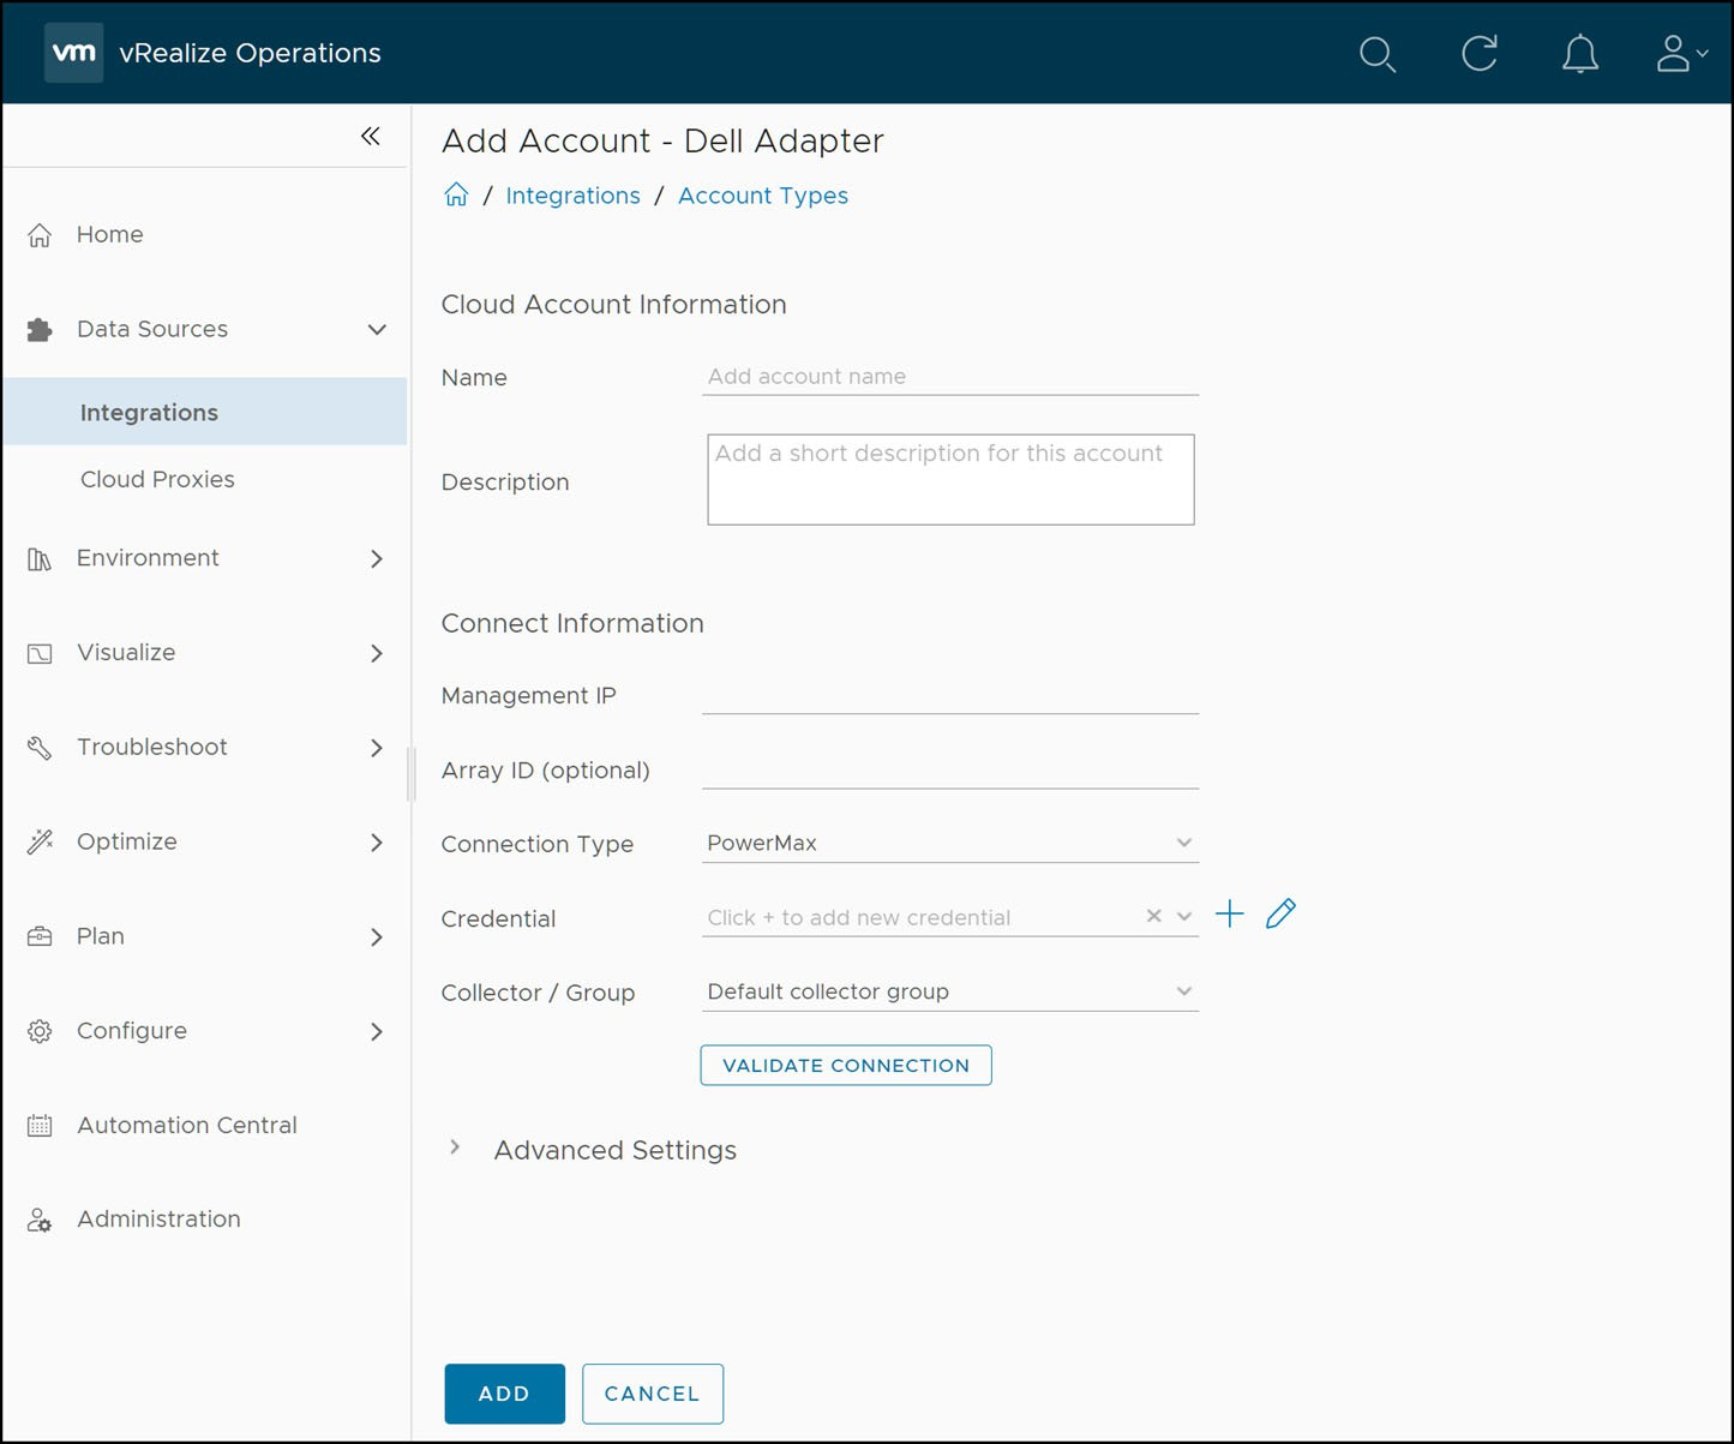
Once installed, the administrator can configure the adapter instances. The adapter for PowerMax requires a connection to the Unisphere REST API which is part of Unisphere for PowerMax. Figure 84 shows the configuration screen.
Figure 84. Configuring a Dell adapter instance in vROps
Once adapter instances are configured, statistics will be gathered for the corresponding array(s). Within the vROps custom page there are various screens available for viewing the metrics. Dell provides two universal dashboards and also specific dashboards for each platform.
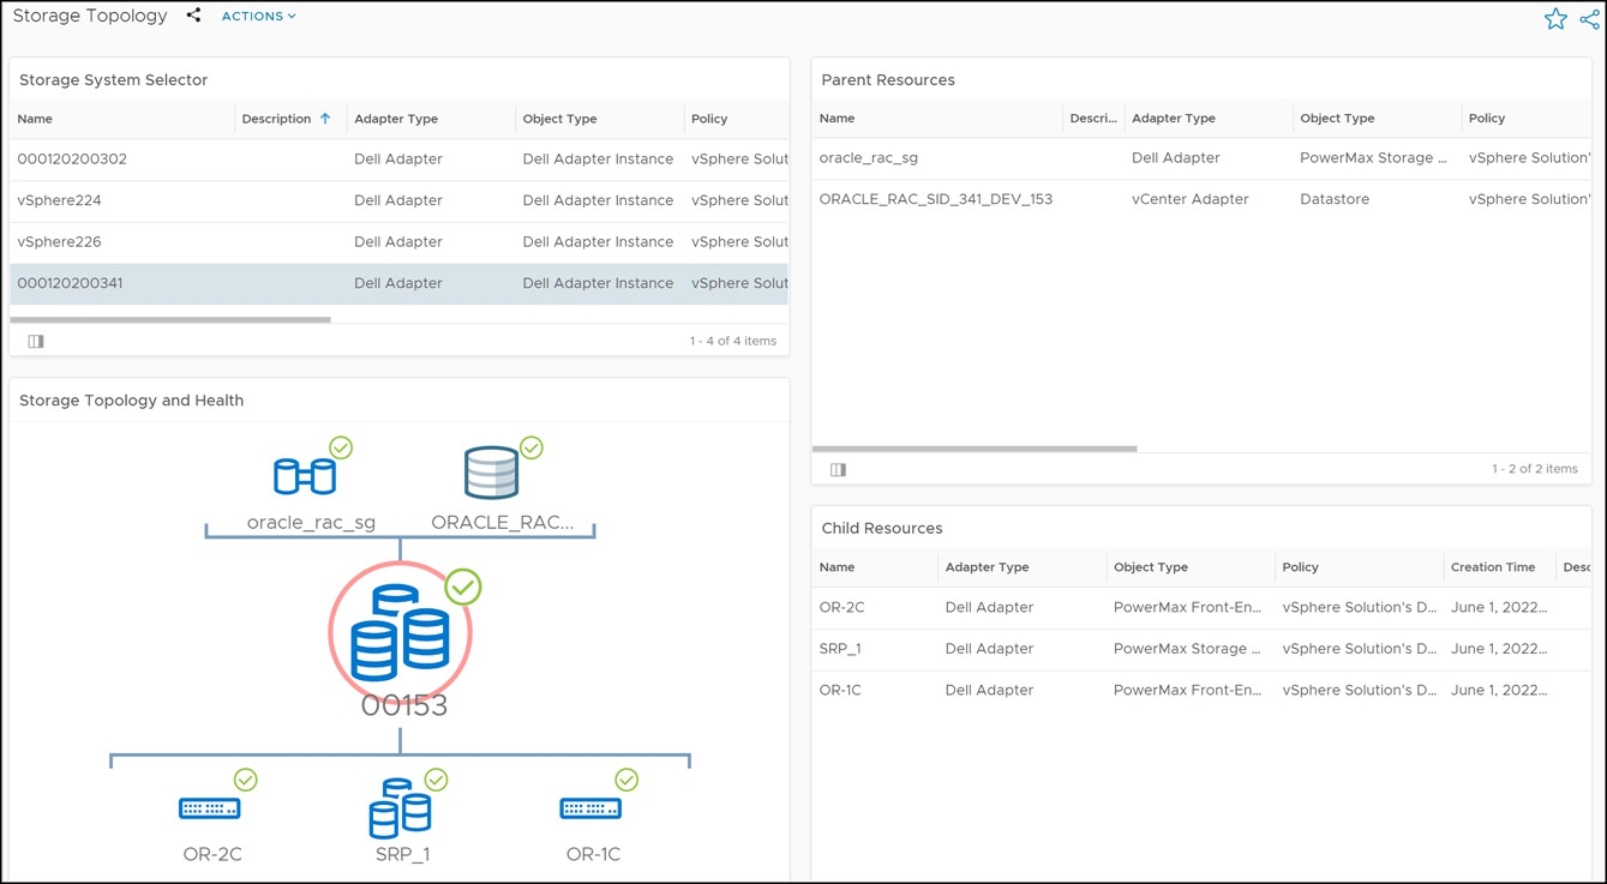
The first universal dashboard is Storage Topology. All configured PowerMax arrays (and other arrays) will be displayed here. The user can navigate from the array level down to the front-end port. ESA is also going to show any VMware relationships - for instance if the device has a datastore built upon it as in Figure 85.
Figure 85. Storage Topology dashboard
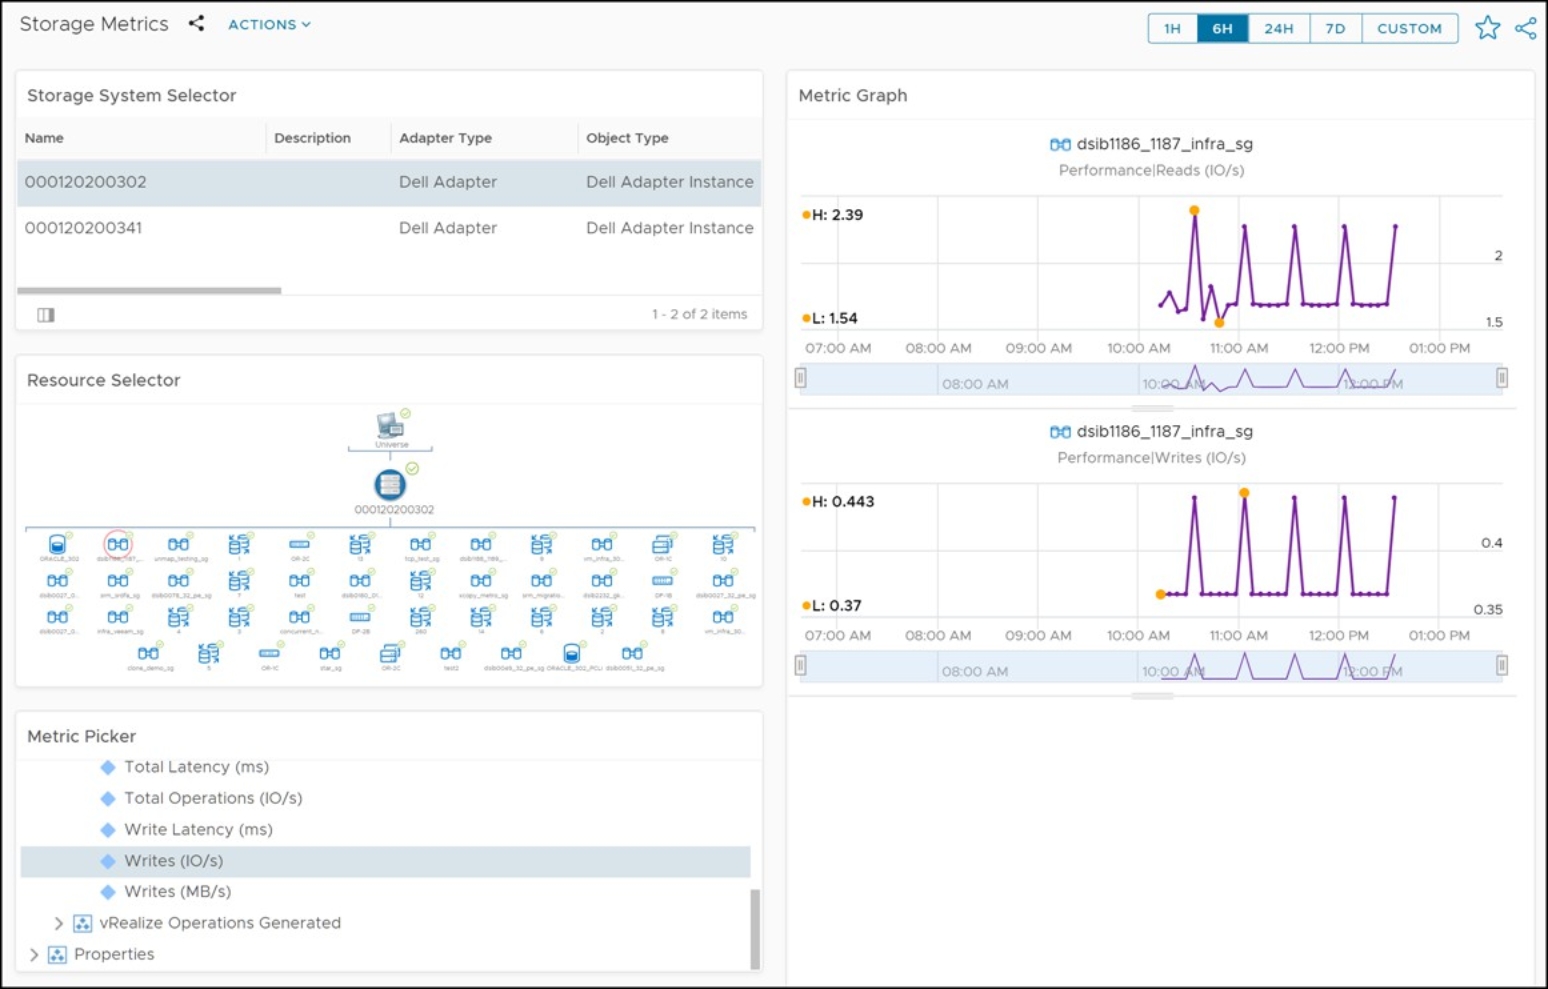
The second universal dashboard is Storage Metrics. Each Dell resource selected in the Resource Selector will have a set of metrics associated with it. Figure 86 demonstrates the metrics for a device. Each metric can be displayed in a graph with many different options available - from combining graphs to doing historical reporting.
Figure 86. Storage Metrics dashboard
The custom PowerMax dashboards are consolidated under the PowerMax name:
- PowerMax Overview
- PowerMax Topology
- PowerMax Metrics
Samples of these dashboards are shown in Figure 87, Figure 88, and Figure 89.
Figure 87. PowerMax Overview dashboard
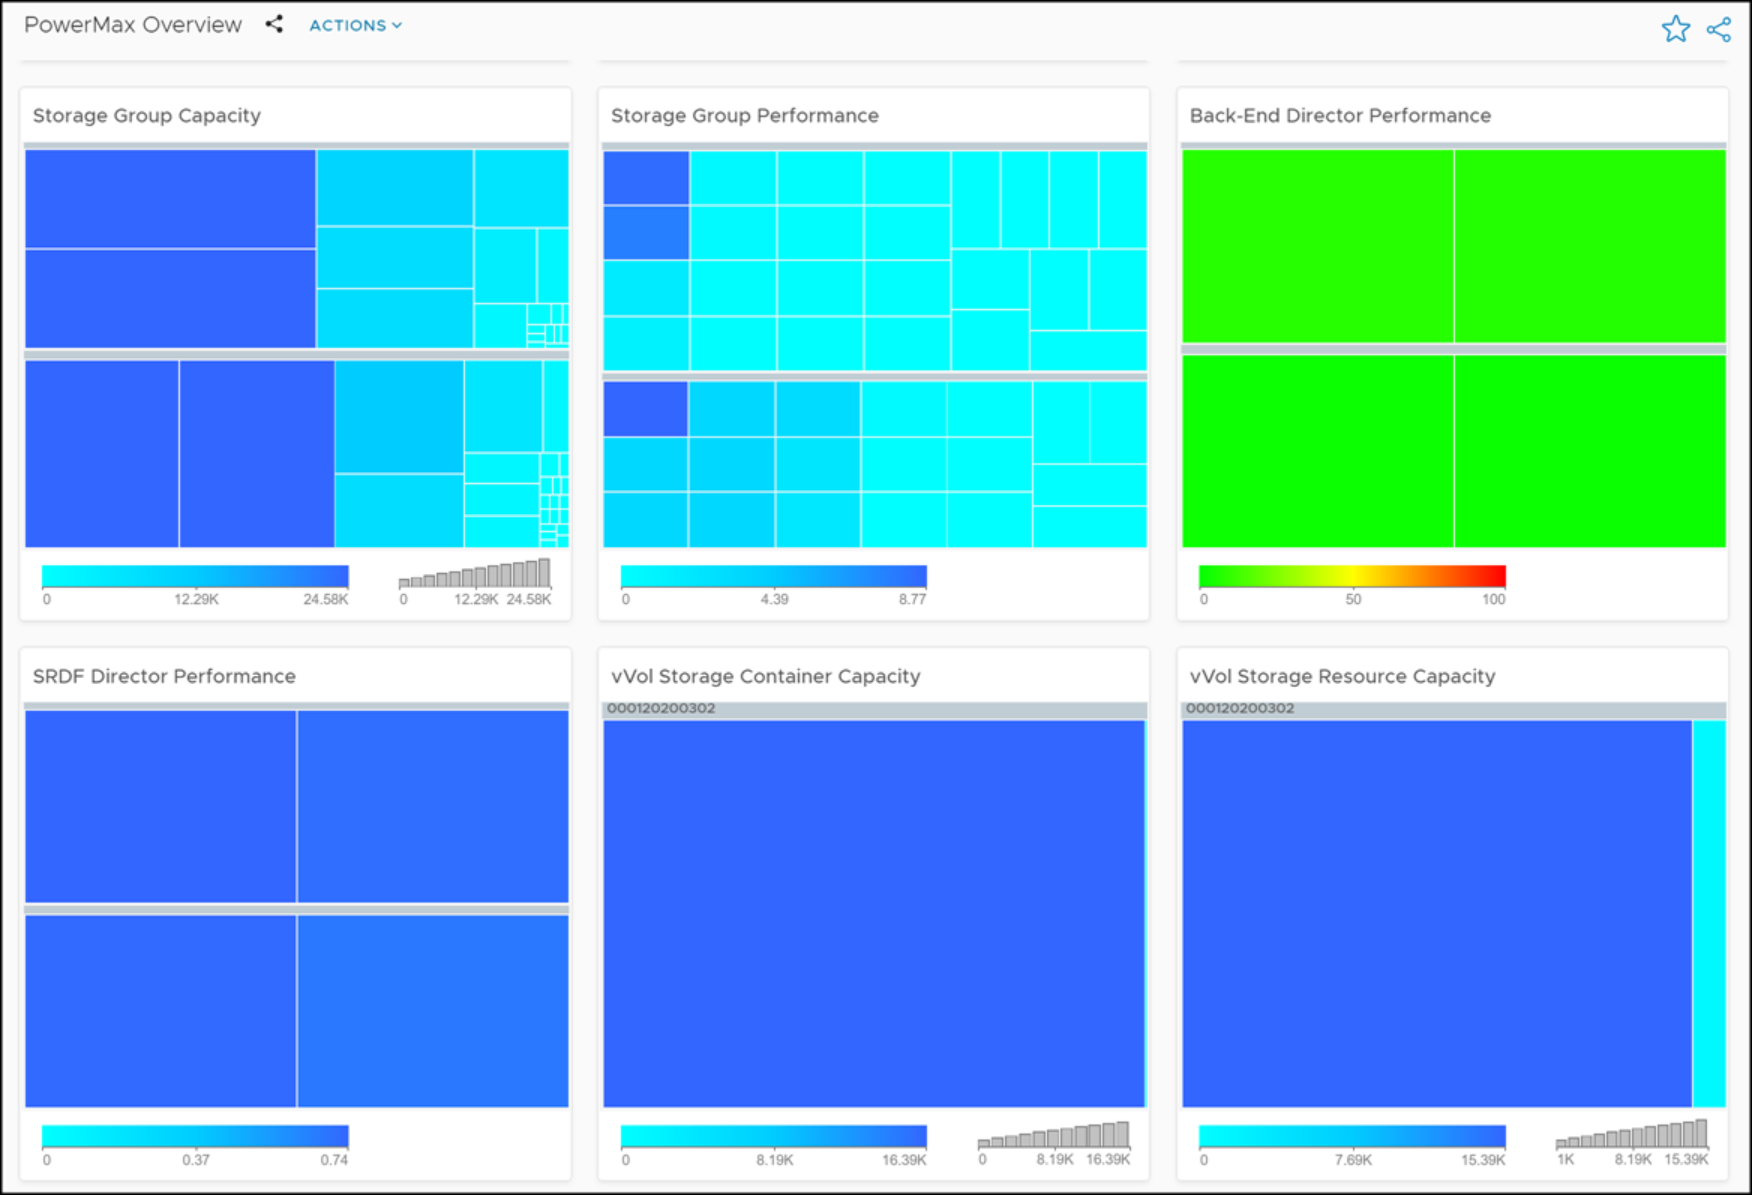
Figure 88. PowerMax Topology dashboard
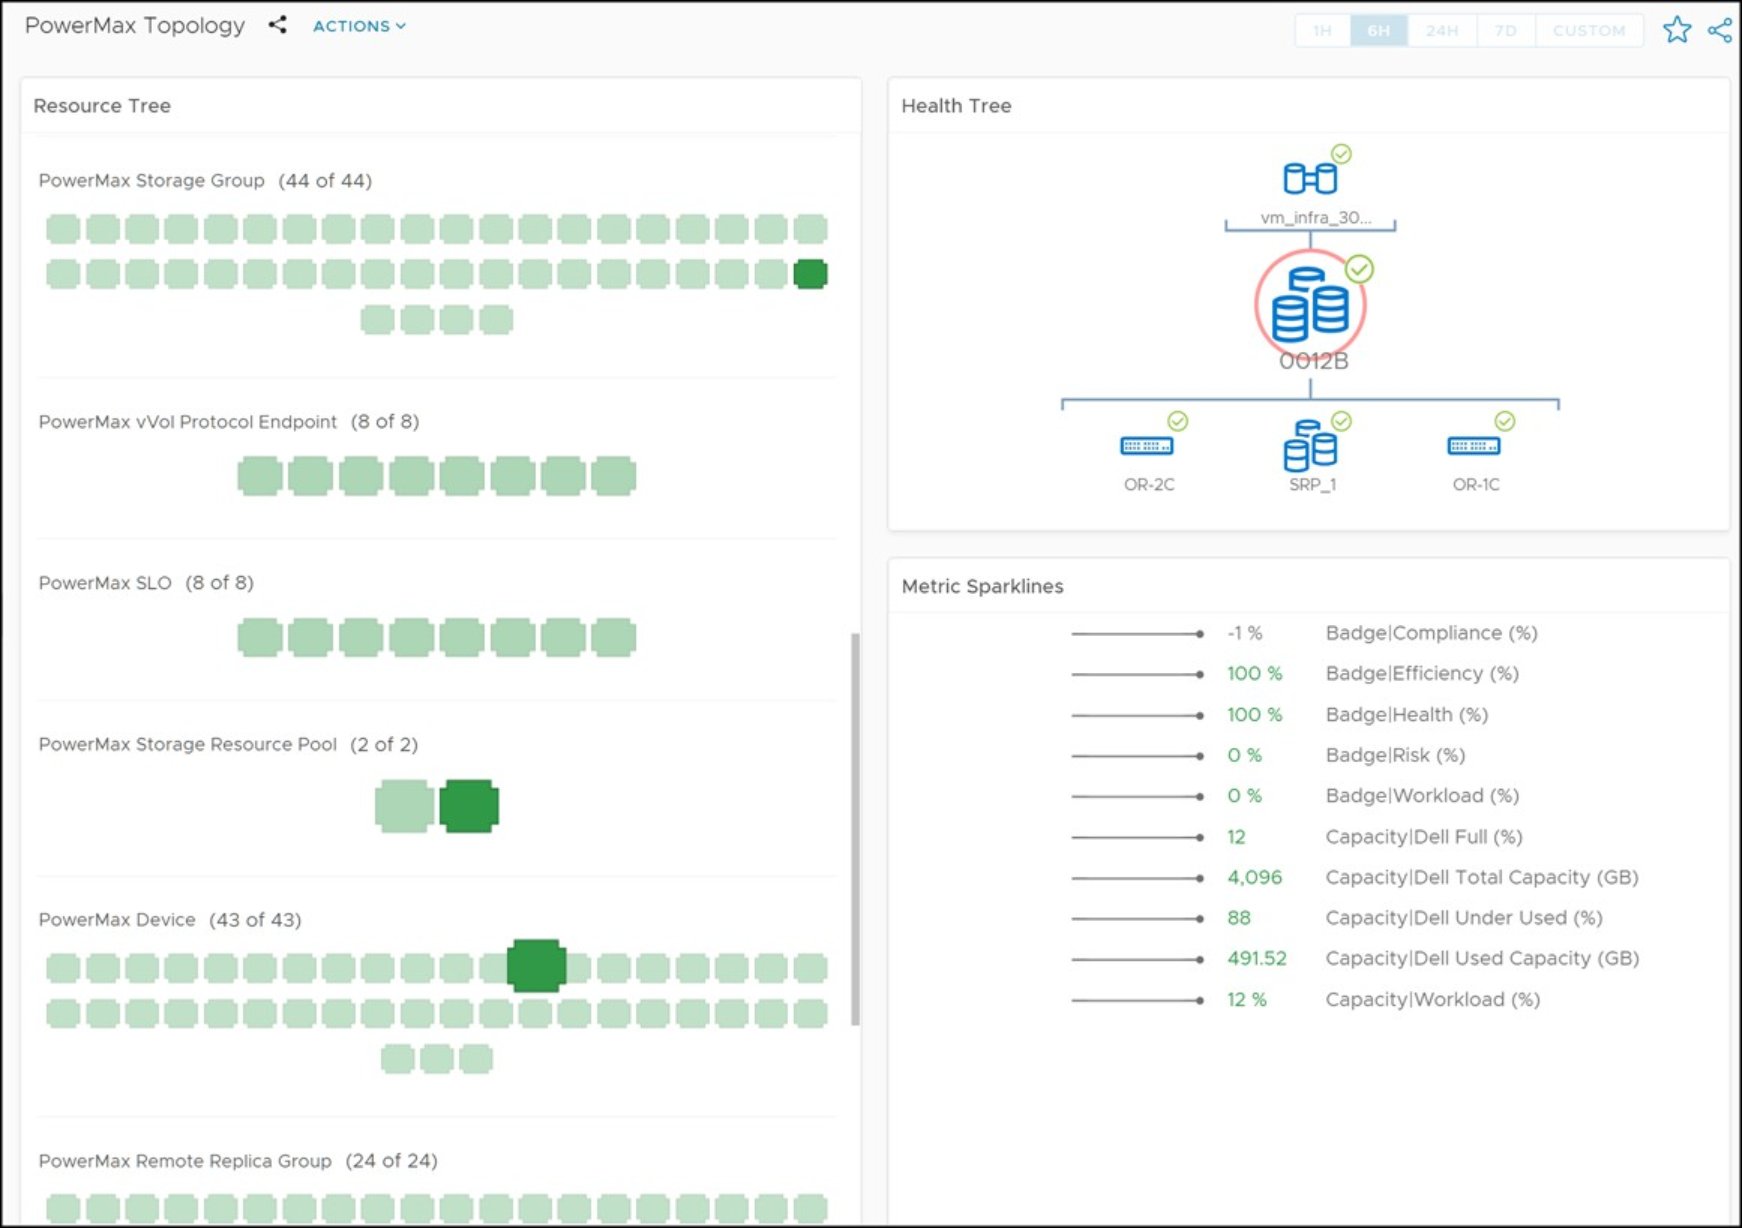
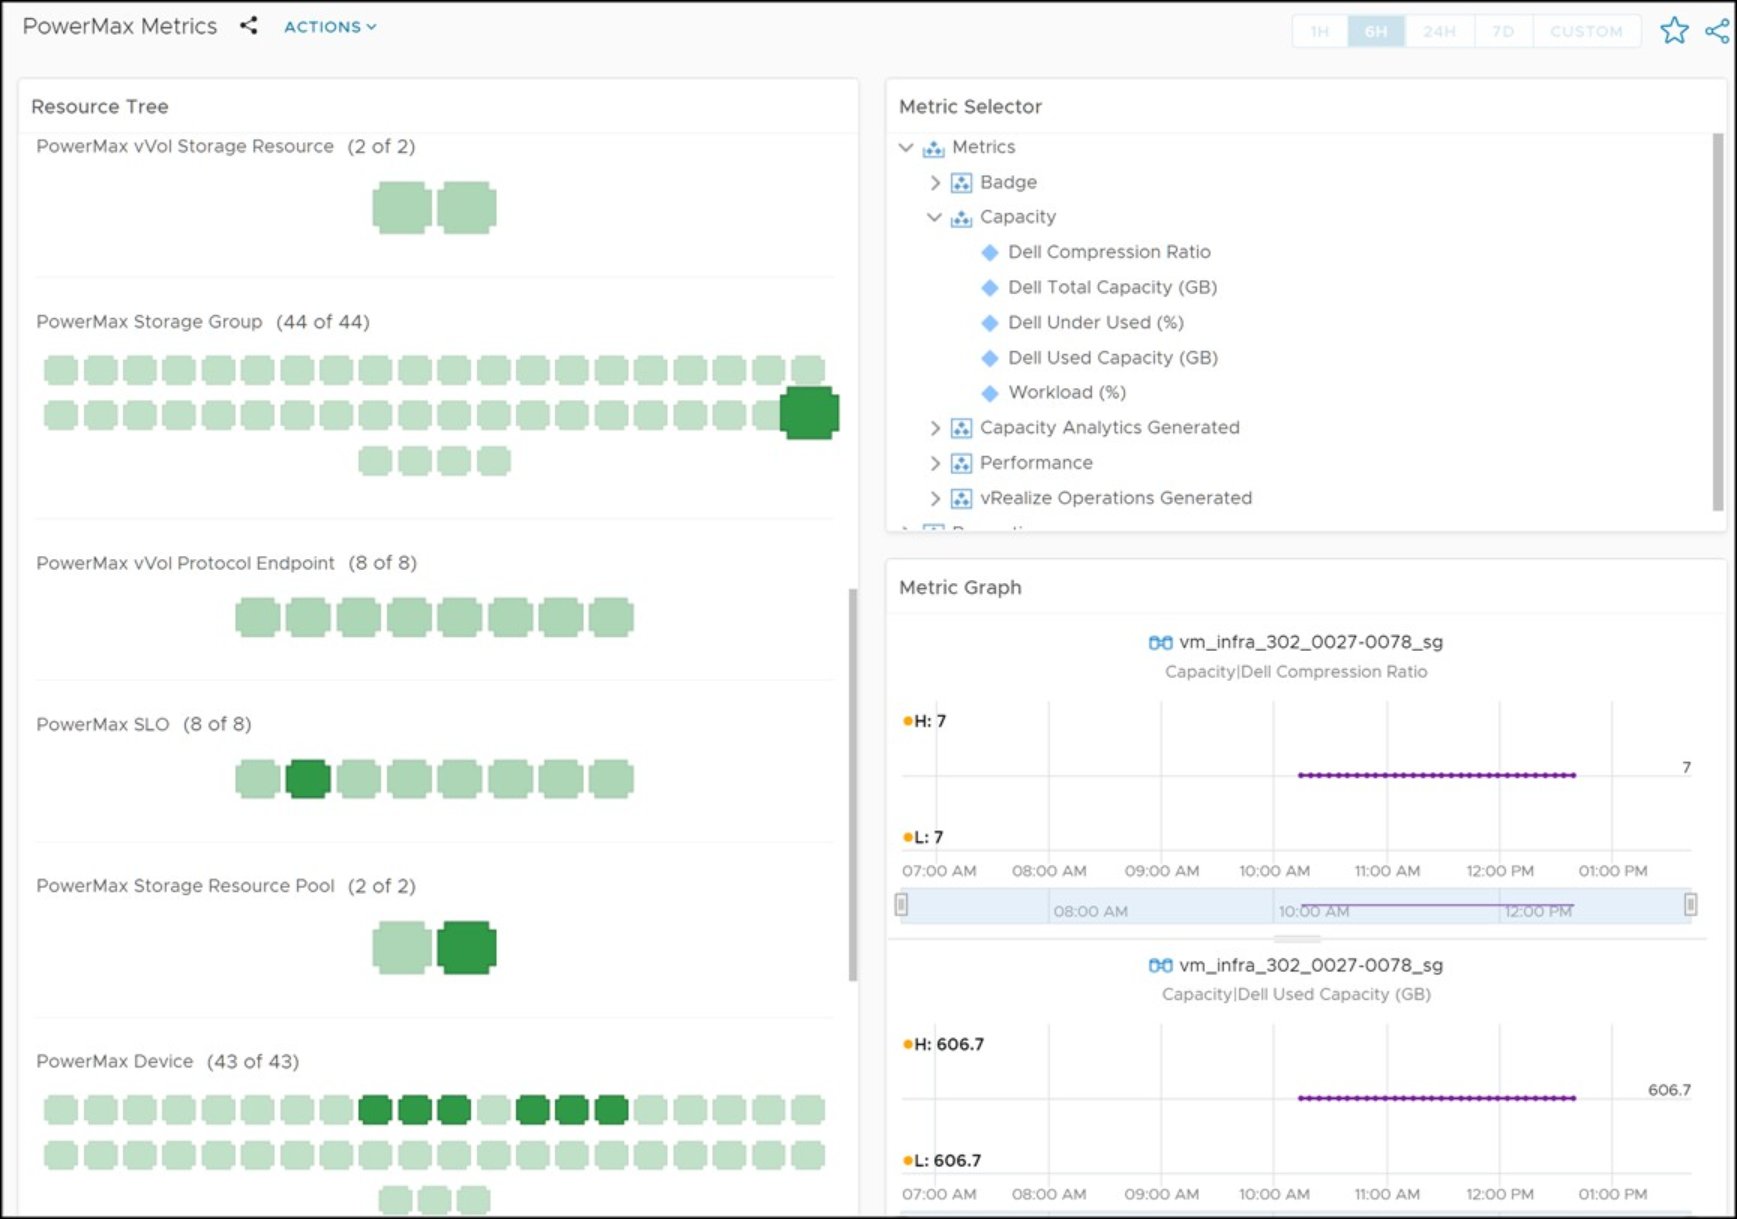
Figure 89. PowerMax Metrics dashboard
In addition to the dashboards, ESA offers preconfigured alerts for objects such as SRPs and includes root cause analysis capability and capacity planning. See the Dell Enterprise Storage Analytics Installation and User Guide for more details about ESA.