
Dashboards
Dashboards
-
Dashboards
Included below are the seven dashboards that comprise the current content pack. They are seen in Figure 95, Figure 96, Figure 97, Figure 98, Figure 99, Figure 100 and Figure 101 are defined as follows:
- Overview - Contains widgets with information about all PowerMax data in your Log Insight instance.
- Problems - Contains widgets with information about potential problems that are recorded in the log files.
- Service levels - Contains widgets about Service Level alerts on the PowerMax.
- Director events - Contains widgets with information about any front-end or back-end director events on the PowerMax.
- Local & remote replication - Contains widgets specific to log messages generated by SRDF or TimeFinder software.
- Virtual volumes (vVols) - Contains widgets with information related to vVol activity on the array.
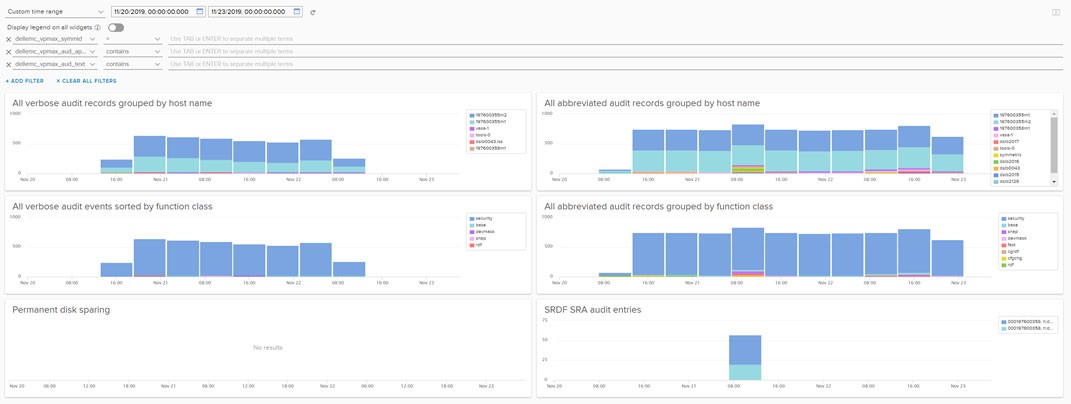
- Auditing - Contains widgets that display all audit log information.
- PowerMax Content Pack - Overview dashboard
Figure 95 PowerMax Content Pack - Overview dashboard
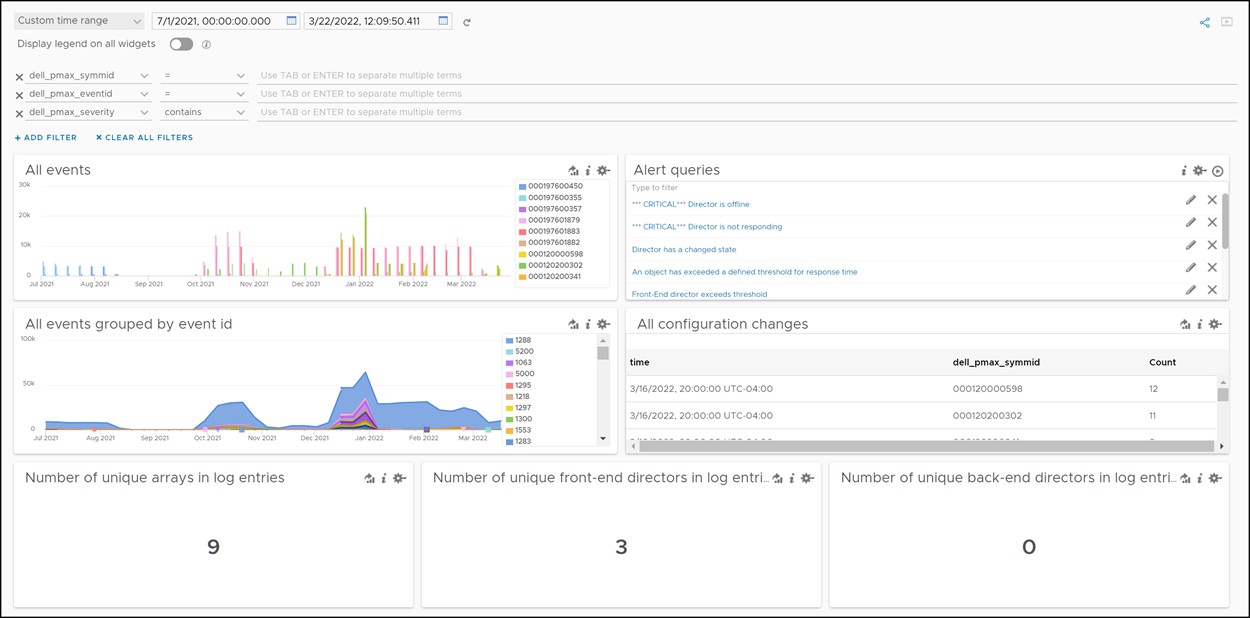
Figure 96 PowerMax Content Pack - Problems dashboard
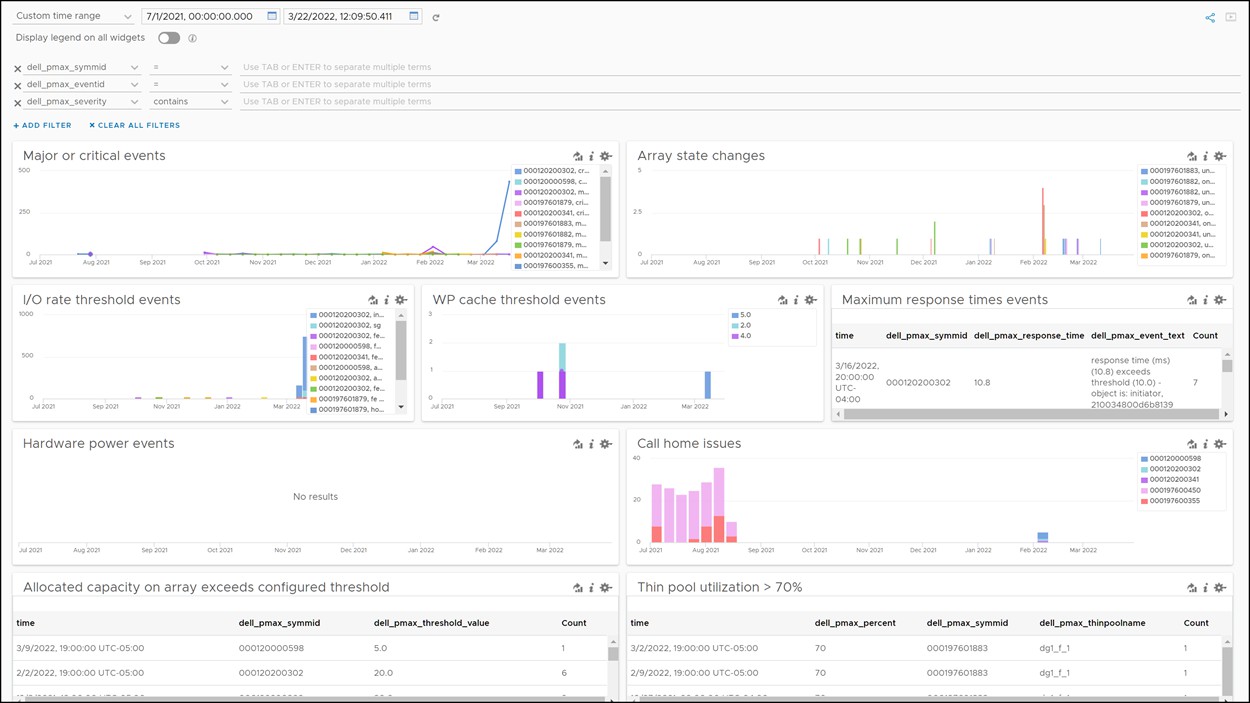
Figure 97 PowerMax Content Pack - Service levels dashboard
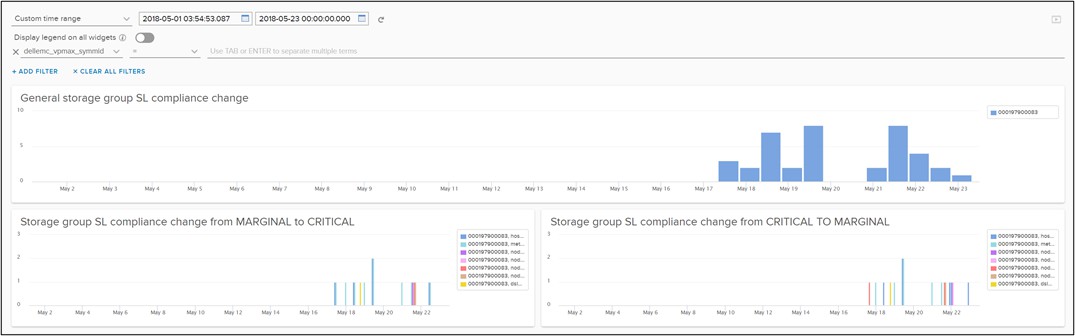
Figure 98 PowerMax Content Pack - Director events dashboard
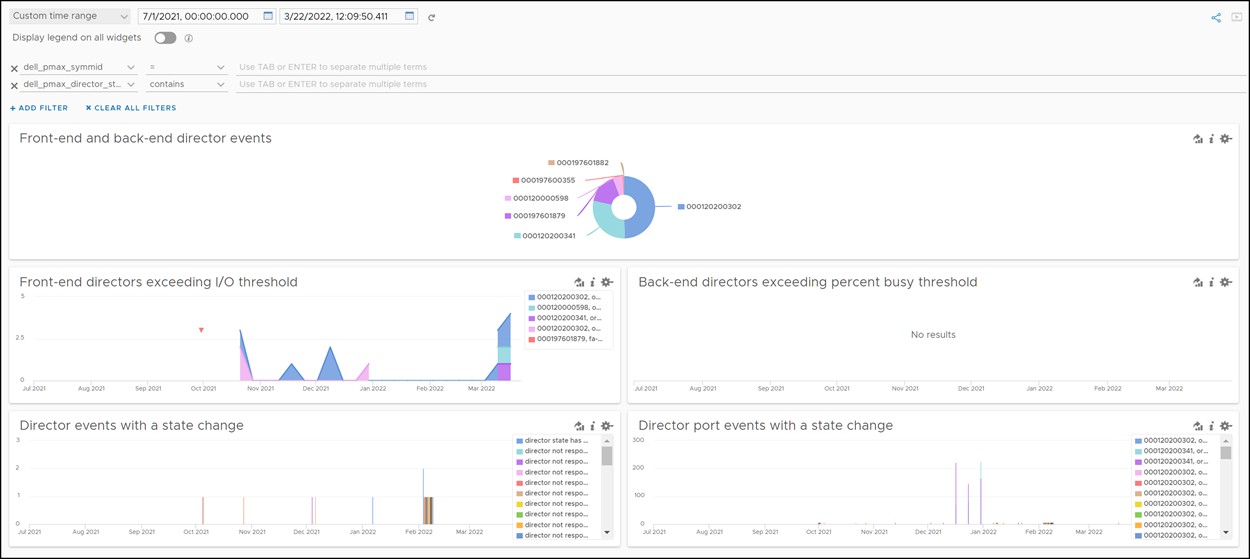
Figure 99 PowerMax Content Pack - Local and remote replication dashboard
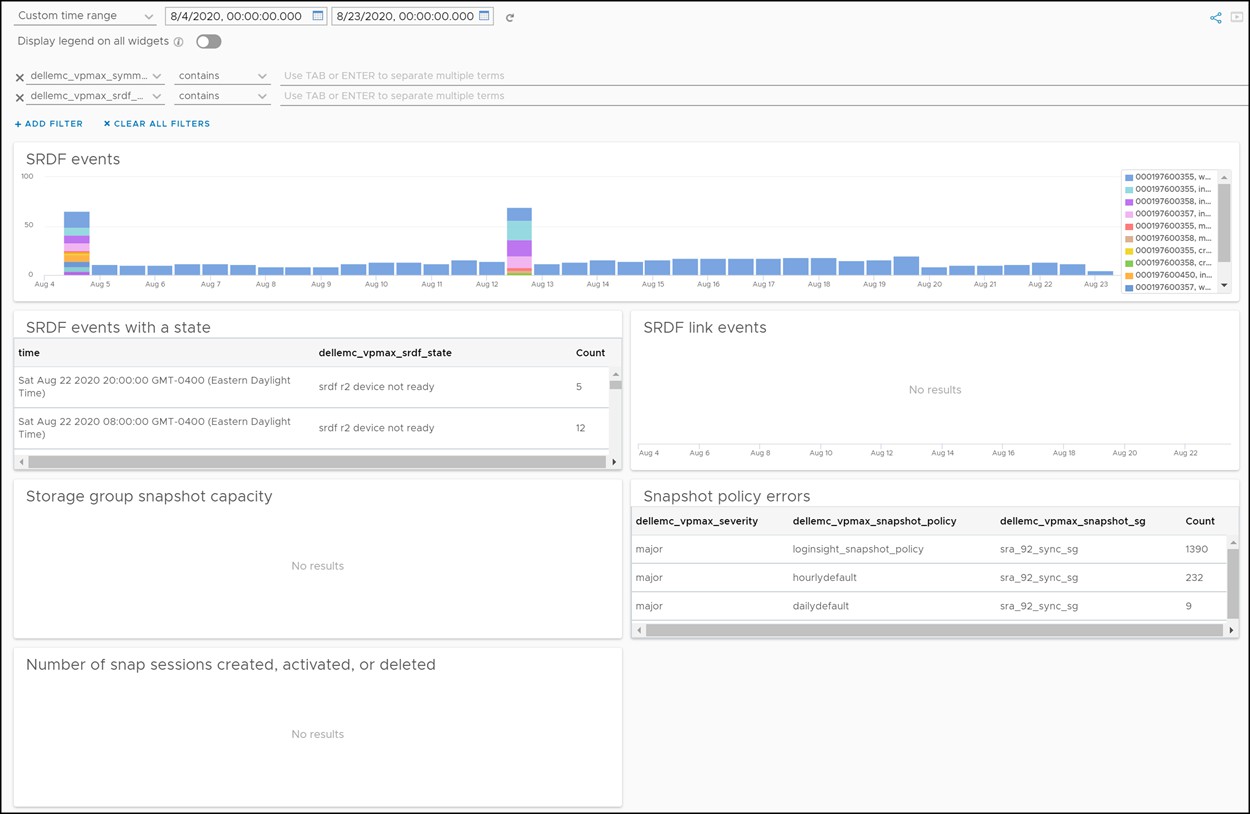
Figure 100 PowerMax Content Pack - Virtual Volumes (vVols) dashboard
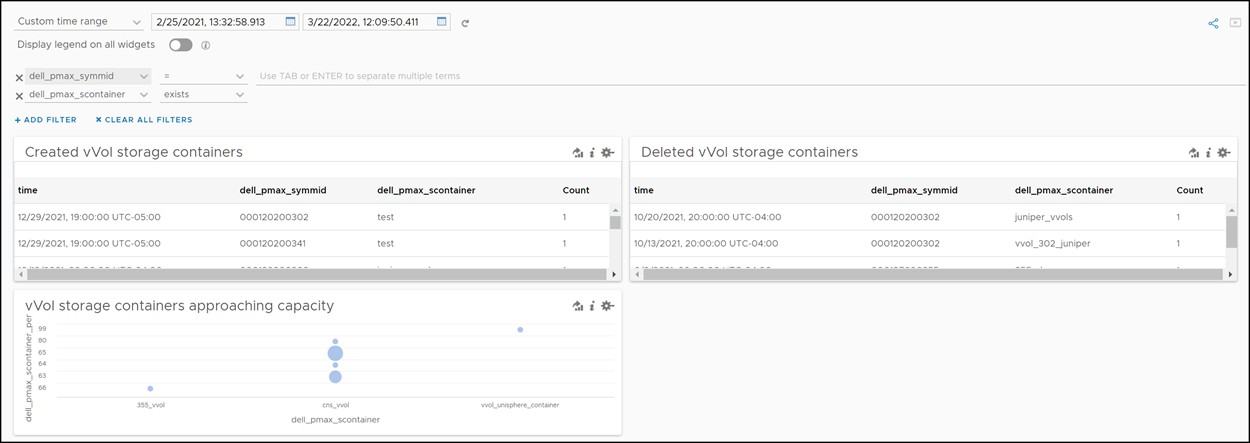
Figure 101 PowerMax Content Pack - Auditing dashboard
User-defined fields
In large environment with numerous log messages, it is difficult to locate instantly the data fields that are important to you. Log Insight provides runtime field extraction to address this problem. You can dynamically extract any field from the data by providing a regular expression.
Within the PowerMax Content Pack, Dell has preconfigured user-defined fields for the most commonly appearing objects in the log files. All of the fields have the prefix "dell_pmax_" so they can be easily identified. Note that as some PowerMax logs present data differently, more than one user-defined field is required to represent an object, e.g., thin pool. The fields are generally self-explanatory.
- dell_pmax_array_srdf_gp
- dell_pmax_array_state
- dell_pmax_be_director
- dell_pmax_devices
- dell_pmax_director_name
- dell_pmax_director_state
- dell_pmax_egress_tracks
- dell_pmax_event_date
- dell_pmax_event_fmt_type
- dell_pmax_eventid
- dell_pmax_fe_director
- dell_pmax_fe_portname
- dell_pmax_ingress_tracks
- dell_pmax_iorate
- dell_pmax_iscsi_dir_ip
- dell_pmax_objecttype
- dell_pmax_pctbusy
- dell_pmax_pcthit
- dell_pmax_percent
- dell_pmax_port_name
- dell_pmax_port_status
- dell_pmax_portgroup
- dell_pmax_power
- dell_pmax_response_time
- dell_pmax_scontainer
- dell_pmax_scontainer_percent
- dell_pmax_severity
- dell_pmax_sg
- dell_pmax_sg_state
- dell_pmax_sg_state_name
- dell_pmax_sl_sg
- dell_pmax_snapshot_percent
- dell_pmax_snapshot_policy
- dell_pmax_snapshot_sg
- dell_pmax_srdf_group
- dell_pmax_srdf_state
- dell_pmax_srp_name
- dell_pmax_storagegrp
- dell_pmax_storagetier
- dell_pmax_symmid
- dell_pmax_system
- dell_pmax_thinpool_name
- dell_pmax_thinpoolname
- dell_pmax_threshold_value
- dell_pmax_used_capacity
- dell_pmax_volume
- dell_pmax_wp_cache_threshold
- dell_pmax_wp_cache_value
In addition to the dashboards, the PowerMax Content Pack also contains pre-configured Alerts and Queries.
The PowerMax Content Pack displays existing log information in the database. For the PowerMax, Solutions Enabler, Unisphere for PowerMax, and eNAS/SDNAS can be configured to send logs via syslog to Log Insight. For more about how this configuration is done along with more detail about the PowerMax content pack, please reference the Using the Dell PowerMax Content Pack for VMware vRealize Log Insight white paper.