
nVector performance test results and analysis
nVector performance test results and analysis
-
Summary of test results
For the GPU testing, we used a single compute host with six NVIDIA T4 GPUs. We enabled 48 VMs with an NVIDIA T4-2B, vGPU profile. The vGPU scheduling policy was set to "Fixed Share Scheduler." For the non-GPU test, we performed testing on a compute host running 48 VMs without enabling vGPU profiles.
The compute host was part of a 4-node VMware vSAN software-defined storage cluster. We used VMware linked clones to create VMs in both tests. We used the Horizon Blast Extreme protocol as the remote display protocol with H.264 hardware encoding.
We performed both tests with the NVIDIA nVector Knowledge Worker workload. The following table compares the utilization metrics gathered from vCenter for both tests, while the second table compares the EUE metrics generated by the nVector tool. Both tests produced almost the same image quality (SSIM value, above 0.9). However, with GPUs enabled, the FPS increased by 14 percent, and the end-user latency decreased by 18 percent.
Table 14. Host utilization metrics Test case Server configuration nVector workload Density per host Average CPU usage Average GPU usage Average active memory Average IOPS per user Average net Mbps per user GPU Density Optimized + 6 x NVIDIA T4 Knowledge Worker (NVIDIA T4-2B) 48 68% 19% 193 GB 84 8.7 Non-GPU Density Optimized Knowledge Worker 48 69% N/A 67 GB 65 8.9 Table 15. NVIDIA nVector EUE metrics Test configuration nVector workload GPU profile Density per host End-user latency Frame rate Image quality GPU Knowledge Worker NVIDIA T4-2B 48 100 milliseconds 16 0.94 Non-GPU Knowledge Worker N/A 48 122 milliseconds 14 0.99 nVector Knowledge Worker, 48 vGPU users, ESXi 6.7u3, Horizon 7.10
For this test, we configured compute host 1 with six NVIDIA T4 GPUs. Host 1 was running 48 vGPU-enabled desktop VMs with the NVIDIA T4-2B profile. Host 2 was used to run nVector launcher VMs. A launcher is an endpoint VM from which the desktop VM launch is initiated. Host 2 was configured with three P40 GPUs, and the launcher VMs in host 2 were GPU-enabled through an NVIDIA P40-1B profile. It is a requirement for the nVector tool to enable launcher VMs with GPUs. Host 3 was used to host management VMs only, and host 4 did not have any load.
We used linked clone provisioning for this testing. Linked clones, as opposed to instant clones, are not re-created automatically after logout. We used the VMware Horizon Blast Extreme protocol as the remote display protocol.
The total GPU frame-buffer available on compute host 1 was 96 GB. With vGPU VMs enabled with the NVIDIA T4-2B profile, the maximum number of GPU-enabled users that can be hosted on compute host 1 is 48 users.
CPU
The following figure shows the CPU utilization of the four hosts during the testing. We can see a spike in CPU usage for compute host 1 and launcher host 2 during linked-clone creation and the login phase. During the steady state phase, an average CPU utilization of 68 percent was recorded on the GPU-enabled compute host 1. This value was lower than the pass/fail threshold that we set for average CPU utilization (see Table 12). The launcher host 2 and management host 3 had very low CPU usage during steady state.
Figure 41. CPU usage 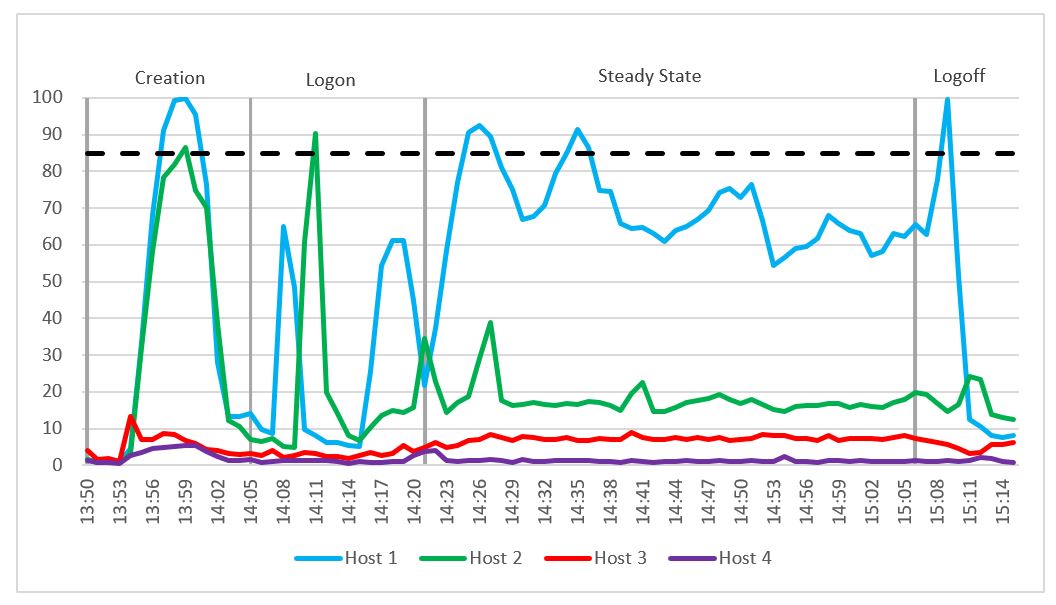
As shown in the following figure, the CPU readiness percentage was well below the 5 percent threshold that we set. The average steady state CPU core utilization was 56 percent on the GPU-enabled compute host 1, as shown in Figure 43.
Figure 42. CPU readiness 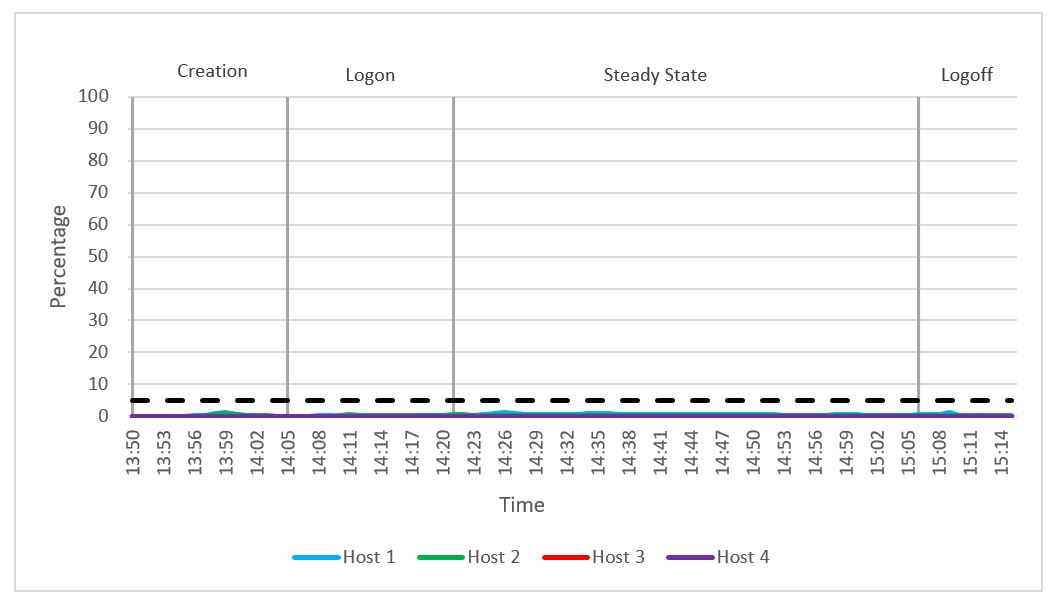
Figure 43. CPU core utilization 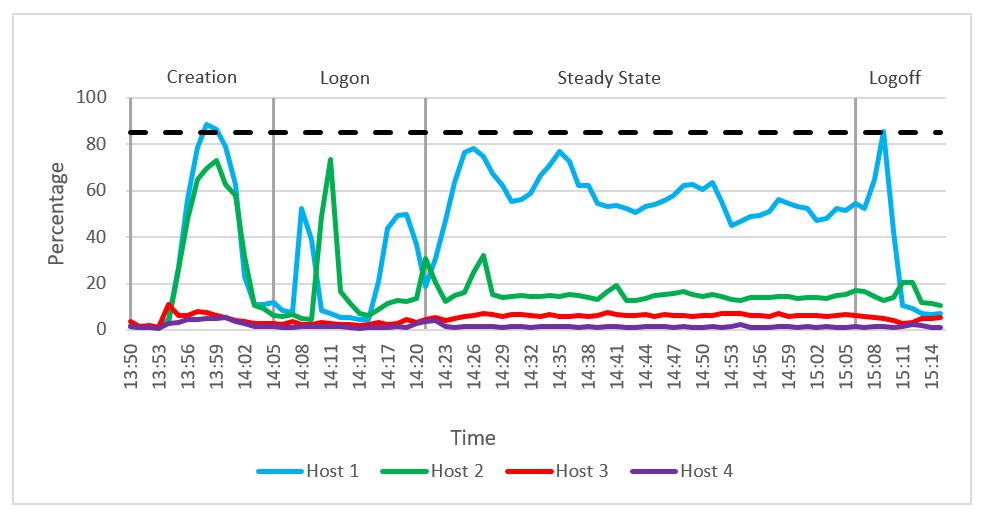
GPU usage
The following graph shows the GPU usage across the six NVIDIA T4 GPUs configured on the GPU-enabled compute host 1. The GPU usage during the steady state period across the six GPUs averaged approximately 19 percent. During the steady state phase, peak usage of 39 percent was recorded on GPU 3.
Figure 44. GPU usage 
Memory
We observed no memory constraints during the testing on the compute or management host. Out of 768 GB of available memory per node, compute host 1 reached a maximum consumed memory of 244 GB. Active memory usage reached a maximum of 193 GB. There were no variations in memory usage throughout the test because all vGPU-enabled VM memory was reserved. There was no memory ballooning or swapping on hosts.
Figure 45. Consumed memory usage 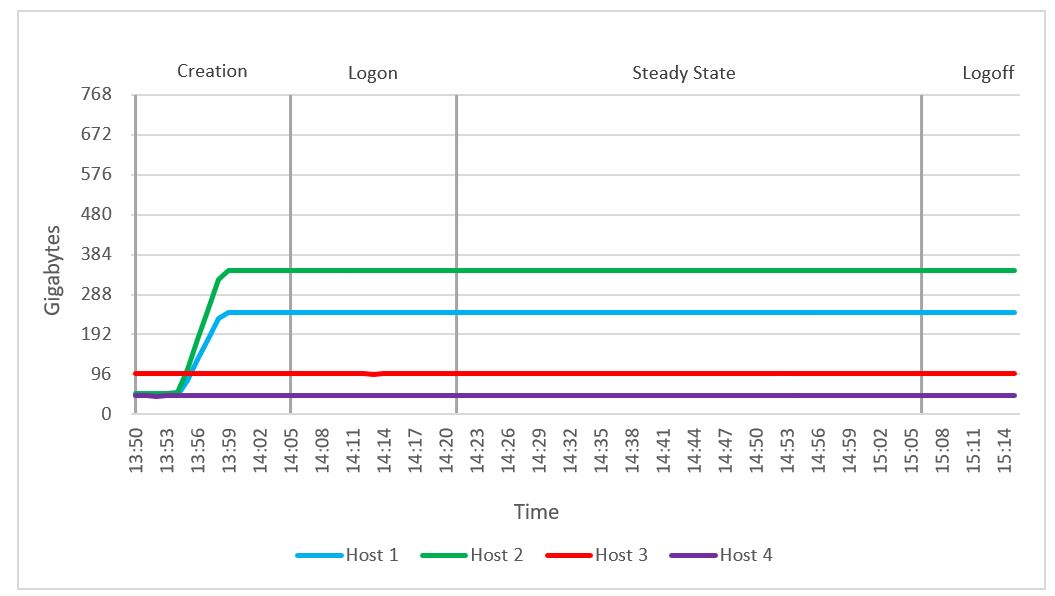
Figure 46. Active memory usage 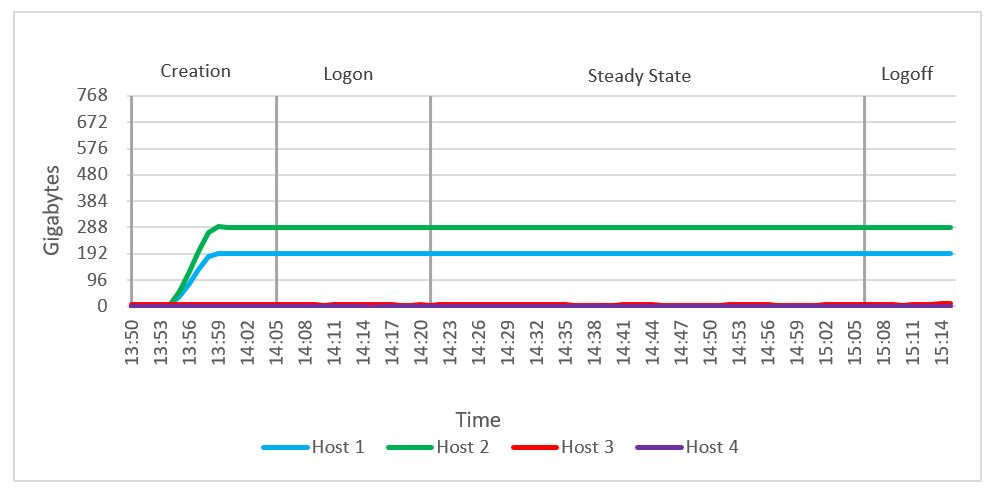
Network usage
Network bandwidth was not an issue in this test. A steady state average network usage of 422 Mbps was recorded during the steady state phase. The busiest period for network traffic was during the start of the steady state phase, and network usage on compute host 1 spiked to 5,831 Mbps. The steady state average network usage per user was 8.7 Mbps.
Figure 47. Network usage 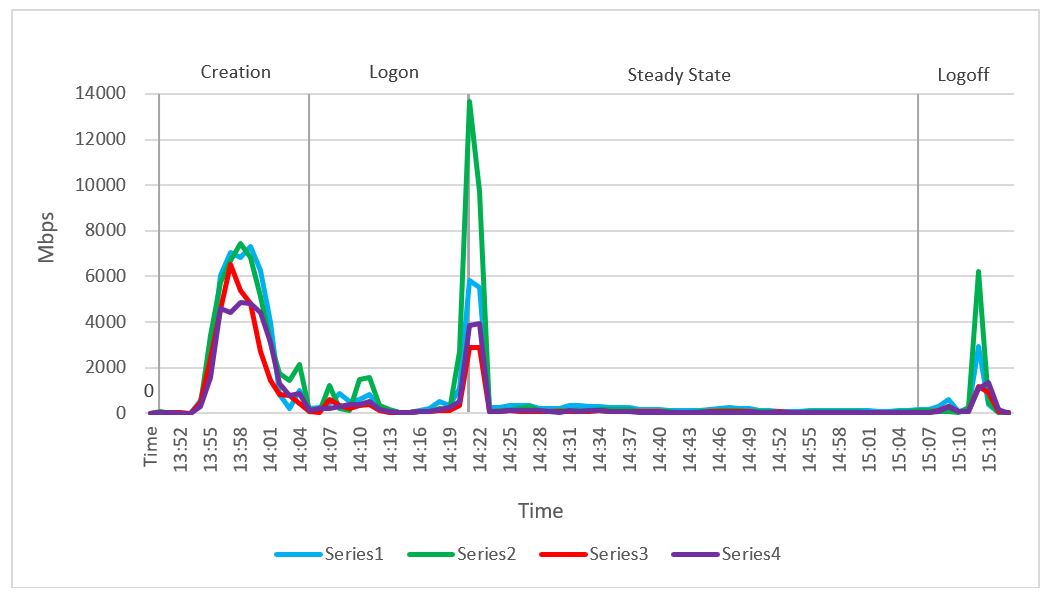
Cluster IOPS
Cluster IOPS reached a maximum value of 2,795 for read IOPS, and a maximum value of 1,987 for write IOPS during the testing. The average steady state read IOPS was 2,496 and the average steady state write IOPS was 1,557. The average steady state IOPS (read+write) per user was 84.
Figure 48. IOPS 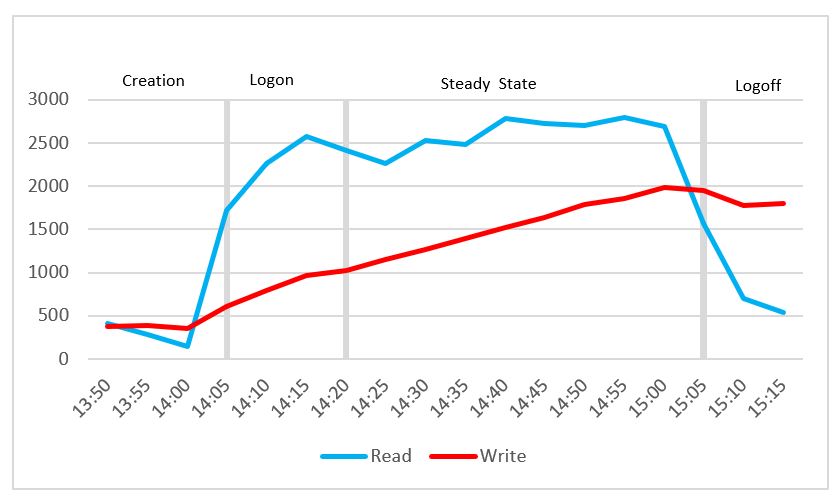
Disk latency
Cluster disk latency reached a maximum read latency value of 0.28 milliseconds, and a maximum write latency value of 0.81 milliseconds. The average steady state read latency was 0.23 milliseconds, and the average steady state write latency was 0.7 milliseconds.
Figure 49. Disk latency 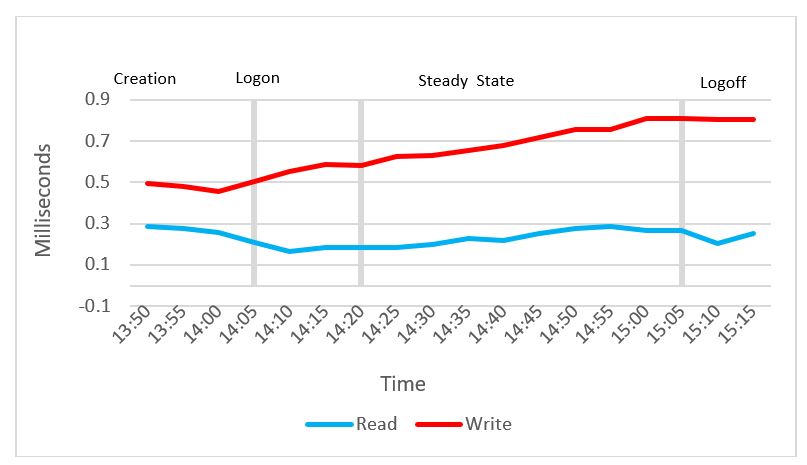
nVector Knowledge Worker, 48 users, non-graphics, ESXi 6.7u3, Horizon 7.10
We ran compute host 1 with 48 desktop VMs. No GPUs were configured. Host 2 ran the nVector launcher VMs. A launcher is an endpoint VM, from which the desktop VMs are launched. We configured the host 2 with three P40 GPUs, and the launcher VMs in host 2 were GPU-enabled through an NVIDIA GRID P40-1B profile. It is a requirement for the nVector tool to enable launcher VMs with vGPUs. Host 3 was provisioned with management VMs only, and host 4 did not have any load.
We used linked clone provisioning for this testing. Linked clones, as opposed to instant clones, are not re-created automatically after logout. We used the VMware Horizon Blast Extreme protocol as the remote display protocol.
CPU
The following graph shows the CPU utilization across the four hosts during the testing. We can see a spike in CPU usage for compute and launcher hosts during linked clone creation and the login phase. During the steady state phase, an average CPU utilization of 69 percent was recorded on the compute host. This value was lower than the pass/fail threshold that we set for average CPU utilization (see Table 12). Launcher host 2 and management host 3 had very low CPU usage during the steady state phase.
Figure 50. CPU usage 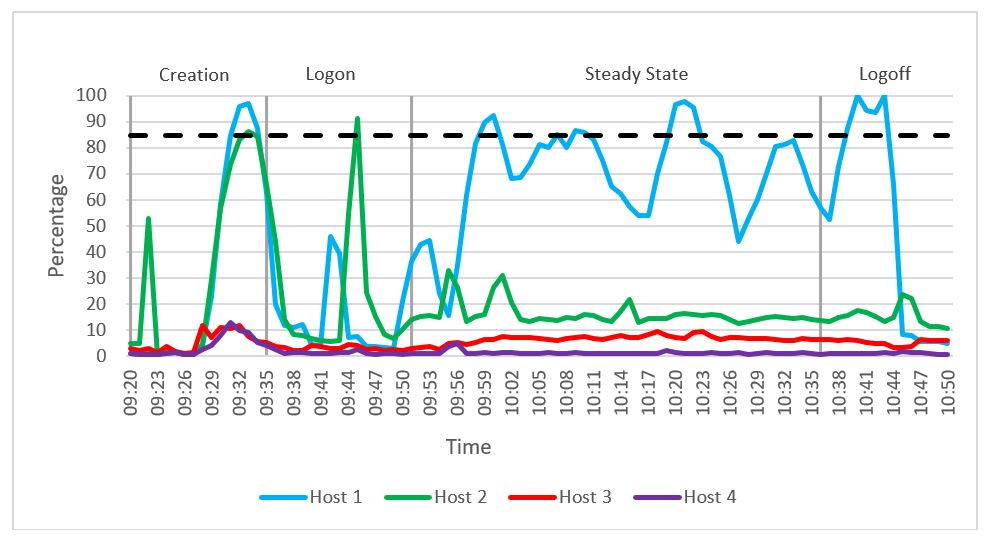
As shown in the following figure, the CPU readiness was well below the 5 percent threshold that we set.
Figure 51. CPU readiness
As shown in the following figure, the average steady state CPU core utilization on compute host 1 was 56 percent.
Figure 52. CPU core utilization 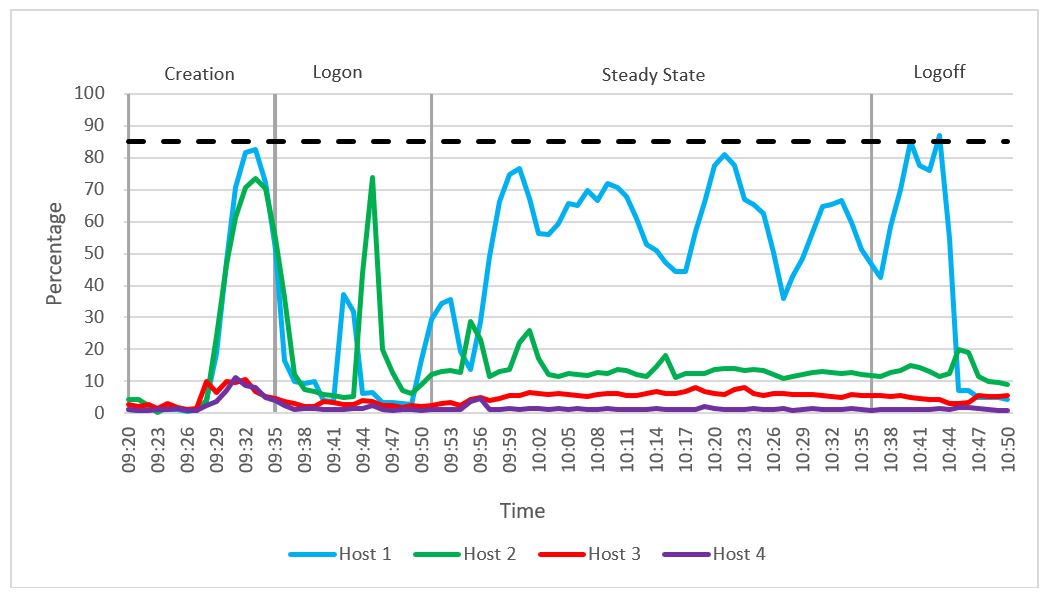
Memory
We observed no memory constraints during the testing on the compute or the management host. Out of 768 GB of available memory per node, compute host 1 reached a maximum consumed memory of 241 GB. Active memory usage reached a maximum of 67 GB. There was no memory ballooning or swapping on hosts.
Figure 53. Consumed memory usage 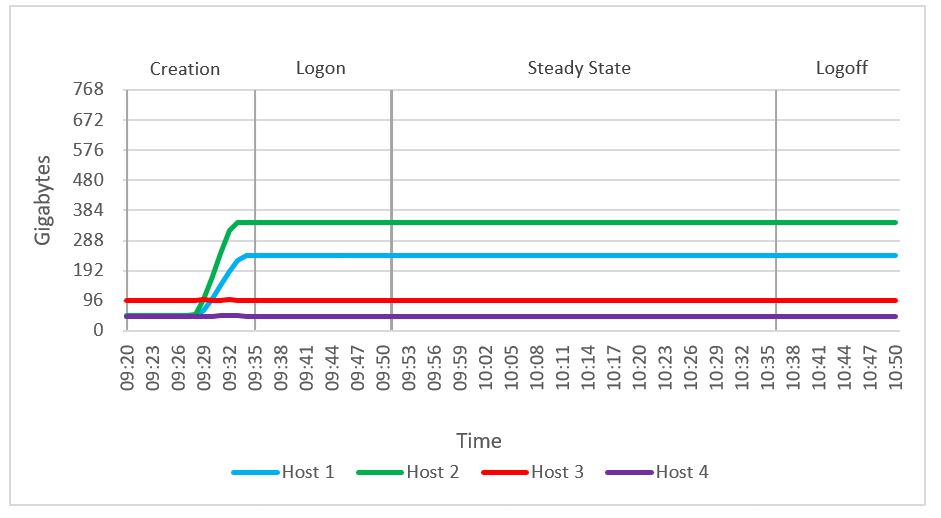
Figure 54. Active memory usage 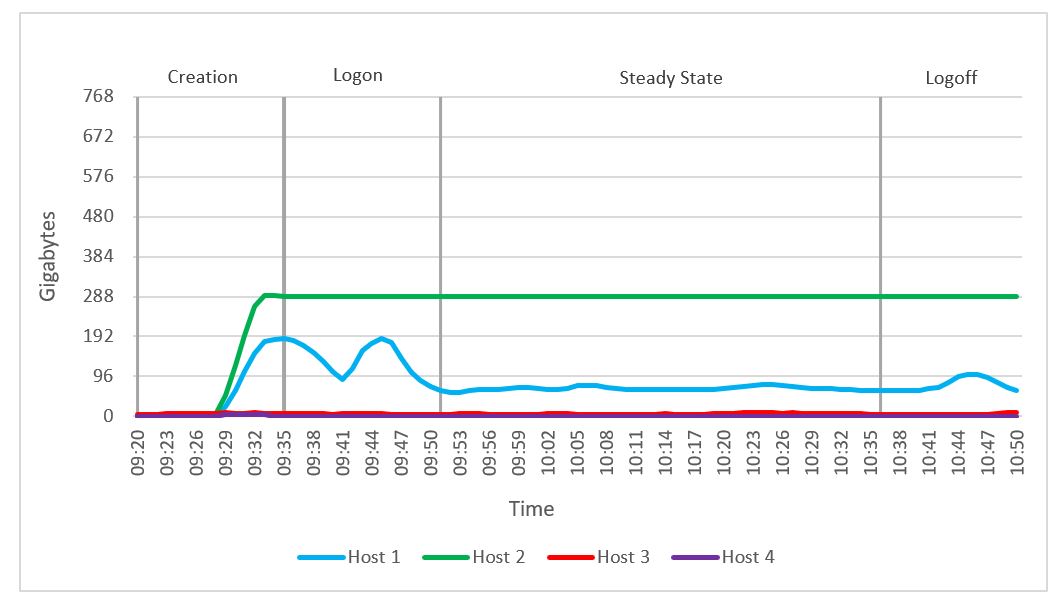
Network usage
Network bandwidth was not an issue in this test. A steady state average of 427 Mbps was recorded on compute host 1 during the steady state phase. The average network usage per user on compute host 1 was 8.9 Mbps. The busiest period for network traffic was during the linked clone creation phase.
Figure 55. Network usage
Cluster IOPS
The cluster IOPS reached a maximum value of 2,035 for read IOPS, and a maximum value of 1,984 for write IOPS during the testing. The average steady state read IOPS was 1,680, and the average steady state write IOPS was 1,455. The average steady state disk IOPS (read+write) per user during the steady state was 65.
Figure 56. IOPS 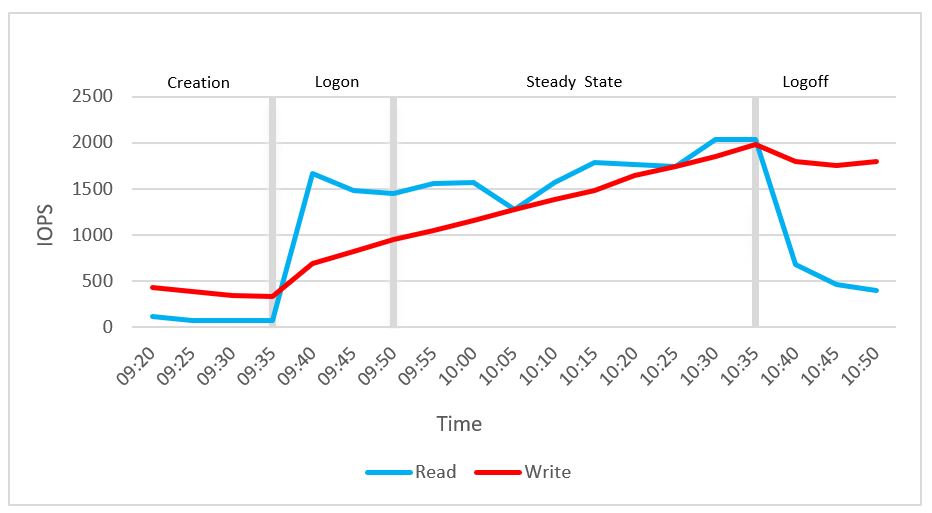
Disk latency
Cluster disk latency reached a maximum read latency of 0.3 milliseconds, and a maximum write latency of 0.8 milliseconds. The average steady state read latency was 0.24 milliseconds, and the average steady state write latency was 0.66 milliseconds.
Figure 57. Disk latency