
Balanced workflow
Balanced workflow
-
Many performance issues can be attributed to not using the entire cluster’s resources in a balanced manner. There are many reasons for having an unbalanced cluster. Some reasons include incorrect SmartConnect configuration, using IP addresses to connect directly to the cluster, not using all a cluster’s available network ports, or other incorrect configurations.
The ideal situation is to have an even distribution of both clients and network throughput to each node in the cluster. Sometimes external factors are influential, or a specific design for the workflow prevents a well-balanced workflow from being attained. An example of this scenario would be a two-tier cluster with high-performance nodes servicing the client front-end connections, and the archive nodes in the cluster are dedicated for data-replication traffic. Where possible, an even distribution is desirable.
For a given set of nodes, try to keep the percentage of the workload within +/-10% from every other node. A lower value like 5% or 3% would be ideal, but 10% is acceptable. A very unbalanced CPU utilization across the cluster can be a sign of a poorly balanced cluster.
When investigating whether your workflow is balanced, it is essential to perform a breakout by node.
The External Network Throughput Rate is a good metric to monitor for good workload balance. It can happen that a workload has very unbalanced usage which can cause overall cluster performance to be suboptimal. As seen in Figure 1, which is statistics data from a large 144 node cluster, the top five nodes drive 54.7% of total cluster throughput. This is a very unbalanced situation as each node would ideally have about 1% of the workload in a balanced setup.
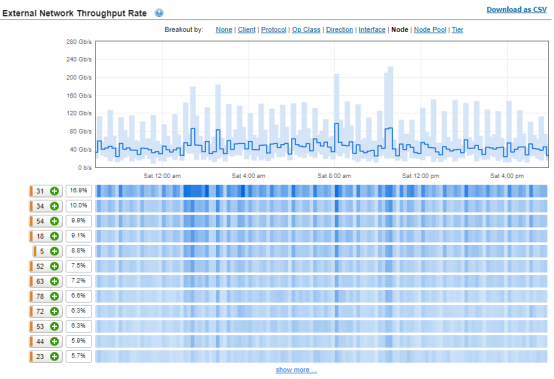
Figure 1. External network throughput rate
Another metric to monitor for good workload balance is the number of protocol operations that each node is servicing. Similar to the External Network Throughput Rate, the number of operations per second should be balanced across the nodes as much as possible.
Two other metrics which are important in a balanced workflow are the Connected Clients and Active Clients. These metrics normally correlate with the External Network Throughput Rate but can indicate the potential for unbalanced workflow.
A client is considered active if it is transmitting or receiving data. A connected client is one which has an open TCP connection to the cluster. A connected client can be idle, or it can be transmitting or receiving data. Due to the nature of the different protocols, the connected client count can sometimes be misleading because it can misrepresent the number of clients the system has. One example of this instance is for the NFSv3 protocol. NFSv3 is a stateless protocol and there is no requirement for a client to maintain a TCP connection nor perform any formal disconnect procedure. Another example is with SMB3 Multichannel, where one client has two connections.
As seen in Figure 2, the same 144 node cluster shows that the top five nodes have 54.3% of all client connections. This type of client imbalance is almost guaranteed to result in an unbalanced workload.
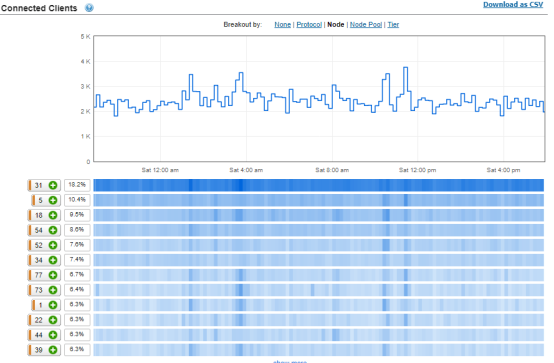
Figure 2. Connected clients
There are also guidelines that are published in the PowerScale Technical Specifications Guide for OneFS. These guidelines provide a recommendation for the number of active and connected clients on a per-node basis. The number of connections depends on the OneFS version, the type of node, available RAM, and the protocol. The table below would apply to an H500 node. Archive nodes like the A200 would be less capable while higher end nodes like the F600 or F800 could handle more clients. These limits are guidelines and there is no guarantee that they can be achieved in your environment and workload.
Table 2. Connection counts per node
Protocol
Active clients per node
Connected clients per node
NFSv3
1000
Limited by available sockets
NFSv4
1000
Limited by available sockets
SMB1
1000
2000
SMB2
3000
27000
SMB3
3000
27000