
Enabling Grafana dashboards
Enabling Grafana dashboards
-
To view cluster metrics in the OpenShift web console, enable the Grafana dashboards by following these steps. Unless specified otherwise, run all the commands as user core.
- Log in to the CSAH node.
- Obtain the Grafana route:
[core@csah-pri ~]$ oc get routes --all-namespaces |grep -i grafana
openshift-monitoring grafana grafana-openshift-monitoring.apps.ocp.example.lab grafana https reencrypt/Redirect None
Open a web browser and paste in the URL (grafana-openshift-monitoring.apps.ocp.demo.lab from the preceding output example).
- Log in as kubeadmin or as a user with cluster admin privileges.
A list of available components in the cluster is displayed.
 Click and select Manage. In the Search bar, provide etcd and press Enter.
The dashboard shows the active streams, the number of etcd nodes that are up, and other details, as shown in the following figure:
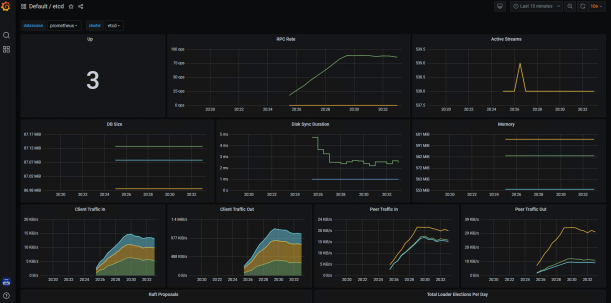
Figure 21. Grafana dashboard example