
Ensemble model
Ensemble model
-
The final model consists of an ensemble of a Statistical Conditional Probability model and a Random Forest Model. The Conditional Probability model provides the probability for each resolution being successful upon encountering a single error code. Random Forest model considers the different combinations of error codes associated with corresponding software resolutions or dispatches.
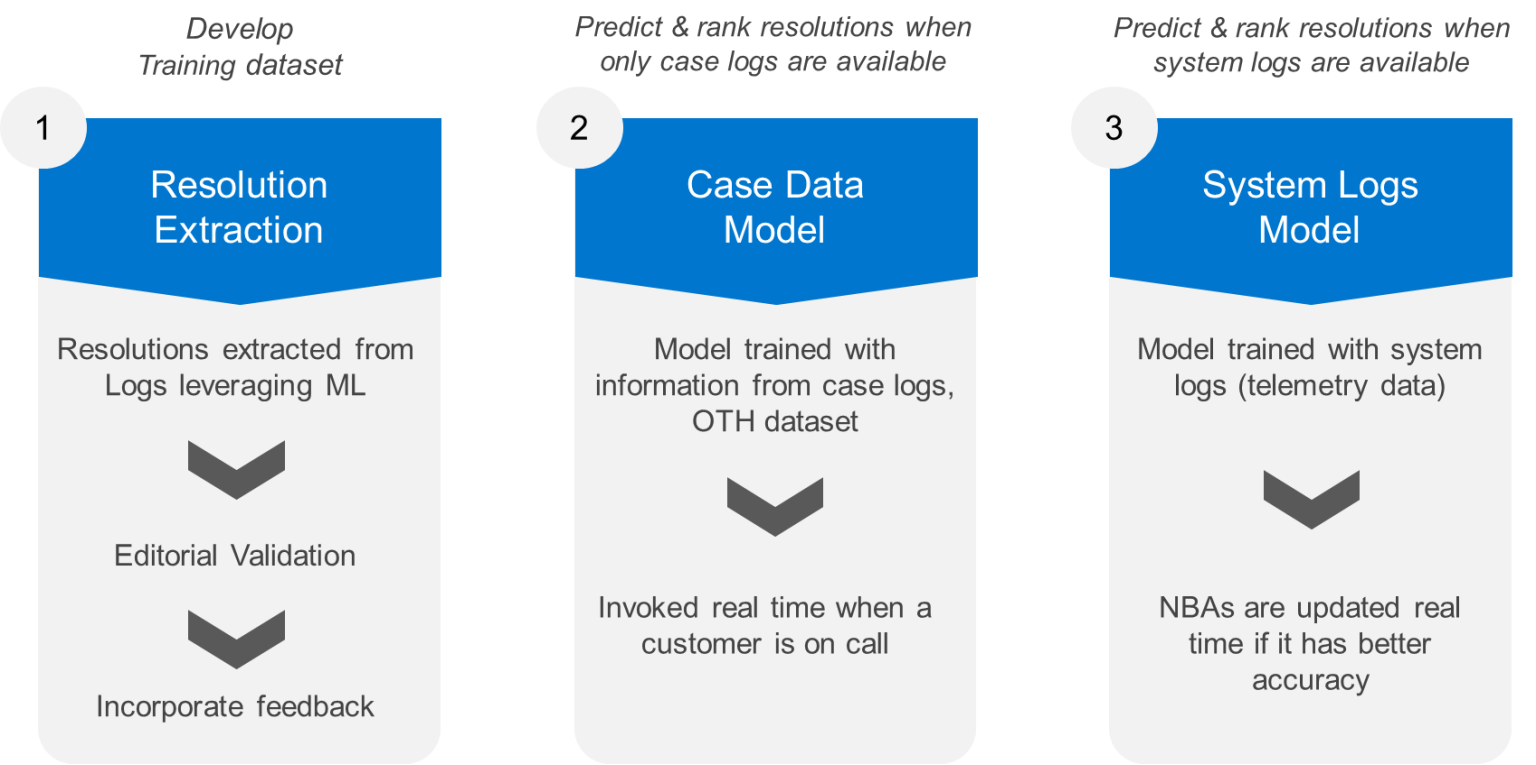
Figure 1. Solution overview
Resolution extraction
Research was limited by the unavailability of required data in a single source. The first step was gathering data from multiple sources to create a unique source of truth.
The main source of labels is the high volume of call logs and email messages between support agents and customers. The initial exhaustive list of all the resolutions that can possibly be attempted for this product line was obtained with the help of some business experts and frontline agents.
There are several ways to extract data labels or resolutions from email messages and call logs and a variety of methods were explored.
The most successful approach to extract data involved sampling a few cases and manually extracting all the resolutions. Key words were extracted from the data and these resolutions were binned into three categories: parts, verbs, or adjectives.
Server parts like disk, ram, memory, and others are classified as parts. Actions taken by the agent like updated, replaced, and reseated are classified as verbs. The sentences that include at least one part and one verb are shortlisted. A small sample remains after the keyword extraction. The summarizer keeps only a few sentences from an email with valuable information, as shown in Figure 2.
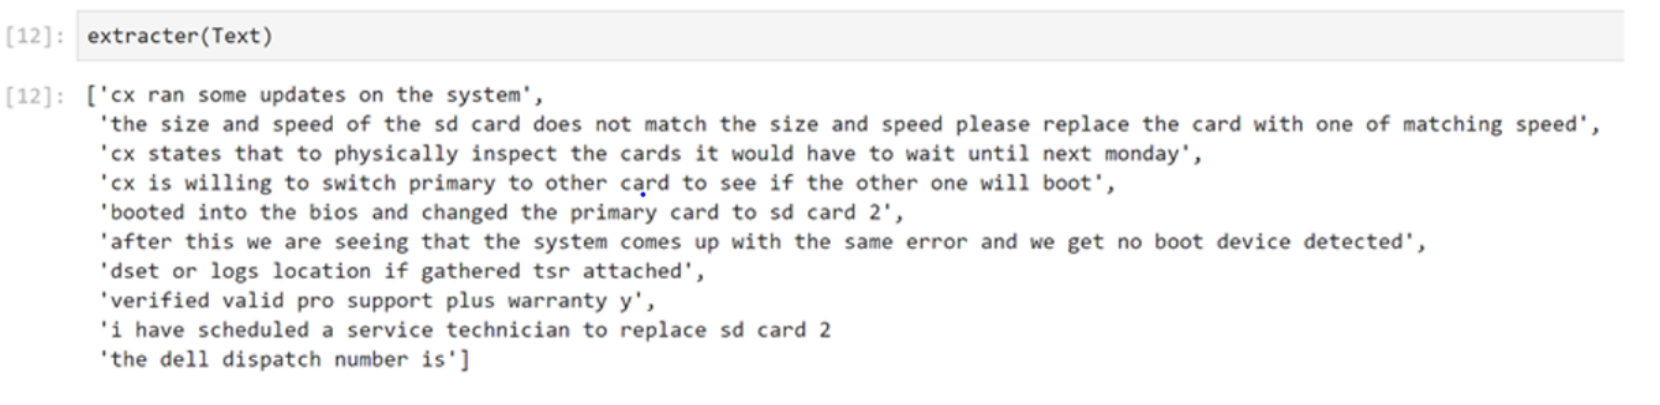
Figure 2. Example sentences after extraction
All the extracted sentences are compared to the resolution list using a metric called Bilingual Evaluation Understudy (BLEU) score which is a metric used commonly to rate translation accuracy. This metric ensures that the actual translation and machine translated sentences are the same. This metric cannot capture the meaning of the sentences, meaning different sentence structures in which a resolution can be written are necessary.
Due to the high volume of keywords and sentence structures, an additional method was added to this process.
After the extracted sentences are compared using the BLEU metric, they are filtered using a funnel chart. Keywords are filtered separately for key words and resolution matches. There is an initial 58 percent drop and a subsequent 83 percent drop in the total volume of sentences extracted from the logs after all iterations. These dropped sentences are sampled, and a subsequent round of extraction is conducted on the sample. This subsequent sample identifies key words, and possible sentence structures for resolutions can be extracted and added to the final list manually. After some iterations, it becomes exceedingly difficult to find any new key words or new resolutions at which point the method reaches the point of diminishing returns and is halted.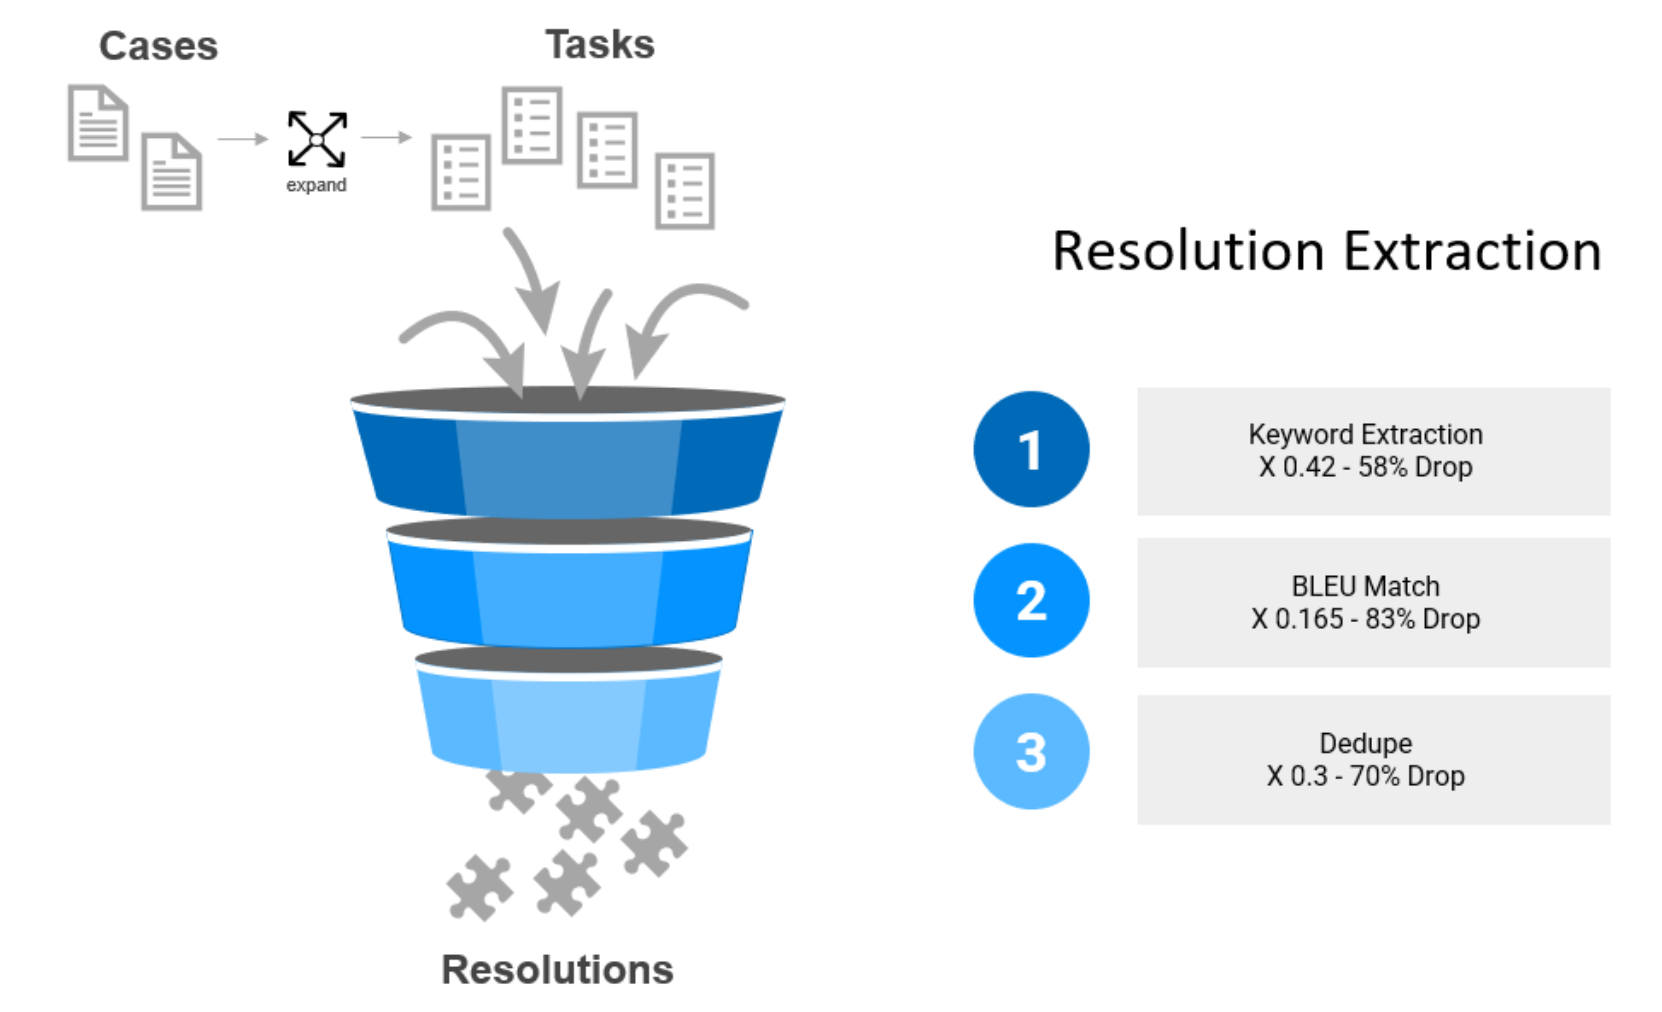
Figure 3. Resolution extraction process
Case model
The labels extracted from resolution extraction enable the data science team to leverage a traditional supervised model. Due to the efficiency of deep learning models for text data and multiclass and multilabel problems, deep learning models were selected for this project. Few models work well under the mentioned conditions. Most of them work by having a separate classifier for each class. For this solution, having a common deep learning model enables weight sharing across all classes which gives a unified and well-integrated model about all the individual classes.
This solution relies on Long Short-Term Memory (LSTM), skip connections, and Word Embeddings which are trained from scratch specifically for this use case. For more details, refer to the model architecture diagram below.
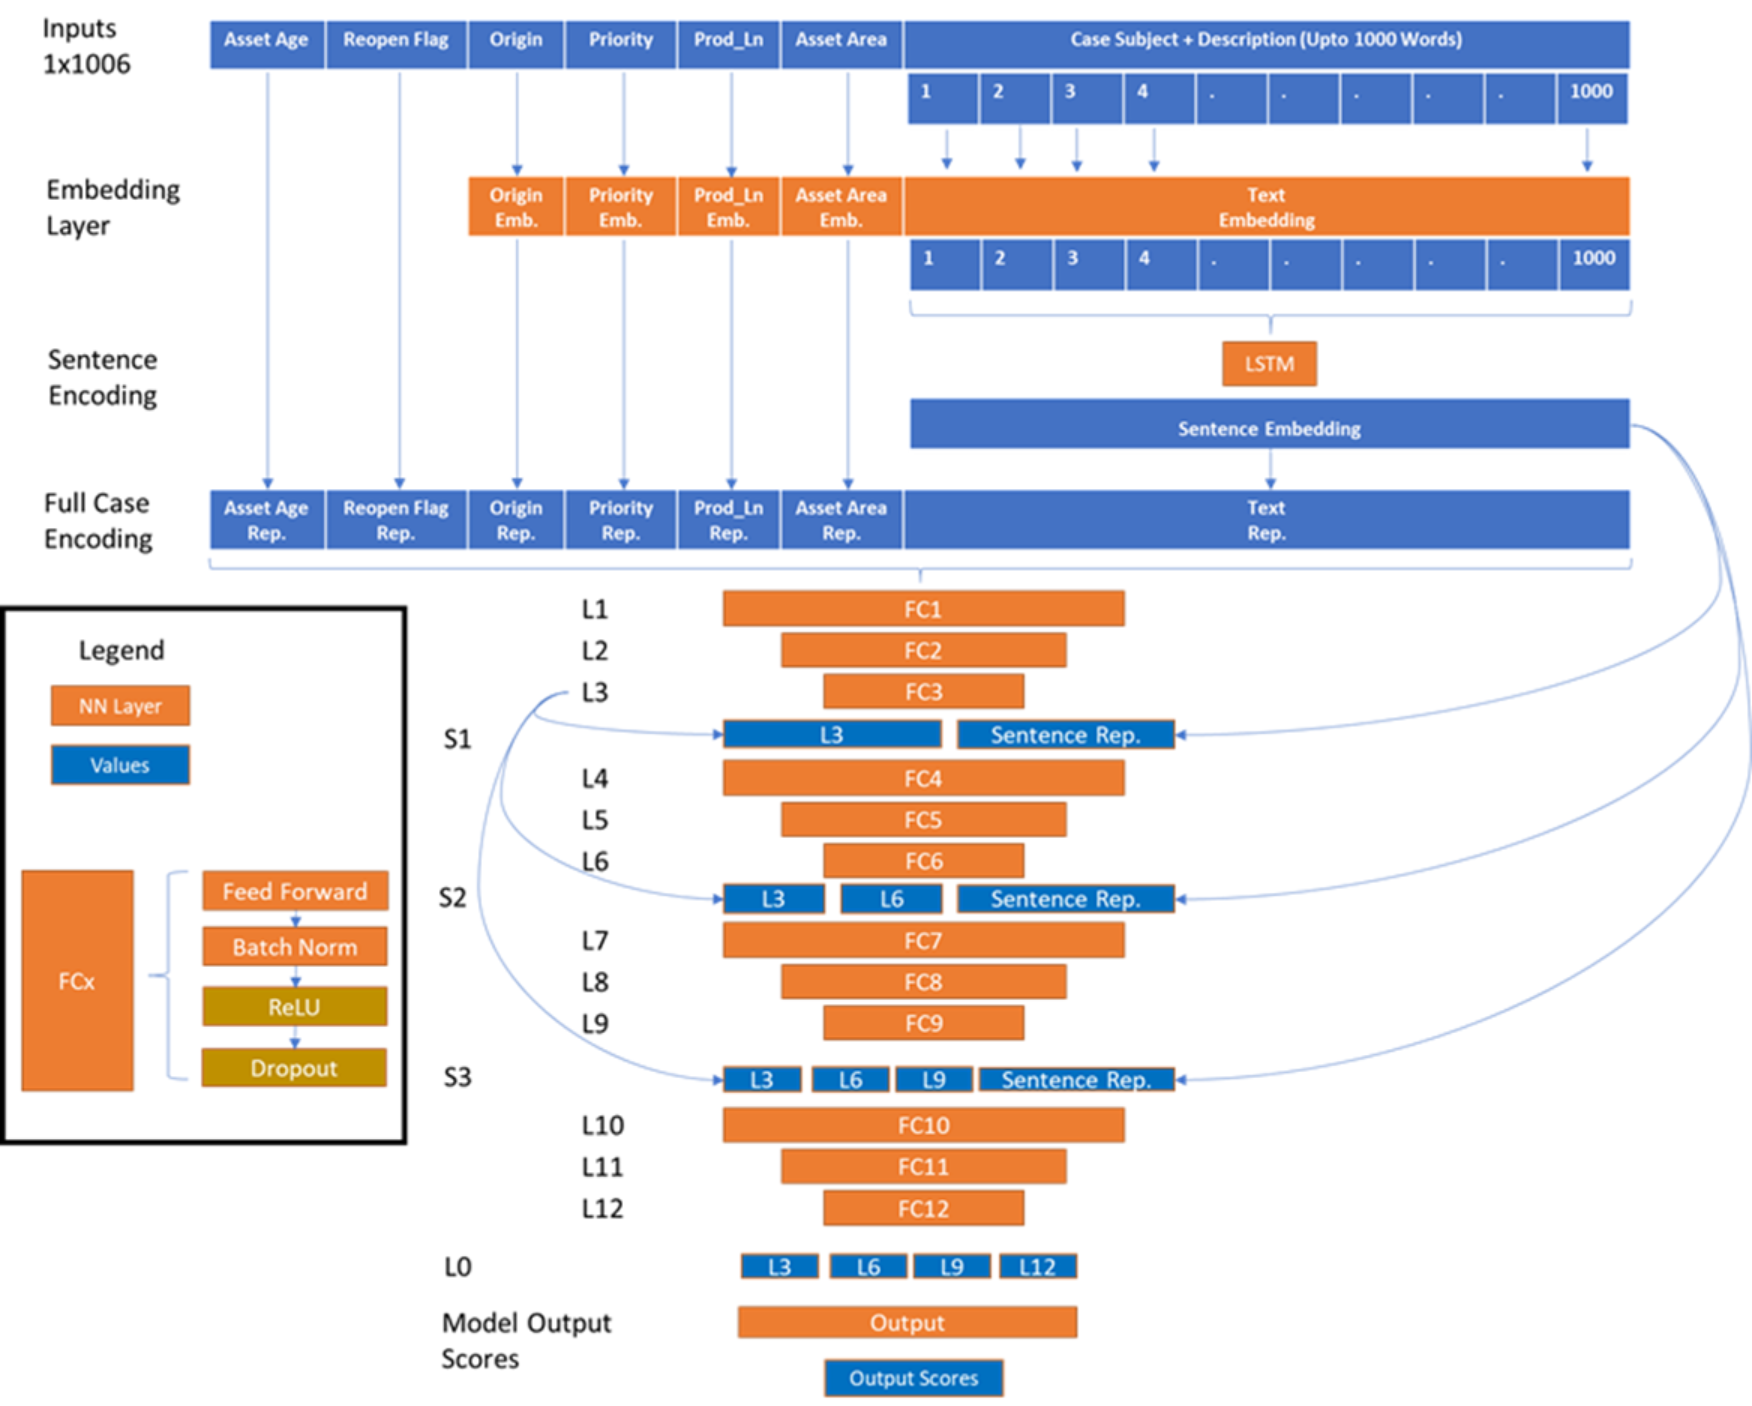
Figure 4. Case Model Architecture
Note: The input layer is the predictors.
All categorical inputs have a separate embedding layer trained from zero. Many pretrained embeddings like fast text and Elmo are trained on data such as books, Wikipedia, and social media. These inputs tend to have similar embeddings for all computer parts. Parts like disk and ram should have embeddings that are as far away as possible from each other. At the end of the training, the input layer produces Dell Infrastructure Solutions Group (ISG) specific embeddings for all words that can be used for other projects as well.
The Text embeddings pass through an LSTM to capture the sequence information in Text.
All the embeddings are concatenated and passed through 12 linear layers.
The arrows that concatenate the old inputs to the outputs represent skip connections that help optimize training for the model. Each of the forward layers used standard Batch Normalization and Dropout.
The output layer converts a shared embedding into 250 different independent probabilities for each of our resolutions.
System Logs Model
The System logs model uses Proprietary Dell Technologies Tools to identify the best resolutions to solve the issues in a similar way to the Case Model, but by only using System Logs information generated by the server.
Dell continuously monitors the Telemetry and Configuration Data, from the servers that clients have agreed to, to look for anomalies, error messages, logs, and other data to determine if the server is operating under normal conditions. Our advanced ML models are trained to identify the error patterns and can suggest actions to fix the identified issues. Under certain conditions our models can identify problems with servers three to seven days before the problem causes downtime for the server. When used with the Case Model, our overall accuracy improves drastically with the addition of System Logs and expedites the troubleshooting process.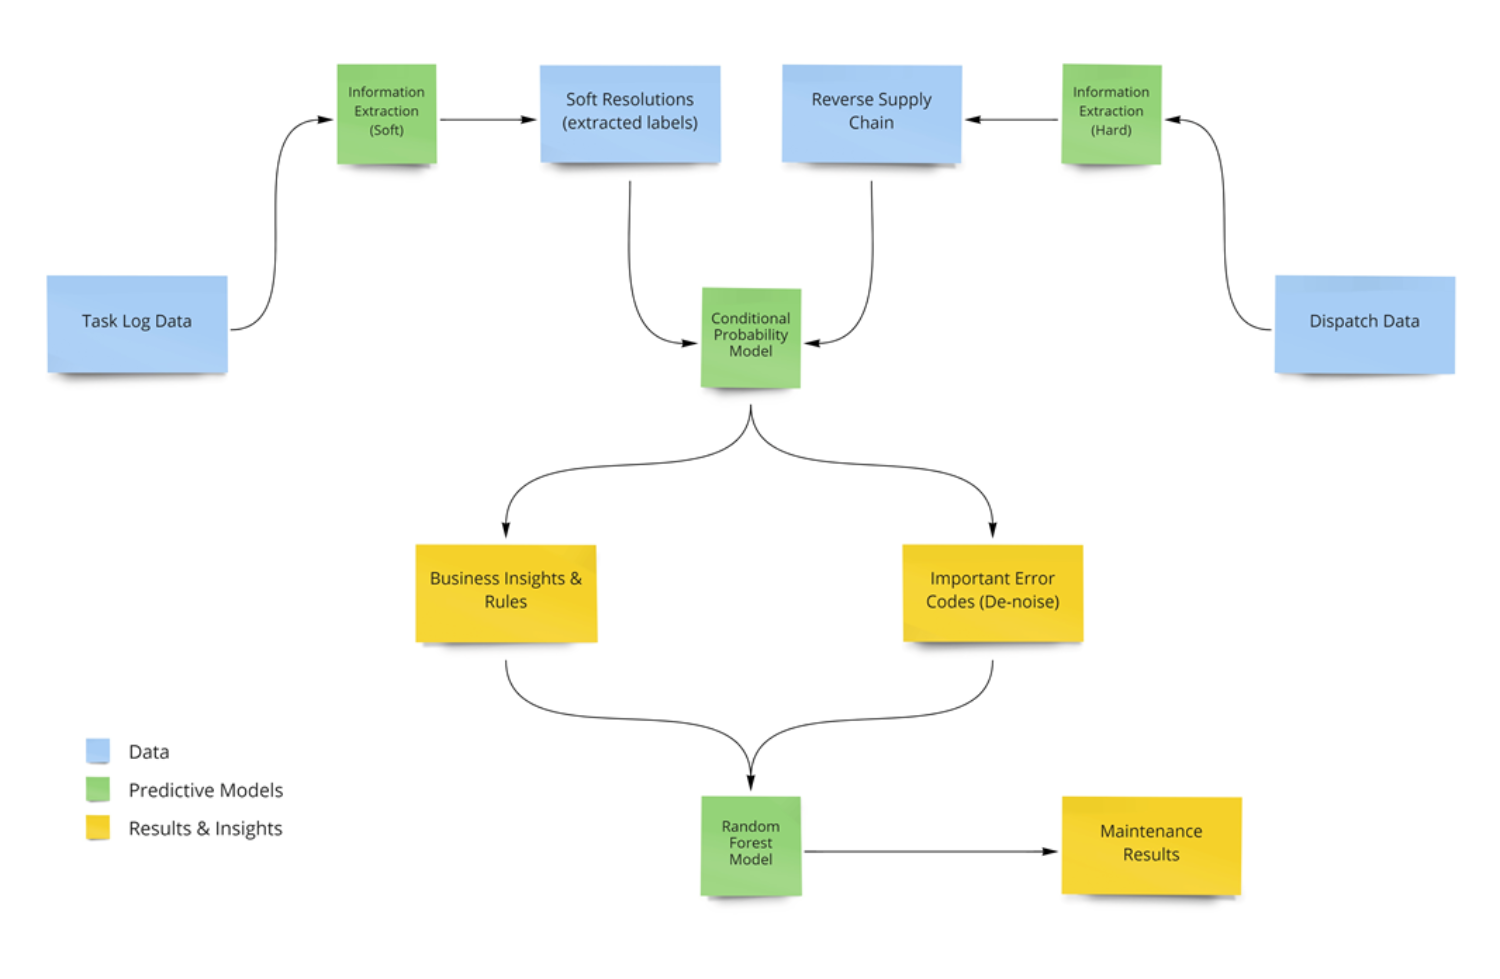
Figure 5. System Logs Model Architecture
Our models are trained with hundreds to thousands historical cases to identify error signals and agent actions to resolve the issues. We use the Resolution Extraction Module to extract soft resolutions that are performed in every case. To improve the performance, we also assess Reverse Supply Chain Data which contain the result of testing a sample of hardware parts returned from the faulty system after dispatch. These parts are tested to determine if any problems can be identified to verify the initial troubleshooting implemented by the agent. If no fault can be identified in the old part that means that the dispatch made in the case was wrong. This enables us to also determine where dispatches are made without necessity. This ensures a reduced number of faulty dispatches and more cases solved with software fixes.
These two datasets are combined to generate a Statistical Conditional Probability model and a Random Forest Model Ensemble which provides a 20 percent improvement in Top 3 Accuracy on Test Datasets in addition to some Business Insights and Rules which help with model explain-ability and additional insights about the process and inner workings of the model. The Conditional Probability model provides the probability for each resolution being successful upon having encountered a single error code and works in situations where there is little data. The Random Forest model considers the different combinations of error codes associated with corresponding soft resolutions or dispatches. The combination of these two models delivers the best performance and compensates for the low volume of data for different error code and resolution combinations.
Our System Logs models could achieve over 80 percent accuracy of the top three resolutions recommended on Test Datasets using limited Telemetry Information.
Technical evaluation of solution
Evaluation is an integral part of model development. It helps us understand whether a specific model generalizes well with unseen data. Multiple evaluation techniques were used to ensure NBA recommendations were relevant:
- an offline evaluation on a test set of unseen historical cases, occurs immediately after training
- an empirical evaluation with the help of subject matter experts
- post deployment feedback loop
Conventional ML metrics like F1 scores are used for classification or R2 for regression. However, in this case, these metrics do not denote order of ranking of sets or varying sizes.
Precision and recall are useful; but these metrics do not account for the different ordering in our list, which is solved by using normalized discounted cumulative gain (NDCG). NDCG is a measure of ranking quality that takes position significance into account. A simpler metric, termed has successful, also measures top-k accuracy, and is used for the sake of simplicity and explain-ability. We evaluate the model performance at top 1, 3, or 5 recommendations based on the ranked list.
For the empirical validation process, a subsample of the latest data is sampled at random and run through the model. The generated predictions and original case information are subsequently provided to support agents who validate the same. Based on the feedback provided by the agents, the overall accuracy of the model is evaluated. This manual validation process helps us confirm the accuracy of our algorithmic evaluation.
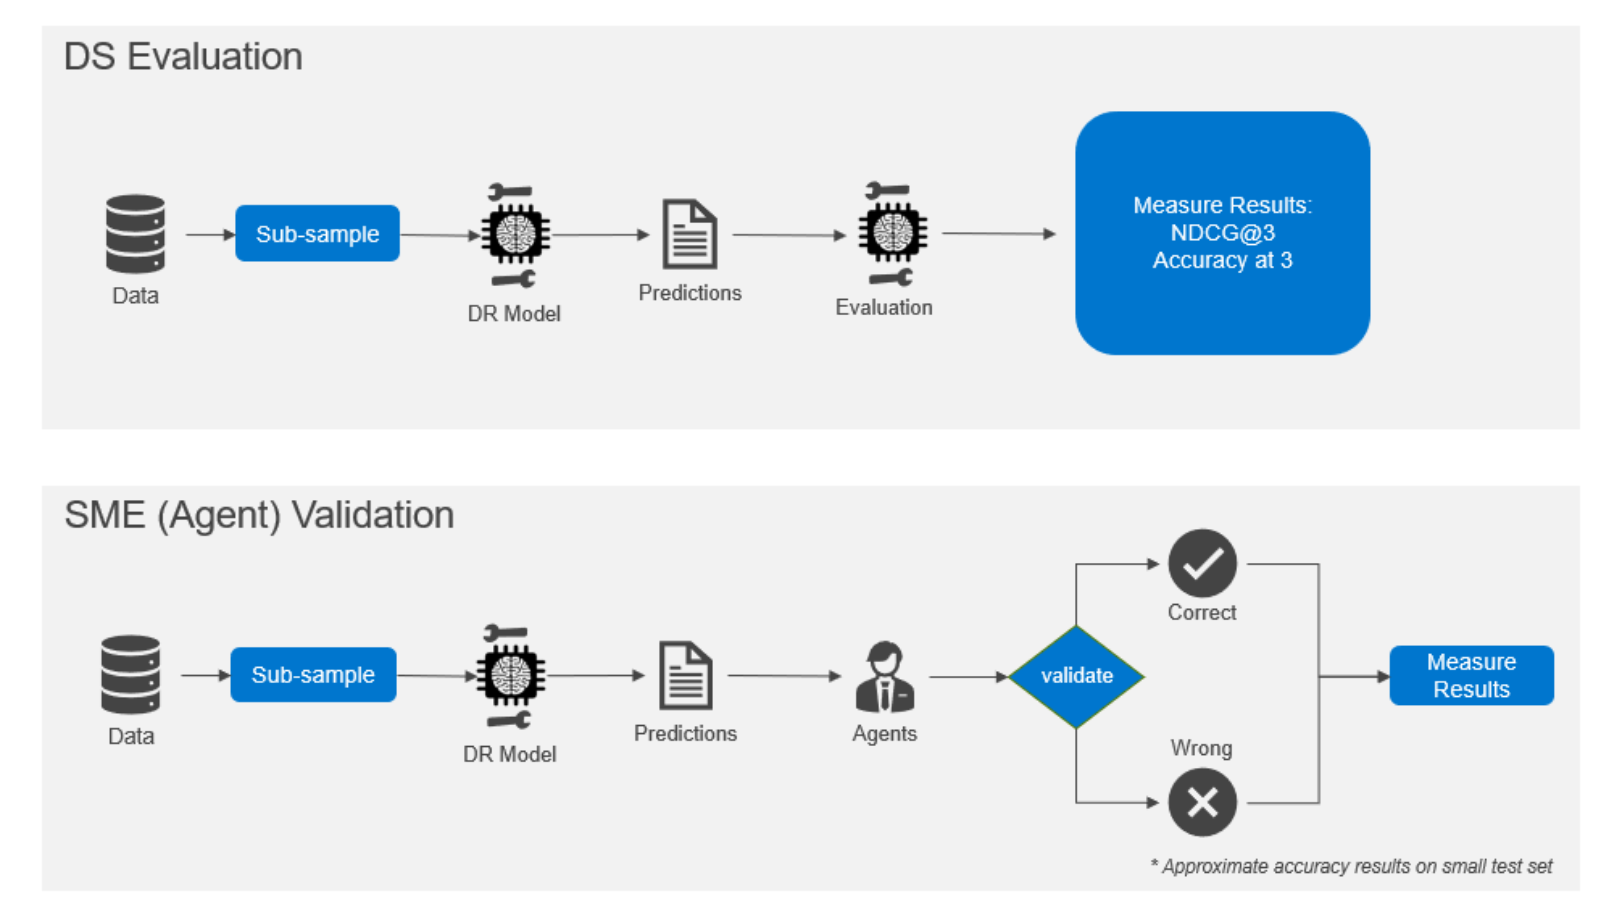
Figure 6. Dual evaluation process
The model performance evaluation continues after deployment. For each NBA recommendation displayed the support agents provide “thumbs up or thumbs down” feedback that indicates whether this recommendation helped in resolving the customer problem. We use this and additional free form text feedback to continuously improve our models by ingesting agent feedback and addressing prominent concerns.