
Leveraging historical insights
Leveraging historical insights
-
The following data analyses were performed to produce efficient forecast results:
Low volume and high volume analysis
While working on different demand signals like SRs and dispatches, different volume patterns like drops and spikes w.r.t fiscal-weeks were observed. Not all timeseries have the same amount of volume and impact on overall trend. Some timeseries have consistent volume while others have sporadic demand. It is not necessary to apply the same models to every timeseries.
As shown in Figure 13, 95 percent of the volume of SRs falls in a low volume category.
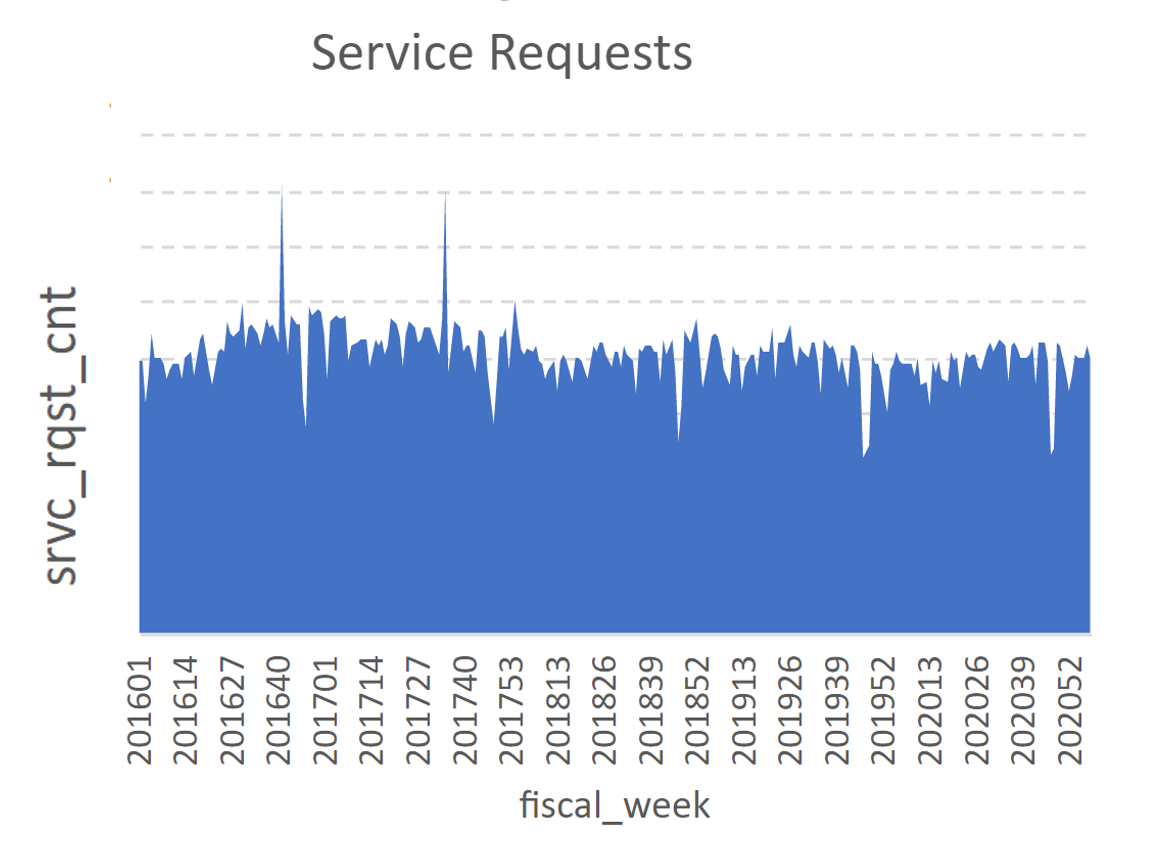
Figure 13. SR counts are presented w.r.t fiscal-week without any volume seperation
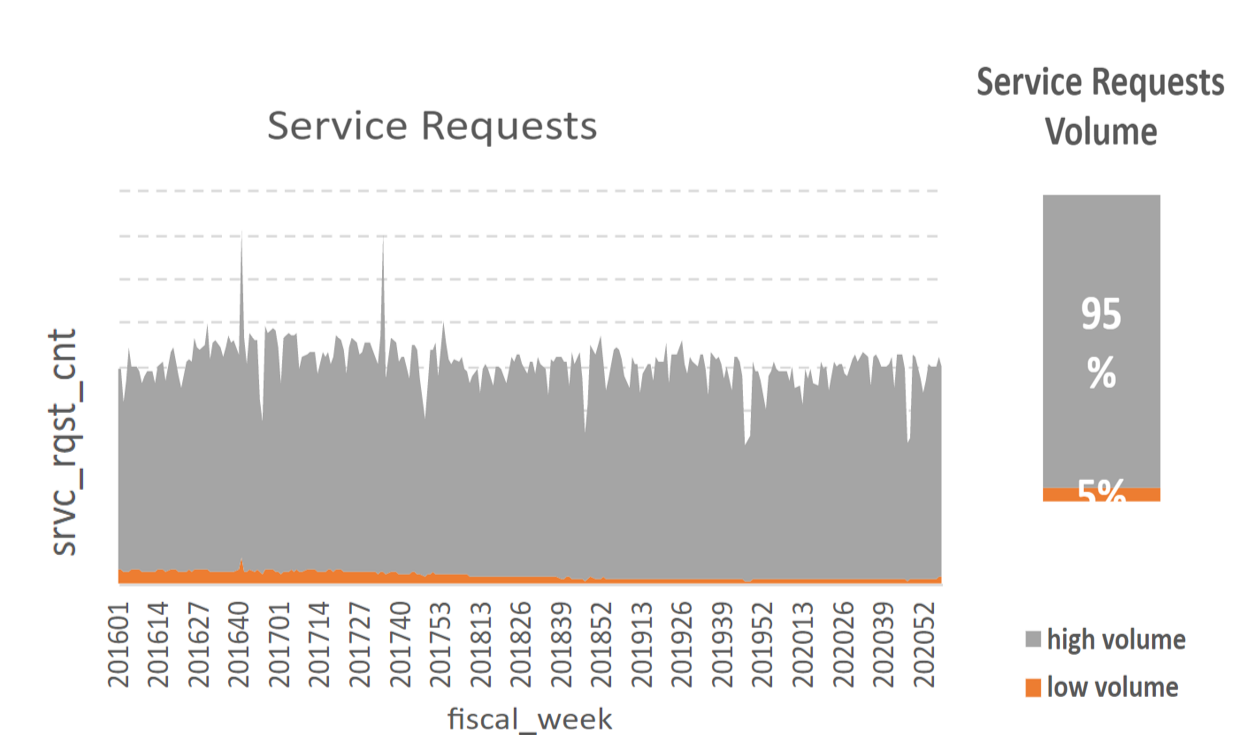
Figure 14. High and low volumes representation as percentage count distribution
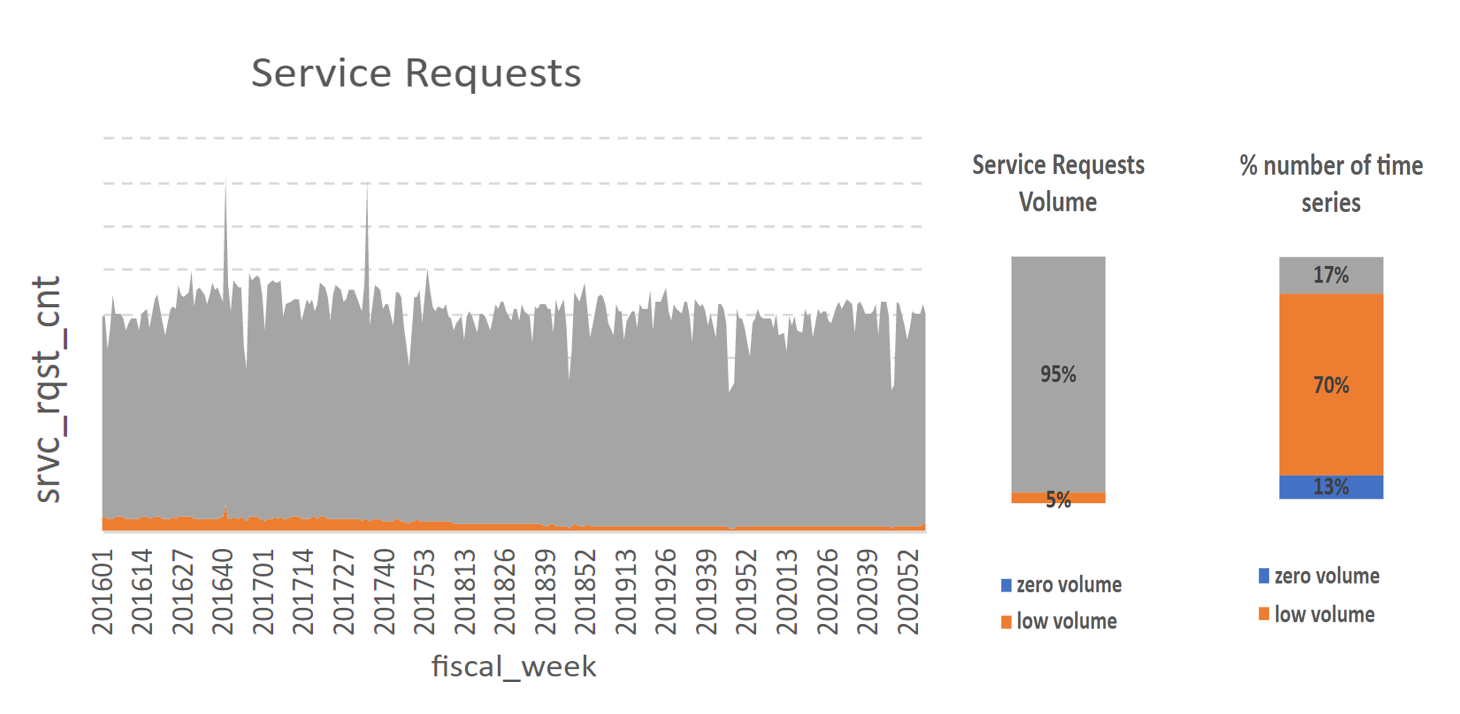
Figure 15. High, low, and zero volumes representation as percentage number of time series
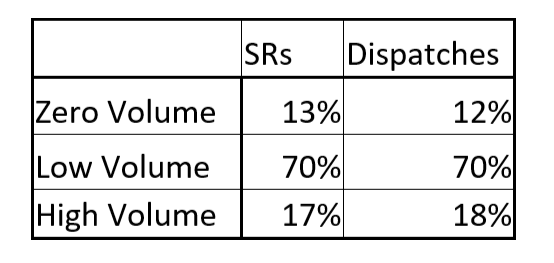
Figure 15. Percentage of SRs and Dispatches
Analysis: COVID-19 impact
COVID-19 caused a drastic disruption in supply and demand which resulted in around a 40 percent drop in dispatches and SRs that would impact the forecast results. Figure 15 shows the drop in dispatches count which has been normalized to get the accurate results for post COVID-19 forecasts.
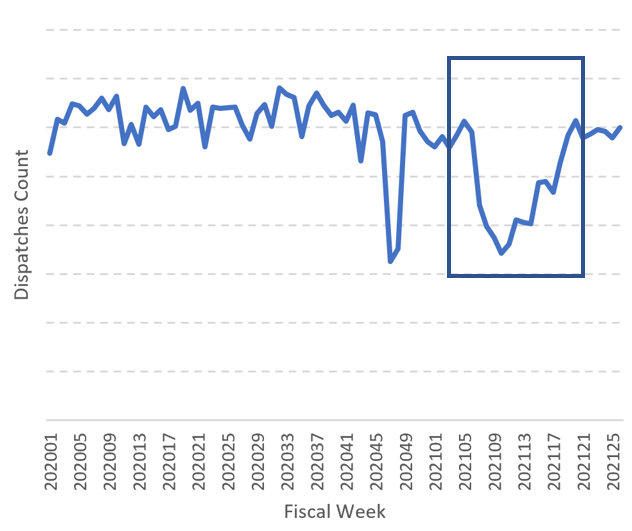
Figure 16. Dispatches count compared to fiscal weeks
Analysis: Holiday significance analysis
During all public holidays, large variations can be seen in count volume for all demand signals like ASUs, SRs, and dispatches. Some holidays only impact certain regions. For example, Christmas is significant in US while some other countries do not experience any variation around this holiday.
Variation among lobs, which is a product that tends to have a high holiday impact, is also significant.
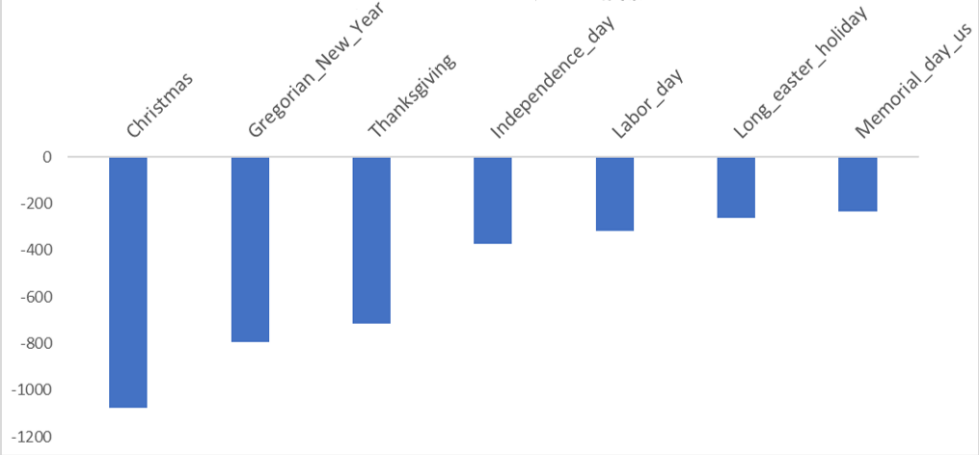
Figure 17. Holiday list vs. demand signal volume count