
Use cases
Use cases
-
The DVD for Manufacturing Edge with Litmus solution delivers specific operational outcomes for manufacturers. It is an IT infrastructure that achieves manufacturing-related outcomes quickly and easily, as demonstrated in the following specific, validated, and tested use cases.
By ingesting and normalizing data from industrial manufacturing assets and systems, the solution then easily builds use cases through its Analytics and Flows features within Litmus Edge. It also helps manufacturers:
- Reduce costs
- Increase and optimize operational asset performance
- Optimize the production process
- Increase and optimize yield
Note: Other use cases and specific operational outcomes can be built to run on the solution. The specific use cases that are shared here are designed to help manufacturers.
Overall equipment effectiveness (OEE)
OEE is a calculation based on availability, performance, and quality, and is a common Key Performance Indicator (KPI) in manufacturing. Operationally, high OEE value is a critical metric that manufacturers strive to improve each year.
To offer context, a 100% measure of OEE infers a perfect product with no delays in manufacturing operations. This means that every product is in good condition with no scrap or defects, and all production machinery and assets are available at all times. The following key metrics are used to measure OEE:
Availability
This refers to the uptime of manufacturing assets and process. Unplanned downtime negatively impacts the OEE metric, and 100% availability means that assets and process are always running during planned production.
Note: Scheduled maintenance outside of production time windows does not have a negative impact on availability or OEE.
Performance
This is a measure of how well the manufacturing process is running. If the process is fully optimized and product moves at the expected rate (cycle time), the performance metric is 100%. However, if machinery or process factors impact the rate of progress, this impacts the performance score. This includes slow cycles, idling or small stops, or downtime and outages.
Quality
One-hundred percent quality means that only good product is being manufactured with zero defects or requirements to reassess elements of the process.
Obtaining and understanding an accurate OEE measurement can be challenging, as operators must have the following abilities:
- Access real-time data from all manufacturing assets.
- Understand production processes and scheduling.
- Have a clear understanding of what optimal manufacturing output is from a quality perspective.
- Have a capacity to view OEE metrics on a dashboard or visualization tool in near real-time.
The DVD for Manufacturing Edge with Litmus provides a method for manufacturers to build an OEE management approach from scratch.
The following figure and description are an example of an analytics flow built on Litmus Edge.
Note: This is a sample course. Flows and analytics are further reviewed in the Understanding the Litmus Platform section.
Note: The OEE calculation for a given asset or manufacturing process can be built, edited, or optimized for any scenario. Litmus Edge provides an easy, GUI-driven approach to help manufacturers quickly visualize OEE.
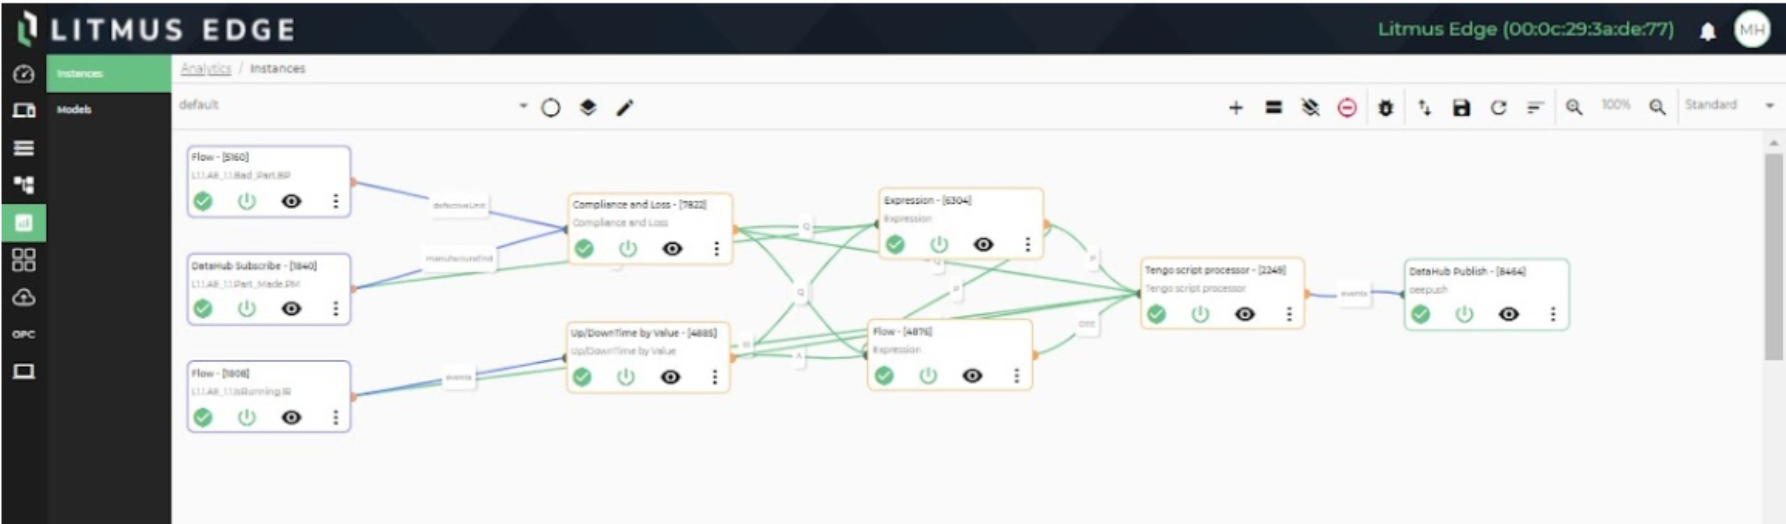
Figure 2. Flows and Analytics in Litmus Edge
- The three nodes on the left side draw raw data from OT systems, machines, and assets connected to the edge device. The data points relate to production data, scrap metrics, and machine status. These three flows normalize the OT data and pass it to the data processer nodes.
- The four middle nodes are processor nodes.
- The first (upper left) receives the data that is related to the production and scrap and calculates a quality KPI stream as data is received from the equipment.
- The second (bottom left) receives equipment status data that is used to create an asset utilization metric based on the uptime or downtime of the asset and the expected status metrics that are configured for the machine.
- The next node (upper right) is a custom calculation to measure productivity.
- Finally, the last (bottom right) calculates OEE-based inputs from the other three processor nodes.
- On the right side are nodes that publish the data to the persistent datastore on Streaming Data Platform, or northbound to a visualization tool such as Grafana or an application enablement platform such as PTC ThingWorx.
The following is an example of a visualization for OEE related to the example above and built in Grafana.
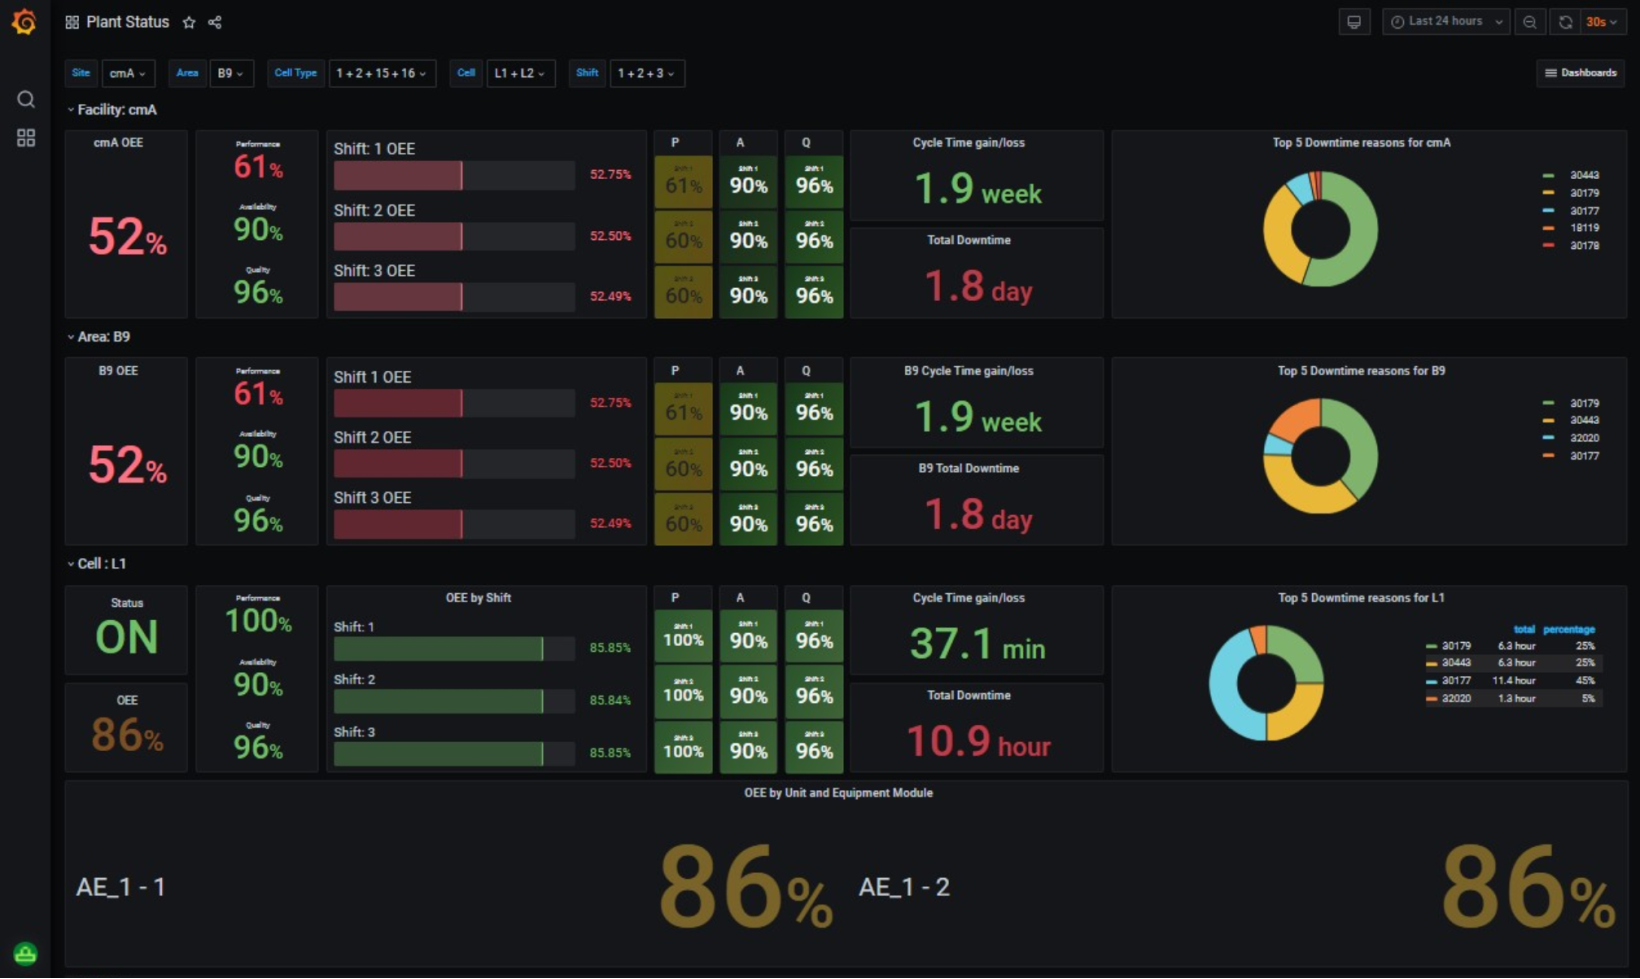
Figure 3. Sample OEE dashboard in Grafana
The above dashboard enables OEE review at different levels, including:
- Plant level, on the top horizontal pane
- Line level, on the second horizontal pane
- Build cell level, on the third horizontal pane
- Asset level, on the bottom pane
In summary, the DVD for Manufacturing Edge with Litmus provides an easy solution for taking control of OEE metrics by simplifying OT data, creating analytical capabilities, and outputting the metric to the manufacturer’s visualization display of choice.
Predictive maintenance
Predictive maintenance helps plan asset and machinery maintenance at the optimal time based on their condition during normal operations. It indicates the best time to service equipment, as opposed to relying on set preventative maintenance scheduling that impacts production or creates dependencies on vendors and maintenance teams.
Utilizing predictive maintenance in manufacturing offers significant benefits such as:
- Improved Return on Investment (ROI) on manufacturing assets
- Increased asset lifetime to help ensure longevity and productivity
- Reduced Mean Time to Repair (MTTR)
Predictive maintenance depends on the condition monitoring of assets, making the DVD for Manufacturing Edge with Litmus a strong solution as it simplifies connectivity to operational technology (OT) assets, delivers insights though analytics and streaming data capabilities, and allows for scale and resiliency across diverse manufacturing systems and platforms.
Building on previous examples, the following example of a Grafana dashboard represents a manufacturer’s predictive maintenance monitoring.
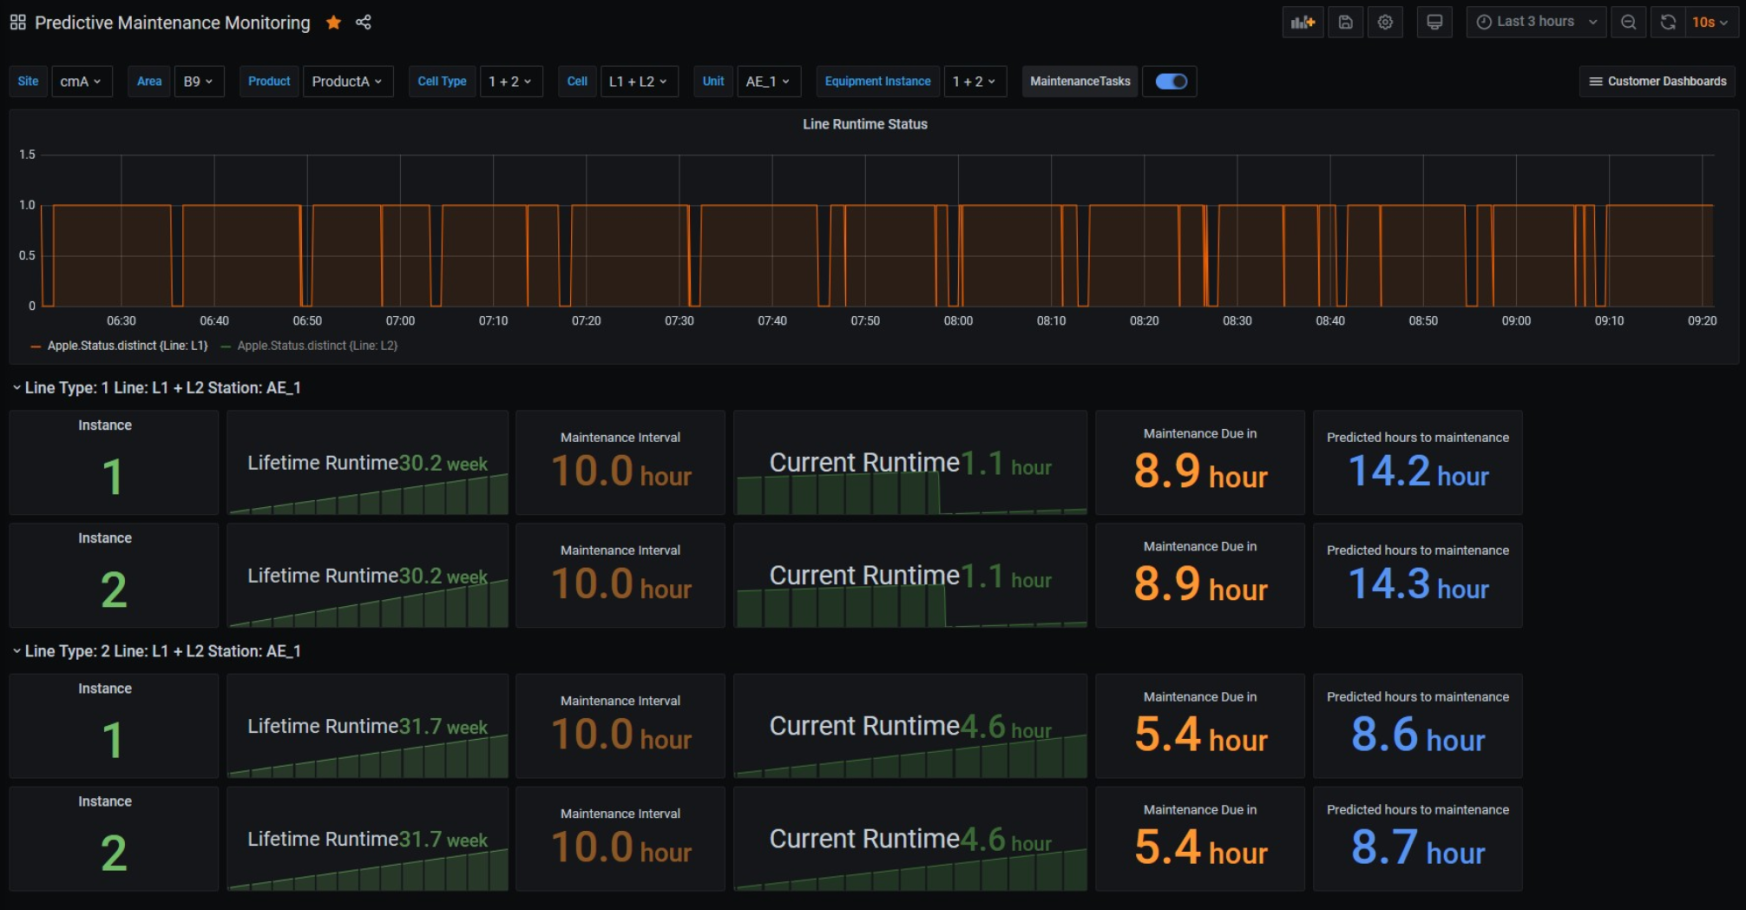
Figure 4. Predictive maintenance monitoring using Grafana
Representations
- At the top of the dashboard, the Line Runtime Status chart plots the runtime of a specific production line over a given period. Here, the line is inactive for about 10 minutes per hour.
- On the two tiles below the Line Runtime Status are the performance and predictive maintenance projections for two build cells on the line. Some of the fundamentals visualized here include:
- Lifetime Runtime, or the amount of time the machine has been running since it was commissioned.
- Maintenance Interval, or the machine builder’s maintenance interval recommendation.
- Current Runtime, or the runtime since the machine’s last service.
- Maintenance Due In, or time until the next recommended service.
- Most important is the Predicted Hours to Maintenance at the end of each tile. This is the optimal recommended maintenance time based on historical runtime and performance, and the condition monitoring obtained directly from the asset.
The DVD for Manufacturing Edge with Litmus solution delivers the statistical analytics functionality that is required to deliver this level of predictive maintenance. This helps manufacturers maximize productivity, improve asset ROI, and make production plans with confidence.
At any time, within the Flows and Analytics capability, maintenance tickets can be raised by the REST API based on specific thresholds being reached within the predictive maintenance calculations. This ensures that the appropriate maintenance and production teams are aware of any manufacturing issues, and that the correct process is followed for a timely resolution.
Product quality
Product quality is evaluating the production process to ensure that manufactured goods meet quality standards. This solution helps speed and automate work-in-process inspection throughout the entire production cycle, leveraging basic computer vision to detect product, parts, or packaging defects to improve safety, decrease liability, and improve final product quality.
Yield optimization
Yield optimization measures the number of parts that are made in manufacturing while minimizing production time, with as little scrap and waste as possible. Understanding OT system data and calculating yield optimization helps manufacturers recognize the opportunities to optimize asset and process elements and continuously seek improvement.
Note: In discrete manufacturing, yield optimization is typically easier to calculate and understand as compared to process manufacturing.
The DVD for Manufacturing Edge with Litmus allows manufacturers to optimize their product yield by:
- Connecting to manufacturing assets, machines, sensors, and systems to understand and maximize performance and quality, and minimize outages.
- Leveraging integrated analytical capabilities to predict and diagnose process failures and interruptions in near real time.
The following example uses an analytical flow similar to that used for OEE within Litmus Edge to illustrate yield performance. Analytics completes the necessary calculations before outputting them to the visualization platform of choice. This dashboard represents yield at a line level within the manufacturing environment over a seven-day period.
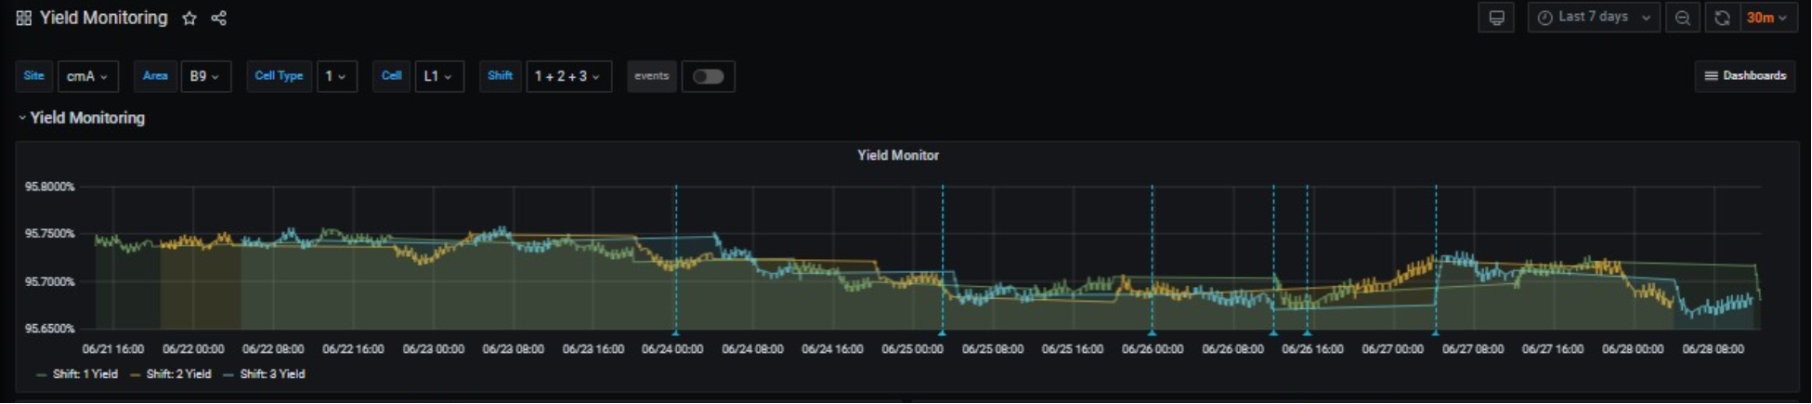
Figure 5. Using Grafana to track yield in manufacturing
Here, the manufacturing operations data is normalized and calculated, and the stream as production output or scrap is reported. Litmus Edge runs the analytics, which are then written out to the Streaming Data Platform.
Representations
- The trending line in the previous figure represents a calculation of yield based on number of good parts that are manufactured out of total parts that are made. Because this trends downward, it is clear there is a production issue.
- The different colors represent varying shift times, and the vertical lines represent annotations or notes that are made within Grafana by production operators or shift personnel, including maintenance teams.
- The vertical lines from left to right represent annotations that have been manually added by operators, production managers, and maintenance personnel for a better understanding of the trends.
The DVD for Manufacturing Edge with Litmus solution builds visualizations to create an understanding of the data coming out of manufacturing operations, and ensures yield optimization based on direct data from manufacturing assets and processes.
Application consolidation
From an IT perspective, deployment of IT solutions and technology into manufacturing operations can result in multiple challenges, including:
- Disparate software solutions and vendors for different use case outcomes and processes
- Multiple hardware vendors and sprawl across varying software solutions
- Technology silos
- Dependencies on IT expertise in manufacturing operations
- Risks related to cybersecurity and lack of operational oversight on IT systems
By deploying DVD for Manufacturing Edge with Litmus solution, these challenges are minimized by the ability to run multiple applications for manufacturing on a single, horizontal edge infrastructure delivering:
- Scale, both out with additional nodes and up with additional compute capacity within VxRail and PowerEdge nodes.
- Security, which is built from the ground up on all Dell infrastructure solutions.
- Flexibility to run applications in bare metal servers, or as virtual machines and containers on PowerEdge and VxRail.
Note: Scale out means adding more VxRail or PowerEdge systems to provide more resources. Scale up means upgrading the existing systems to add more resources, for example, by adding more memory or disks.
This solution ensures that manufacturers standardize their edge infrastructure over time to run multiple applications. It allows for the consolidation of multiple workloads or applications to this singular edge infrastructure, including:
- Computer and machine vision-based solutions
- IoT application enablement platforms such as PTC ThingWorx
- Data platforms and integration solutions, including Dell Streaming Data Platform, which is part of the DVD for Manufacturing Edge with Litmus
- AI and ML applications
- Client-based applications such as VDI or Augmented Reality (AR) applications that are used for connected worker use cases in manufacturing
Note: For technical details of application consolation on the DVD for Manufacturing Edge with Litmus, see the Design Guide document.