CloudIQ: A Detailed Review
Executive summary
CloudIQ overview
Home page
Monitor
Manage
Optimize
Reports
Cybersecurity
Storage System Details
Block Object Details
File Object Details
Storage Group Details (PowerMax/VMAX systems)
PowerStore appliance details
PowerScale node details
PowerScale quota details
Host details
Connectrix and PowerSwitch Details
VxRail hyperconverged infrastructure systems details
Server details
Data protection details
Converged Systems details
VMware Details
Custom Tags
CloudIQ administration
Mobile application
Appendix A: Enabling CloudIQ at the system
Appendix B: CloudIQ security
Appendix C: Data collection frequencies and samples
Appendix D: Report Browser metrics
Appliance details – Performance
Appliance details – Performance
-
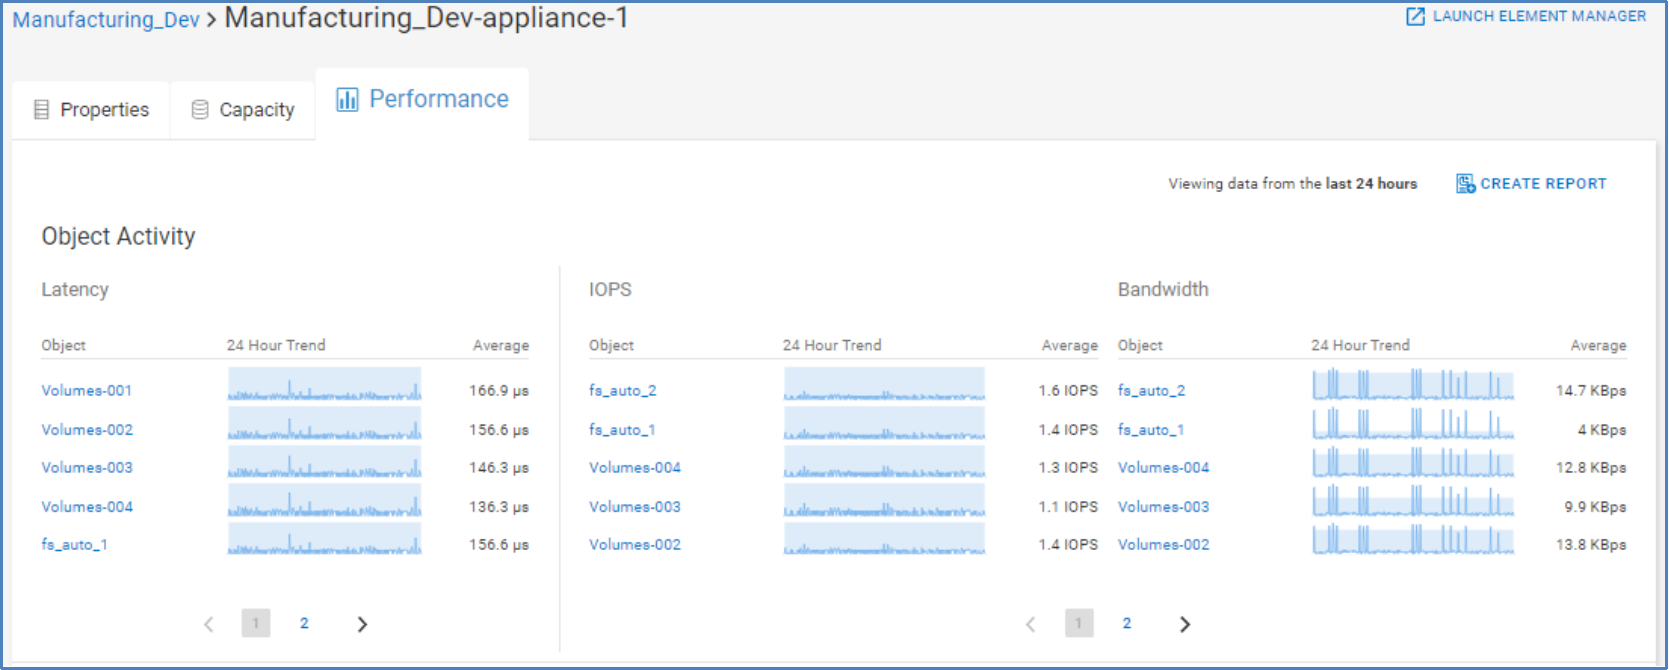
The Performance tab is similar to the performance tab for PowerStore clusters. The top of the page lists top object activity charts for Latency, IOPS, and Bandwidth.
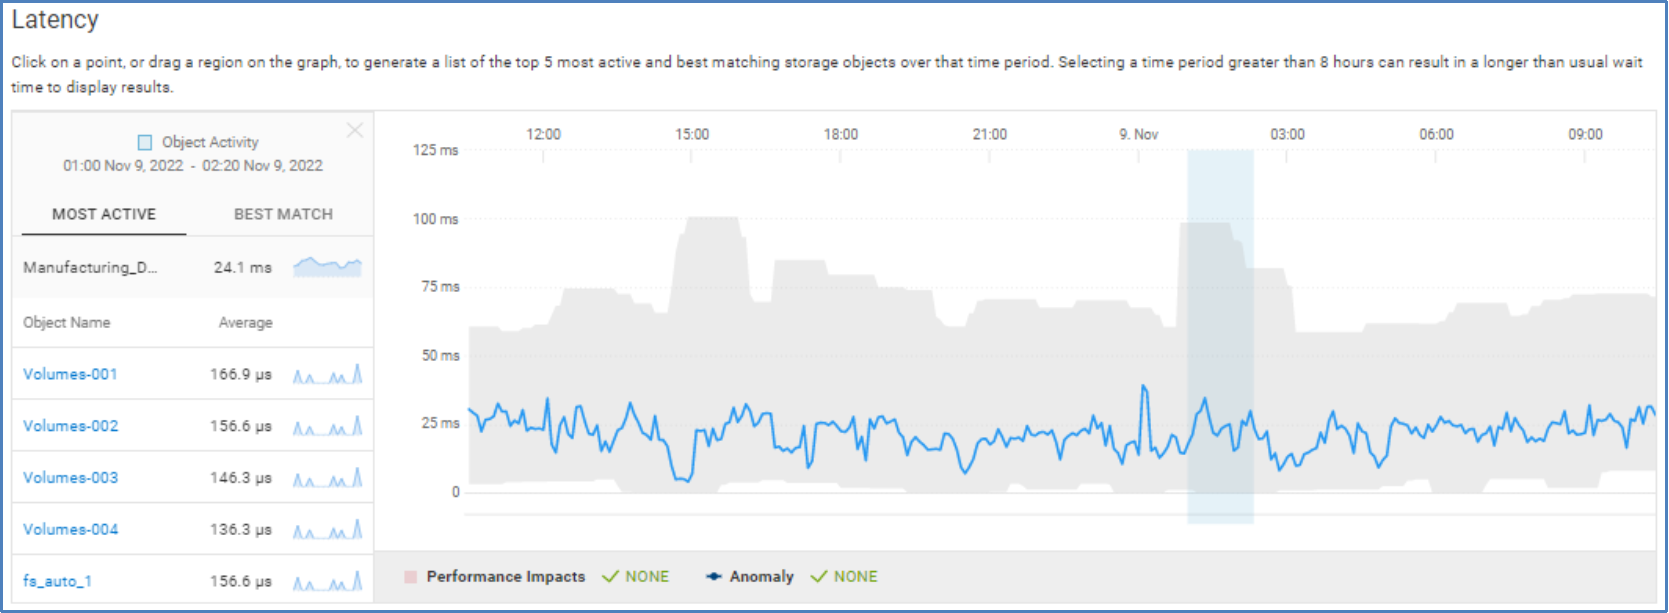
The remaining page displays 24-hour charts for these metrics and supports both performance anomalies and performance impacts. These charts are selectable to provide the top objects during the selected time range. Best match to the performance shape is also supported. An example of the Latency chart is shown below.