Summary of test results
The following table summarizes the host utilization metrics for the different Login VSI workloads that we tested and the user density derived from Login VSI performance testing:
| Server configuration | Login VSI workload | Operating system | User density | Average CPU1 | Average GPU | Average active memory | Average IOPS per user | Average network Mbps per user |
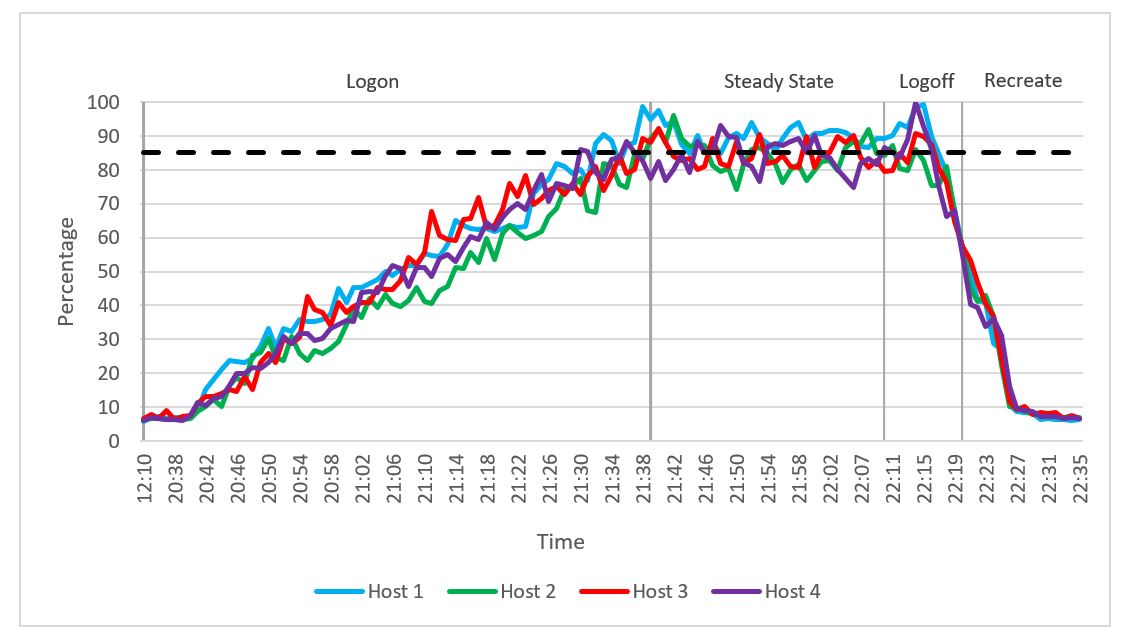
| Density Optimized | Knowledge Worker | Windows 10, 1803 | 130 | 86% | N/A | 140 GB | 15.9 | 1.55 Mbps |
| Density Optimized | Knowledge Worker | Windows 10, 1909 | 125 | 85% | N/A | 134 GB | 7.49 | 1.52 Mbps |
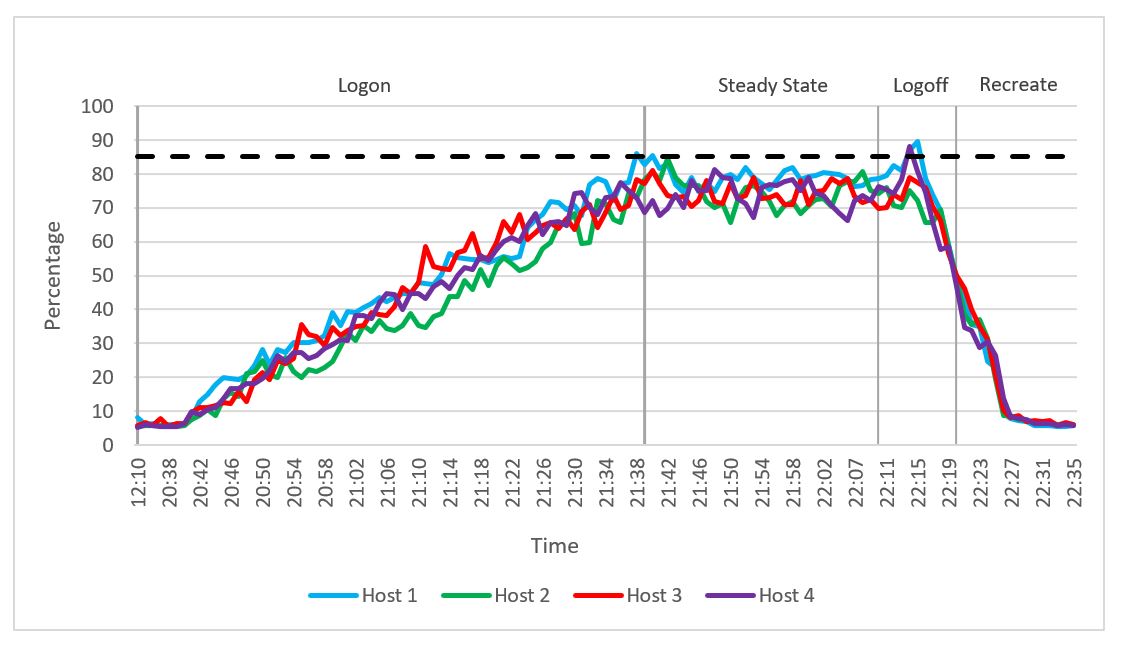
| Density Optimized | Power Worker | Windows 10, 1909 | 100 | 87% | N/A | 154 GB | 8.45 | 2.31 Mbps |
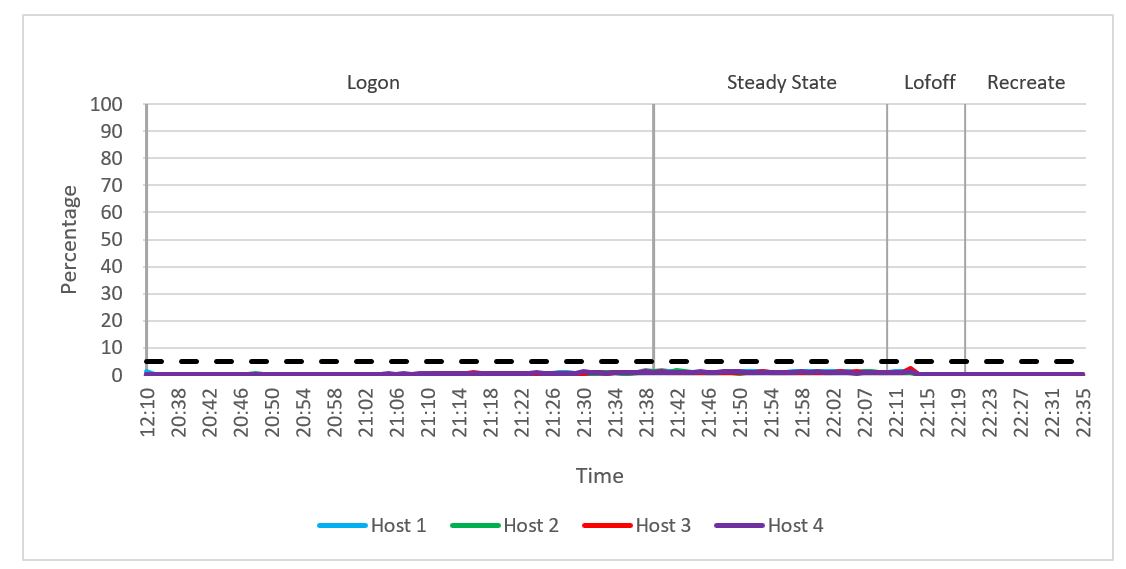
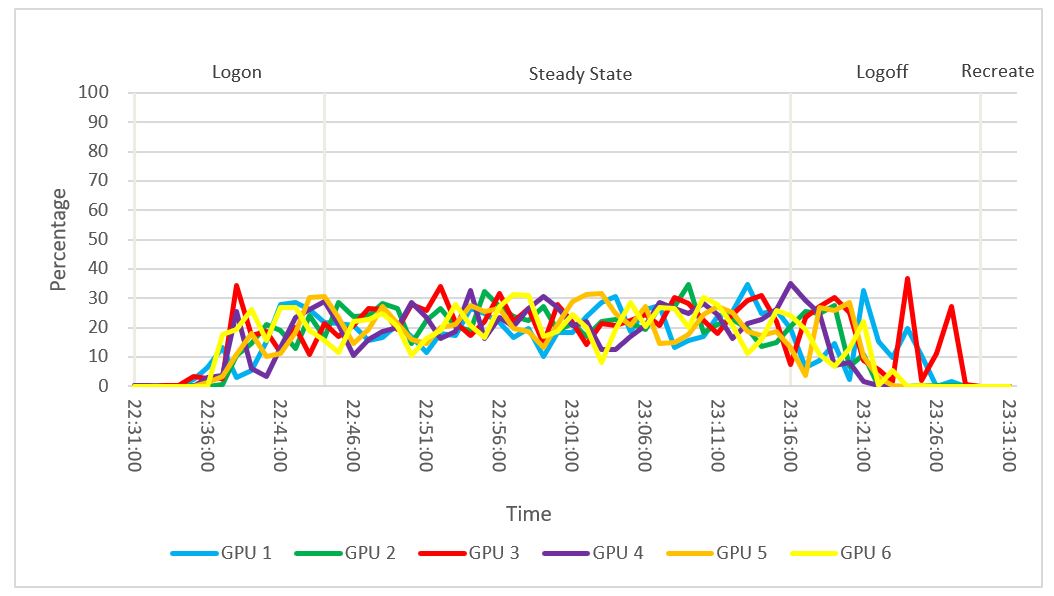
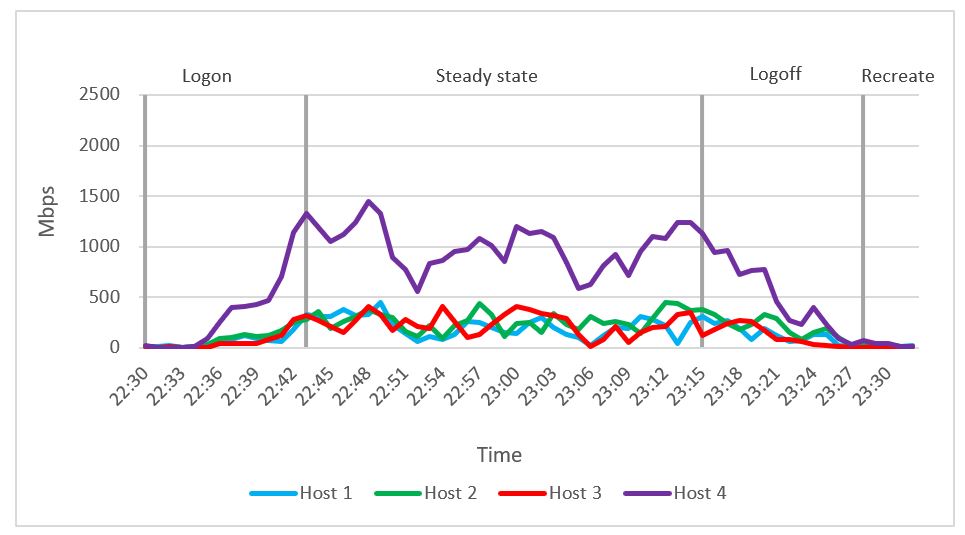
| Density Optimized + 6 x T4 | Multimedia Worker (T4-2B vGPU) | Windows 10, 1909 | 48 | 80% | 22% | 392 GB | 16 | 21 Mbps |
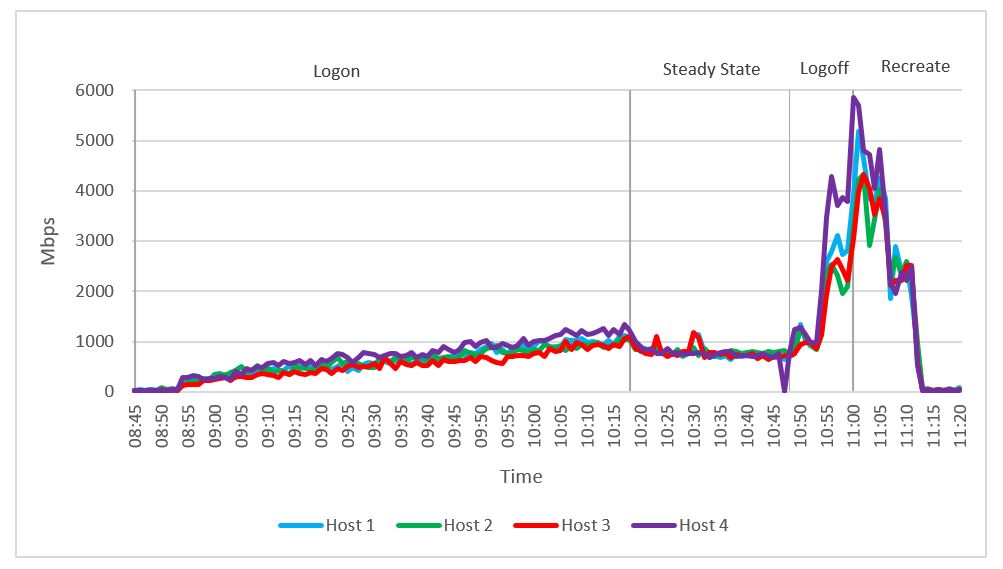
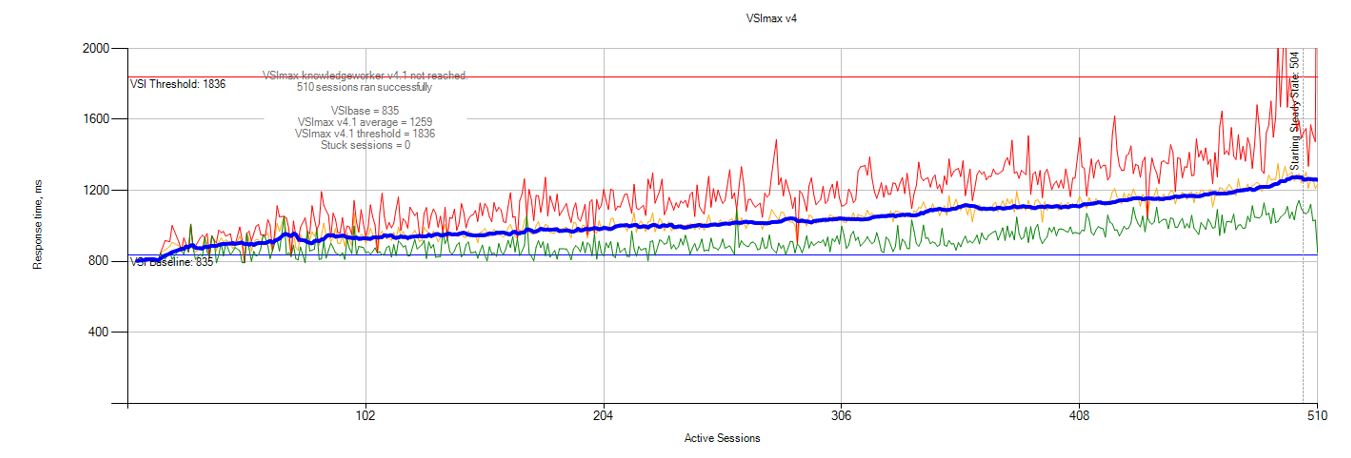
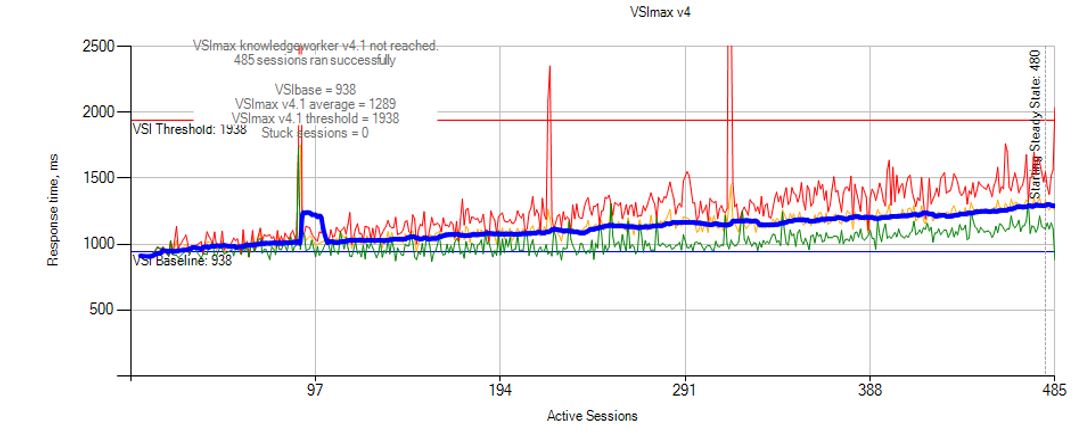
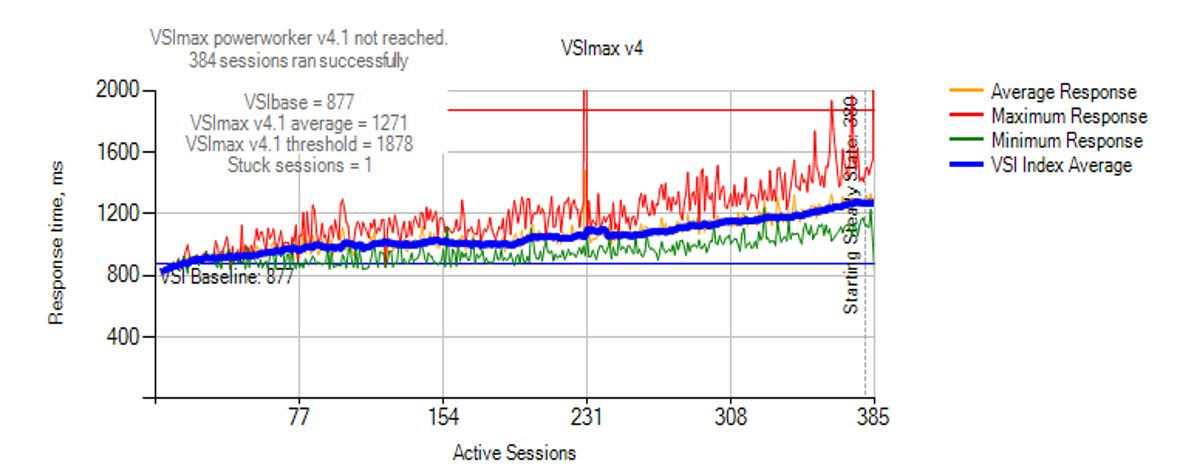
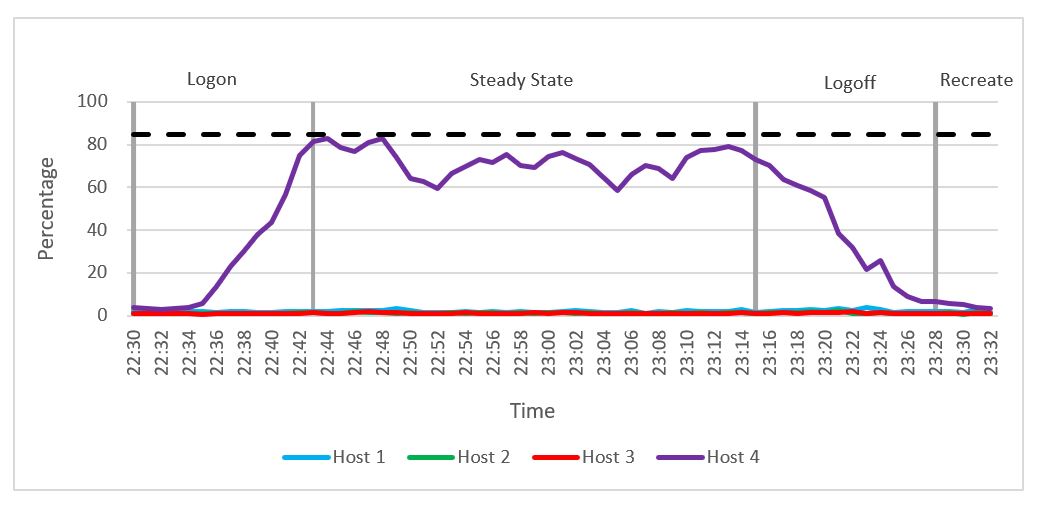
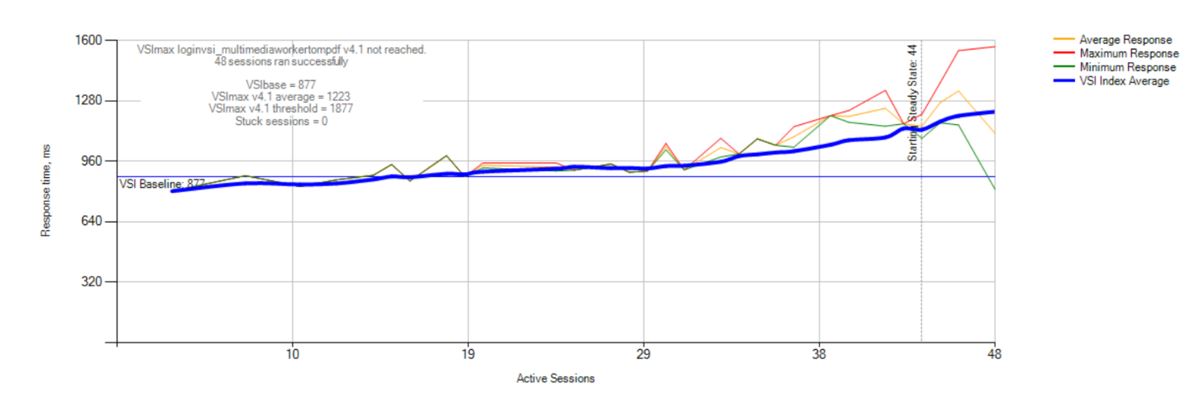
As shown in the table, the CPU was the bottleneck in all the test cases. In all but the Multimedia Worker test, the CPU utilization metric reached the 85 percent (+5 percent margin) threshold that we set for CPU utilization. These threshold values, as shown in Table 4, are carefully selected to deliver an optimal combination of excellent EUE and cost-per user while also providing burst capacity for seasonal or intermittent spikes in usage. We do not load the system beyond these thresholds to reach a Login VSImax (Login VSImax shows the number of sessions that can be active on a system before the system is saturated).
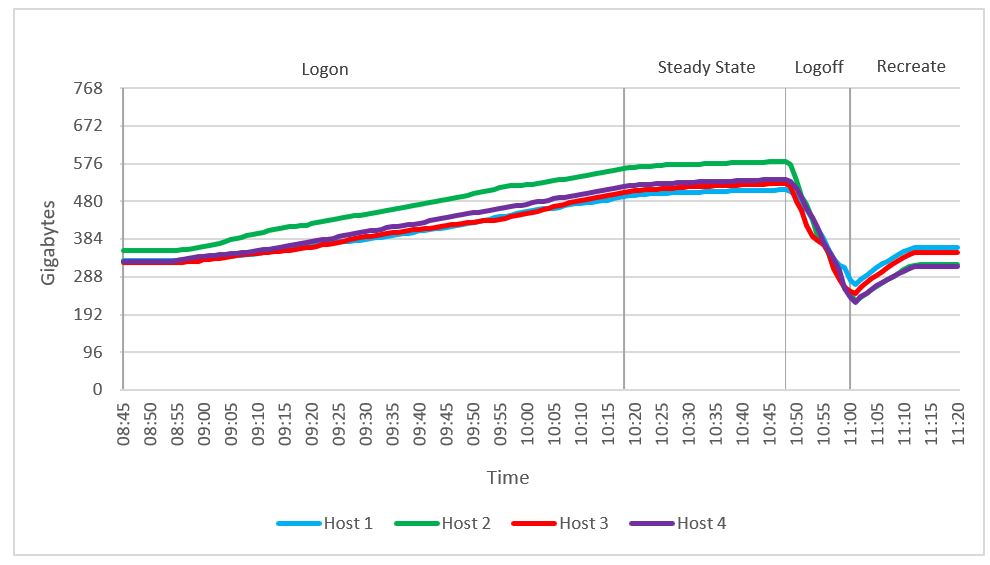
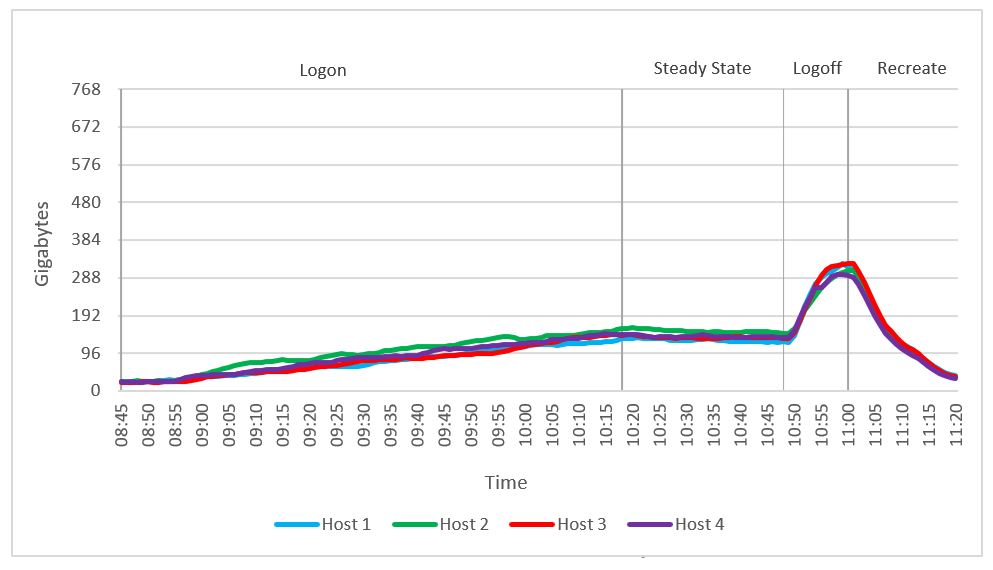
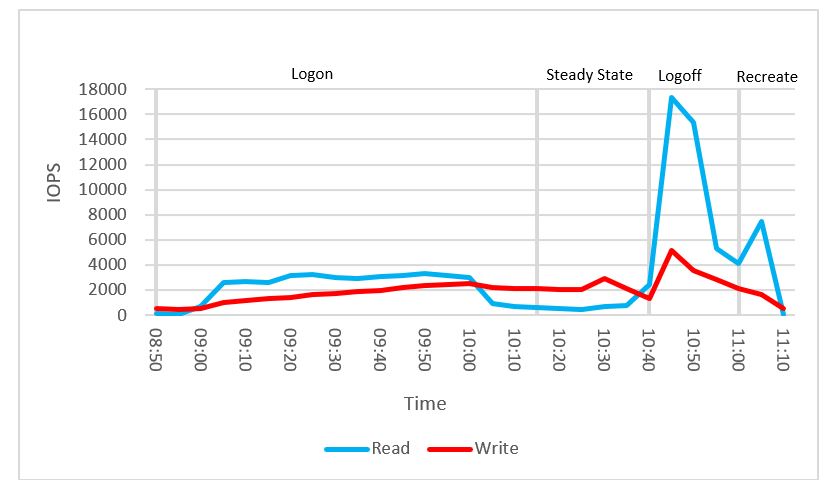
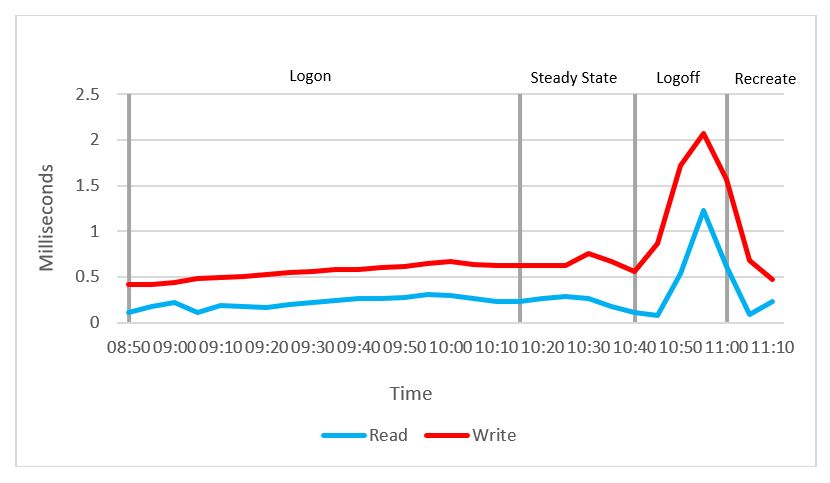
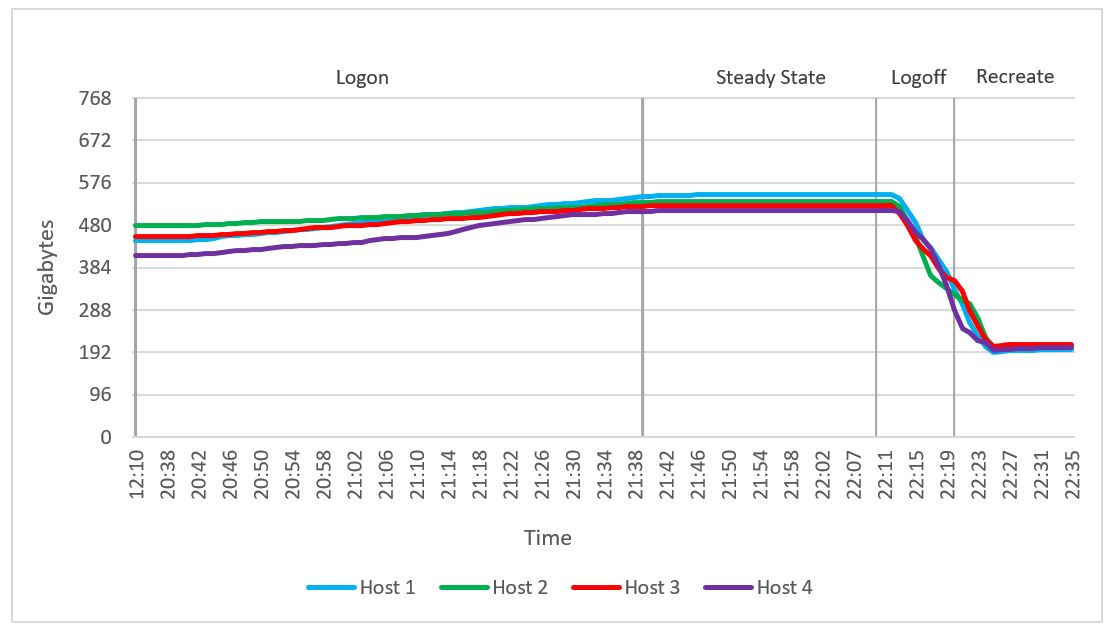
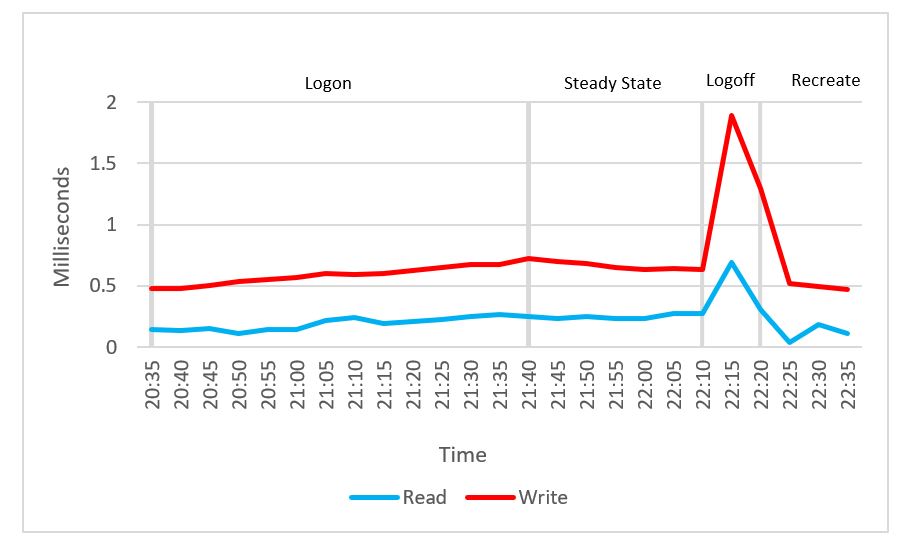
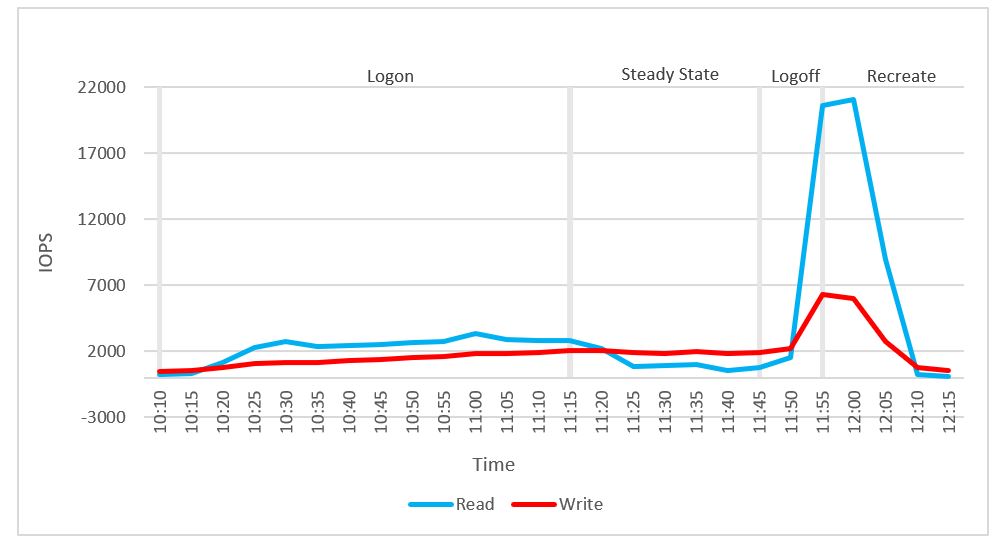
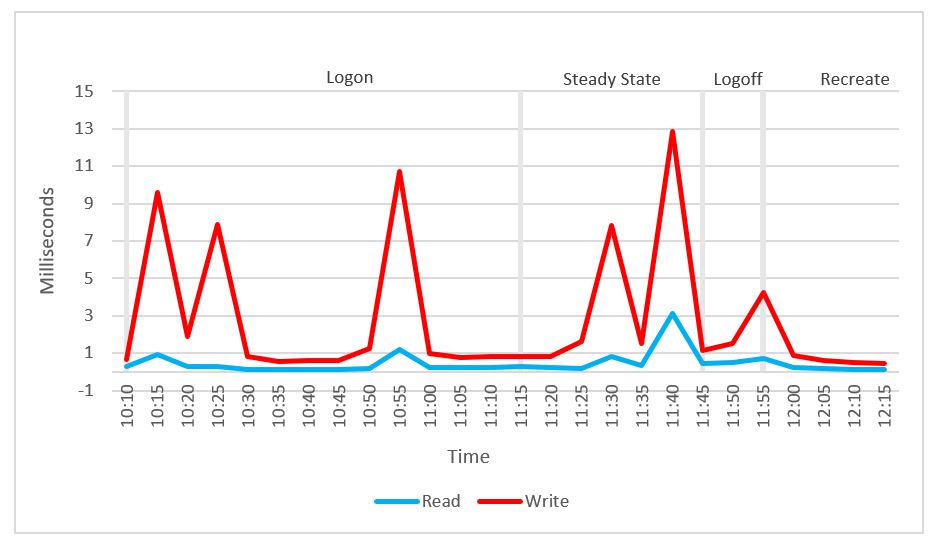
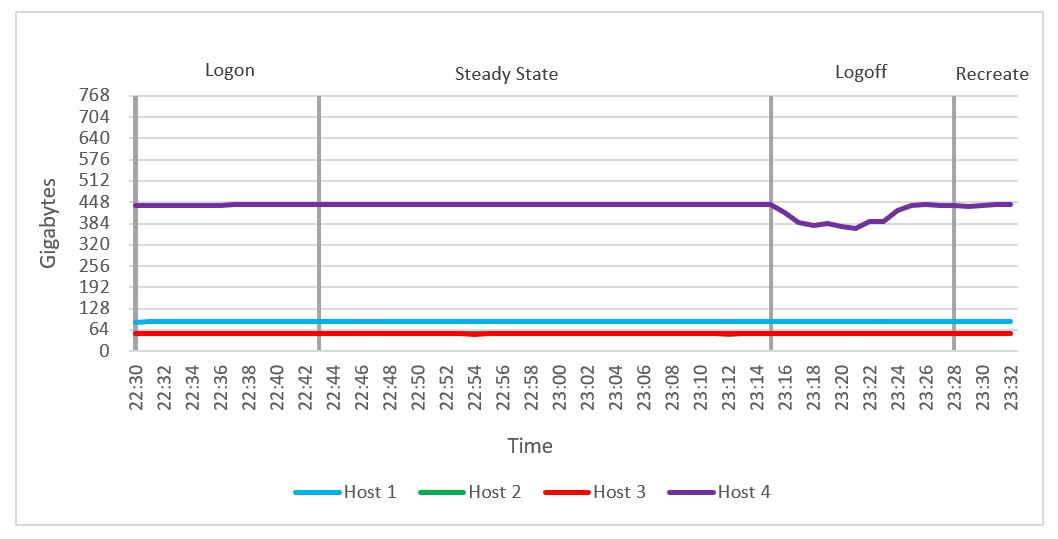
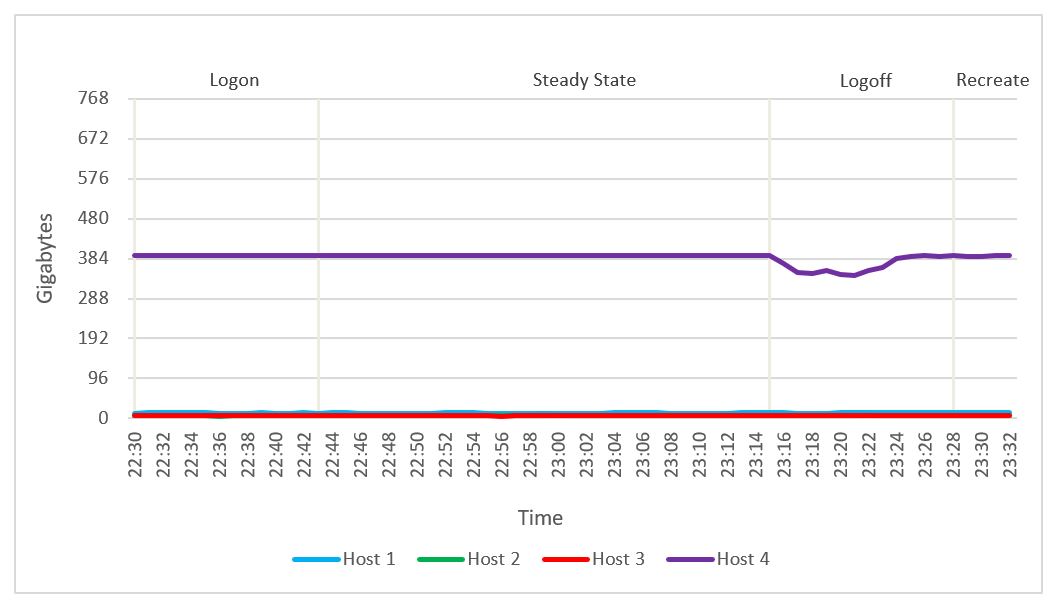
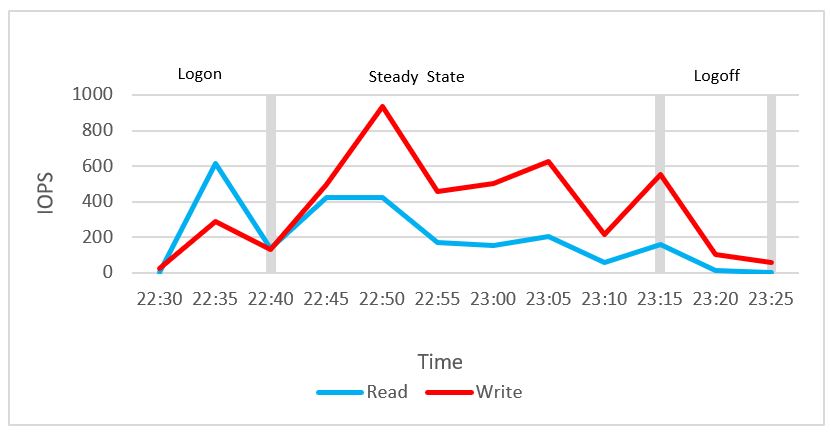
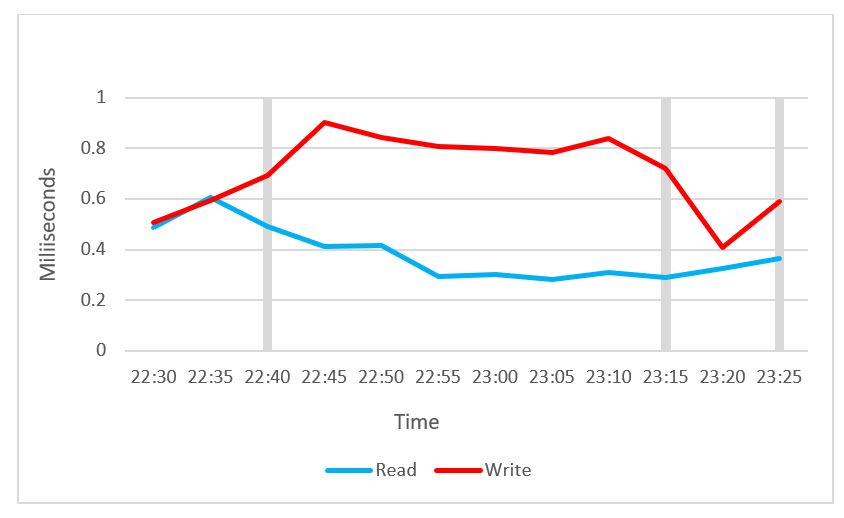
Memory was not a constraint during testing. The total memory of 768 GB was enough for all of the Login VSI workloads to run without any constraints. With a dual-port 25 GbE NIC available on the hosts, network bandwidth was also not an issue. Disk latency was also under the threshold that we set, and disk performance was good.
For the multimedia workload test, the maximum number of users that can be accommodated on the host with each having an NVIDIA T4-2B vGPU profile is 48. The total available frame-buffer on the host with six NVIDIA T4 GPUs configured is 96 GB. The Login VSI scores and host metric results indicate that user experience and performance were good during the running of this graphics-intensive workload.
We have recommended the user densities based on the Login VSI test results and considering the thresholds that we set for host utilization parameters. To maintain good EUE, do not exceed these thresholds. You can load more user sessions and exceed these thresholds, but you might experience a degradation in user experience.
The host utilization metrics mentioned in the table are defined as follows:
- User density—The number of users per compute host that successfully completed the workload test within the acceptable resource limits for the host. For clusters, this number reflects the average of the density achieved for all compute hosts in the cluster.
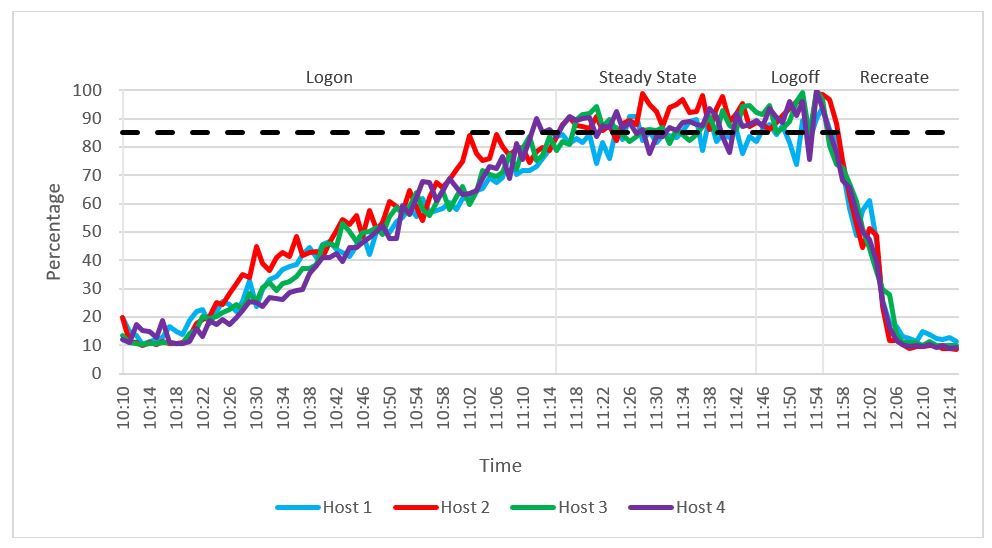
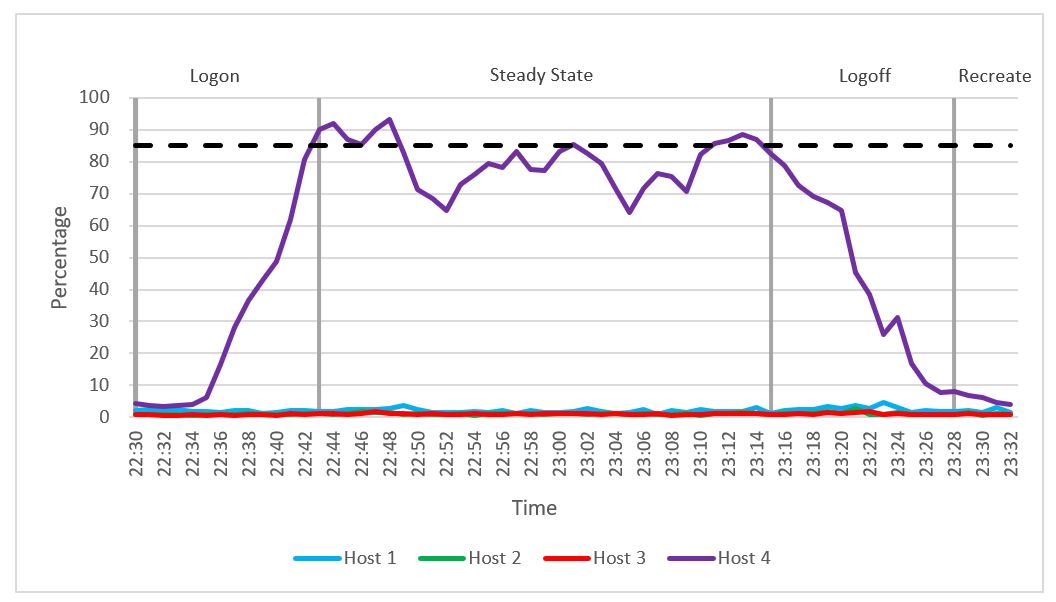
- Average CPU—The average CPU usage over the steady state period. For clusters, this number represents the combined average CPU usage of all compute hosts. On the latest Intel processors, the ESXi host CPU metrics exceed the rated 100 percent for the host if Turbo Boost is enabled, which is the default setting. An additional 35 percent of CPU is available from the Turbo Boost feature, but this additional CPU headroom is not reflected in the VMware vSphere metrics where the performance data is gathered.
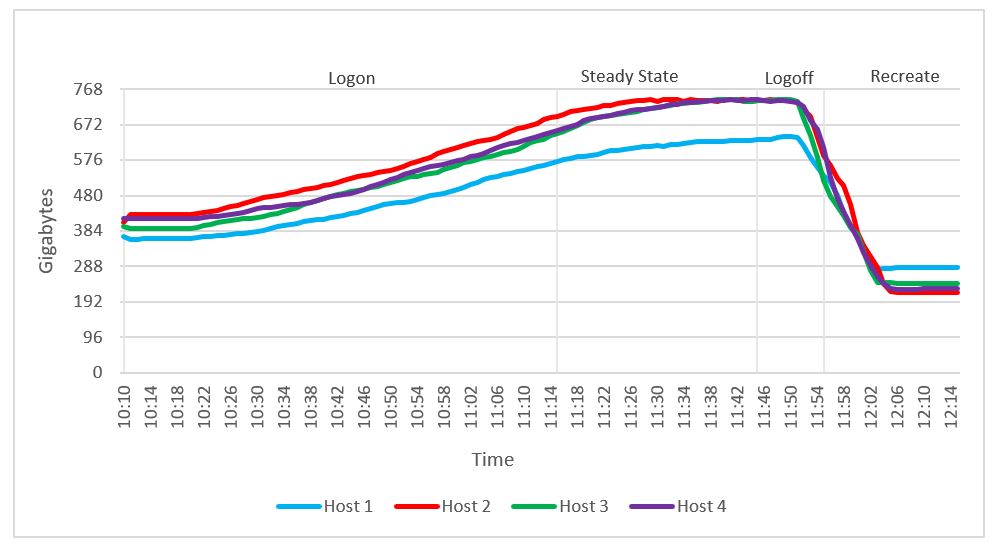
- Average active memory—For ESXi hosts, the amount of memory that is actively used, as estimated by the VMKernel based on recently touched memory pages. For clusters, this is the average amount of physical guest memory that is actively used across all compute hosts over the steady state period.
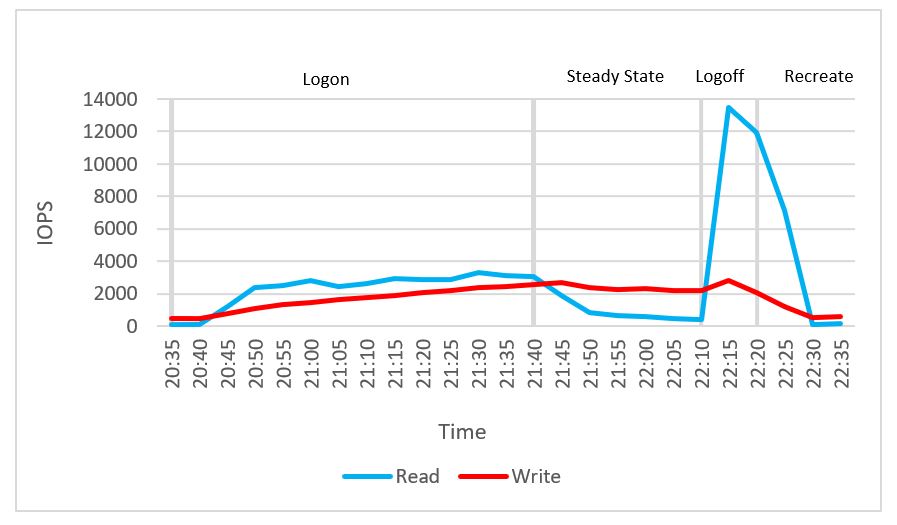
- Average IOPS per user—IOPS calculated from the average cluster disk IOPS over the steady state period divided by the number of users.
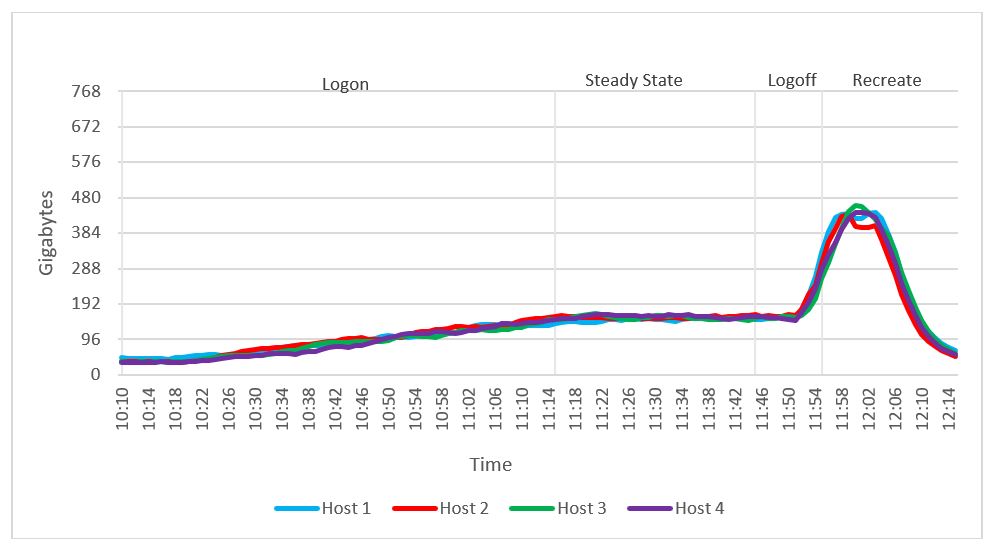
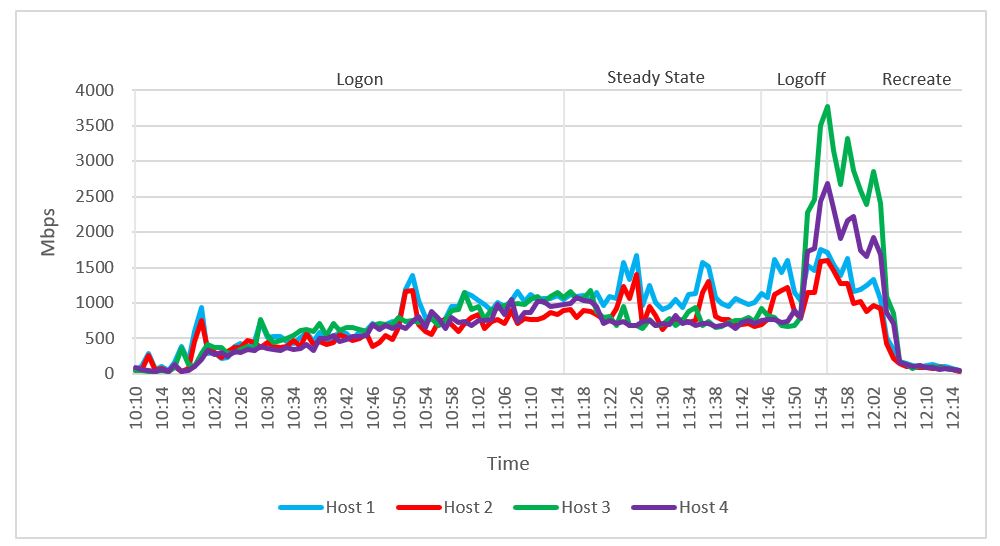
- Average network usage per user—Average network usage on all hosts calculated over the steady state period divided by the number of users.