
OAS data sources and visualization
OAS data sources and visualization
-
Organizations are currently flooded with information from various data sources and of multiple data types. These data sources can include on-premises or cloud applications. Sorting through this information to find what matters most to the business is a challenge. Visuals can make data analysis faster, easier, and provides stakeholders with critical information to make sound and speedy business decisions.
At the front-end, Oracle Analytics Server’s primary function is to provide powerful visualization tools for data preparation, visualization, enterprise reporting, and augmented analysis. Users should be aware of all the various types of data sources and data types that OAS supports and can connect to, to perform these visualizations and analysis when setting up and using OAS.
OAS supports many types of data sources including as Oracle Database, Oracle TimesTen, Apache Spark SQL, Impala, Google Analytics, Microsoft SQL Server, MongoDB, MySQL, etc. Complete list of supported data sources can be found here. Users can create a connection to one or more data sources, once connected users can visualize and analyze the source data either individually or by combining data from two or more data sources. If a user is using multiple data sources in the analysis, at least one match column must exist in each source.
A client query traverses the different layers of the OAS architecture once a connection is established between one or more OAS servers and one or more data sources. The request begins when the client issues the logical SQL query in the visualization tool based on the data read from the external data sources. The OAS components in the OAS/BI servers process these user requests and queries and use the metadata in the BI Repository (located in the backend Oracle database) to interpret the logical SQL queries. Using this metadata, OAS can write corresponding physical queries, transform and combine the physical results sets, perform final calculations, and more. This visualization, business, and analyses modeling occur through the three different layers in the BI repository as shown in Figure 3. As a result, the backend database (tier) that stores the metadata in the BI Repository drives most of the OAS visualization modeling and analyses performance.
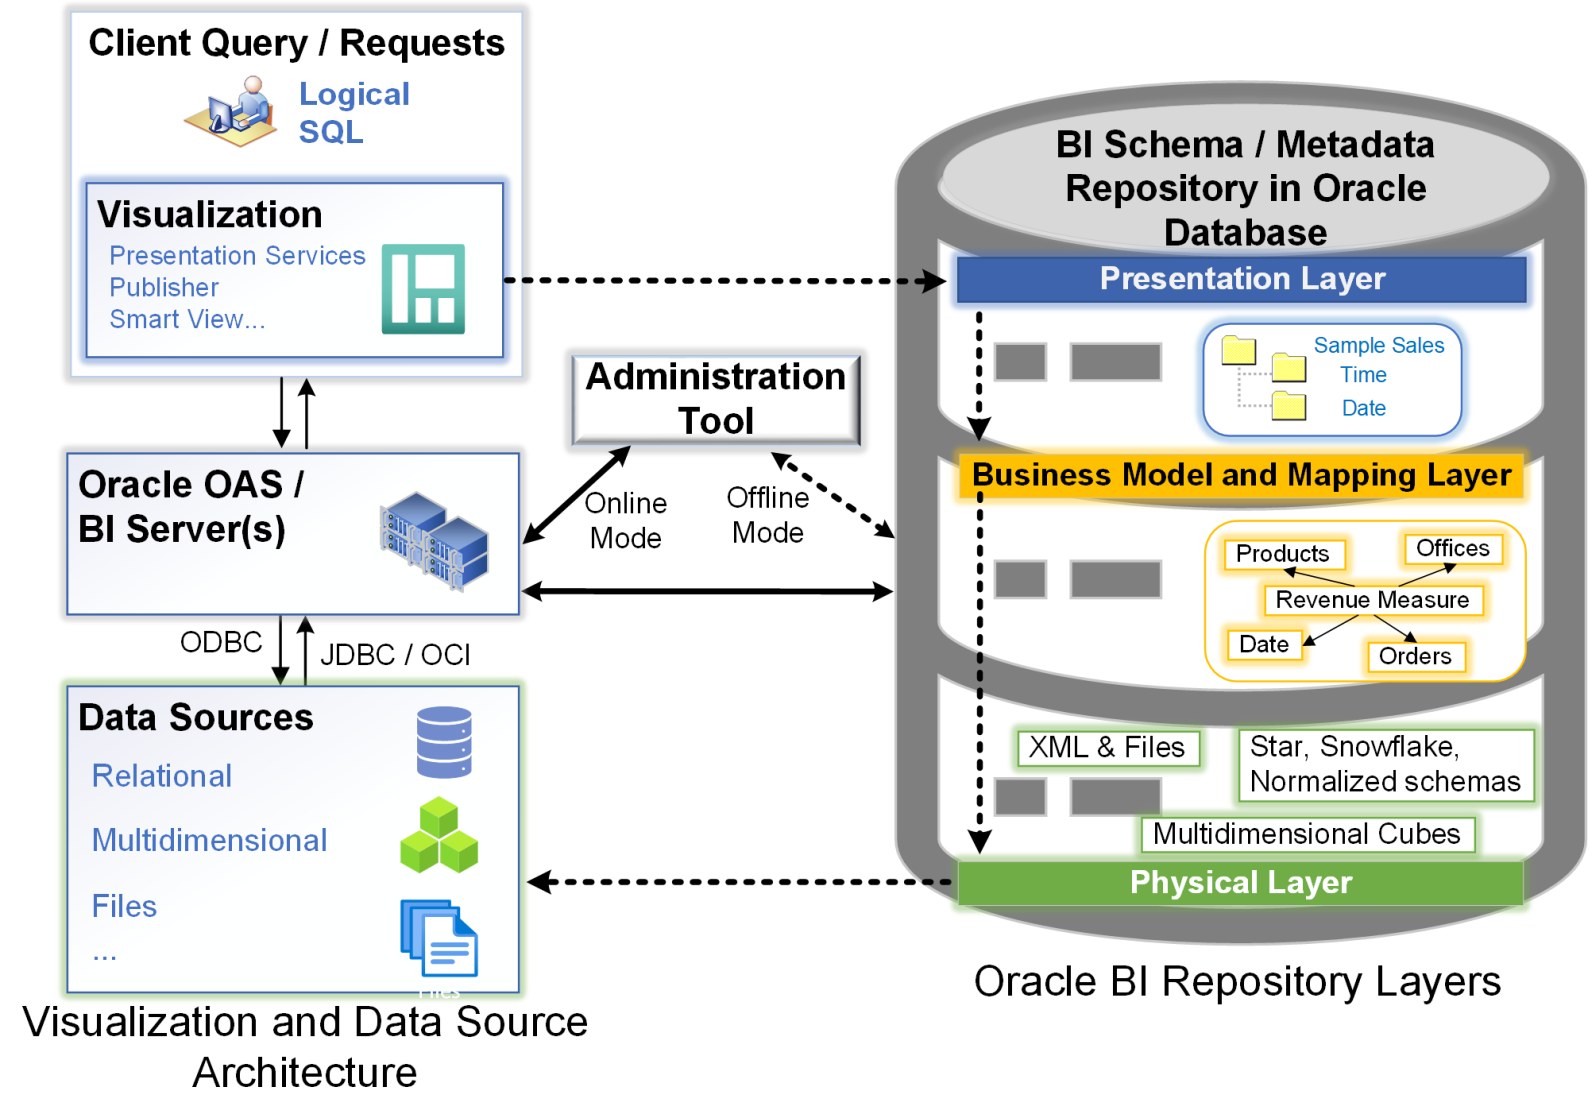
Figure 3. OAS visualization and data source metadata repositories architecture
OAS supports various number, date, and string of data types. OAS attempts to map the incoming data types with these supported data types when it reads a data source. If OAS cannot automatically convert a source data type, then the user can manually convert the data column to a supported data type by entering SQL commands. OAS notifies the user of an error if the data source contains unsupported data types. For a complete list of supported data types, see Support Data Types by Database.