
Use cases, test methods, and test results
Use cases, test methods, and test results
-
The following use cases for Oracle Database 18cR1, which mirror our 12cR2 use cases, demonstrate the performance and capacity savings of Oracle Database 18cR1 running on the Unity 650F storage array, as well as the performance impact of creating Unity snapshots of Oracle Database 18cR1:
- Use case 1: Deduplication and compression of Oracle Database 18cR1
- Use case 2: Oracle Database 18cR1 baseline performance
- Use case 3: Unity storage snapshot-creation impact on Oracle Database 18cR1 performance
- Use case 4: Deduplication and compression of Oracle Database 18cR1 with data changes
To establish the comparison with the 12cR2 database, we used the same test methods and test configuration and ensured that the 18cR1 database contained the same data as the 12cR2 database.
Use Case 1: Deduplication and compression of Oracle Database 18cR1
To establish the comparison of the deduplication and compression (data reduction) savings between the 12c database and the 18c database, we reloaded the 1.2 TB of test data that was used for Test 1 of the 12c database, as described in Chapter 3. We observed that the size of the database was 1,223 GB, as shown in the following figure. We inserted 100 percent randomized and unique data (generated by the PL/SQL program) stored in 128 SLOB schemas. These schemas are initially created by a SLOB data load and then the data from those schemas is truncated and repopulated with randomized data. As shown in the following figure, we achieved a data reduction rate of 29.75 percent.
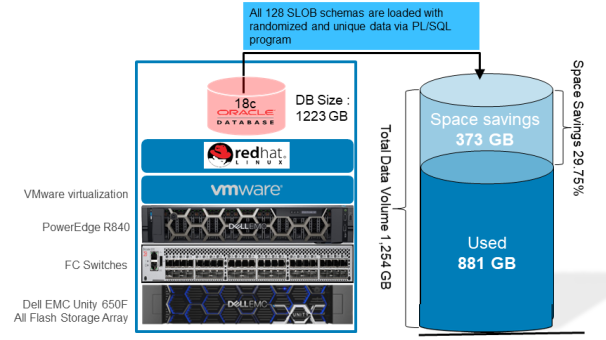
Figure 19. Data reduction in 18c database
When we compare the space savings of Oracle Database 12cR2 with Oracle Database 18cR1, we observe a slight improvement, as shown in the following figure.
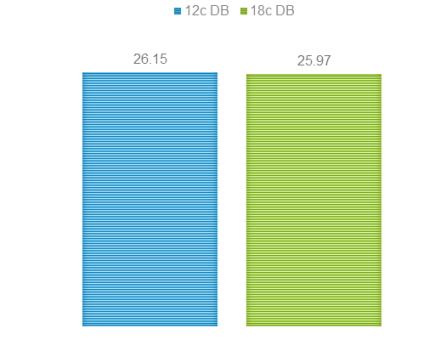
Figure 20. Data reduction observed between 12c and 18c databases for Use Case 1
Use case 2: Oracle Database 18cR1 baseline performance
In Use Case 2, we ran the performance test for 30 minutes using SLOB to generate an OLTP workload with an 80/20 read/write mixture on the PowerEdge R840 server, as shown in the following figure. We used the same database configuration for the 18cR1 database as we used for the 12cR2 database.
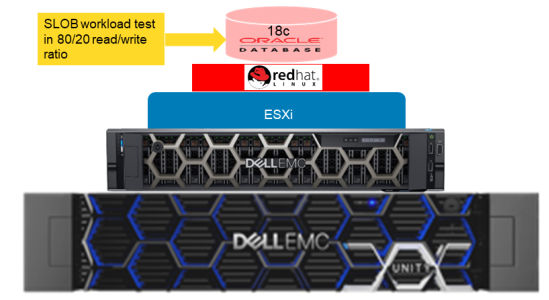
Figure 21. Performance testing on 18cR1 database running on Unity 650F (Test 1)
For database and SLOB parameter settings that were used during all test cases, see Appendix A. During the stress test, we collected performance data from the AWR report generated by the Oracle database. The following table shows the performance metrics that we captured from AWR for Test 1. We used these values as the baseline numbers for comparison with Test 2 and Test 3 in Use Case 3.
Table 7. Test 1 performance results
Performance metric
Value
IOPS
104,067
Database server CPU utilization (%)
26
Database bandwidth (MB/s)
823
Database response time (milliseconds)
0.31
Transactions per second (TPS)
7,023
The performance metrics in Table 7 show that the IOPS value was over 100,000 with an average database server CPU utilization of 26 percent and a database response time of 0.31 milliseconds (ms). The database server had plenty of capacity for performing other tasks while running this Oracle 18c database.
The database bandwidth was healthy (823 MB/s) and the response time for queries was quite fast at 0.31 ms. Also, the database performed 7,023 TPS, which means that the commits and rollbacks were happening very quickly. We use the Test 1 results as a baseline to later compare these results to those that we obtained while creating snapshots in Use Case 3.
Use case 3: Unity storage snapshot-creation impact on Oracle Database 18cR1 performance
The goal of Use Case 3 is to study the performance impact of creating Unity snapshots on the Oracle 18cR1 OLTP database. This use case involves two tests—Test 2 and Test 3:
- In Test 2, we performed a 30-minute stress test using SLOB and, at the same time, created snapshots to measure performance impact, similar to the testing in Use Case 2.
- In Test 3, we created two snapshots and then performed SLOB stress testing to observe and understand the resulting change in performance numbers.
Note: Before taking the snapshots, we created a consistency group on the Unity storage array and added all Oracle database volumes to it. Dell EMC recommends taking snapshots of database volumes at the consistency group level rather than at the individual database-volume level to guarantee that the Oracle database snapshots can mount and restart successfully on the database host.
The following figures show the methodology for Test 2 and Test 3.
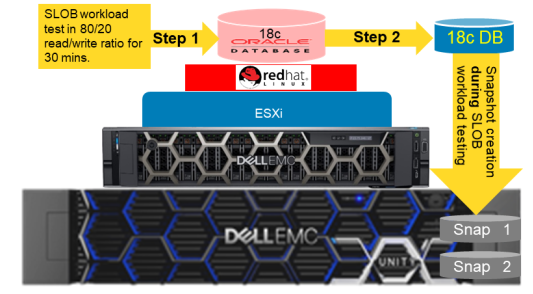
Figure 22. Test 2 methodology
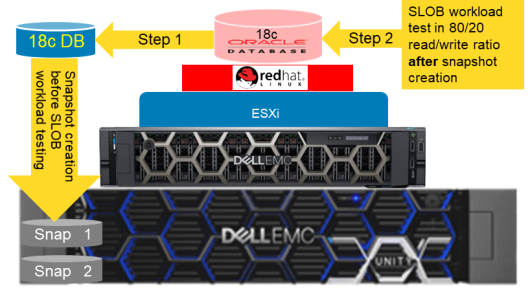
Figure 23. Test 3 methodology
As shown in Figure 24, with the snapshots created in Test 2 and Test 3 including the SLOB stress testing in Test 3, the IOPS dropped less than 0.7 percent in comparison to Test 1 (the baseline test). The IOPS numbers from these three tests prove that, despite requiring more system resources like drive I/O to handle metadata writes, this reference architecture generates impressive IOPS numbers.
Tests 2 and 3 let us study the performance impact after running stress testing on an Oracle Database 18cR1 with or without snapshots by comparing the following benchmark parameters:
- IOPS
- TPS
- Database server CPU utilization (%)
- DB bandwidth
- DB response time
IOPS results
The following figure shows the comparison of IOPS among Test 1 (Use Case 2) and Tests 2 and 3 (Use Case 3) on Oracle Database 18cR1.
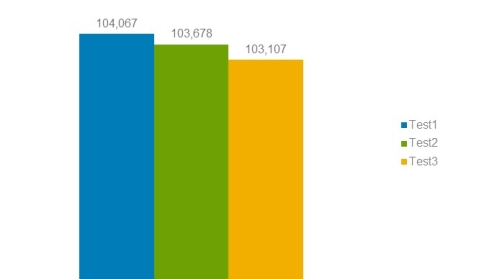
Figure 24. Total IOPS numbers for Test 1, Test 2, and Test 3
As shown in Figure 24, with the snapshots created in Test 2 and Test 3, including the SLOB stress testing in Test 3, the IOPS dropped less than 1 percent in comparison to Test 1 (the baseline test). The IOPS numbers from these three tests prove that, despite requiring more system resources like drive I/O to handle metadata writes, this reference architecture generates impressive IOPS numbers.
The following figure compares the number of IOPS generated by the 12c and 18c databases during the three tests.
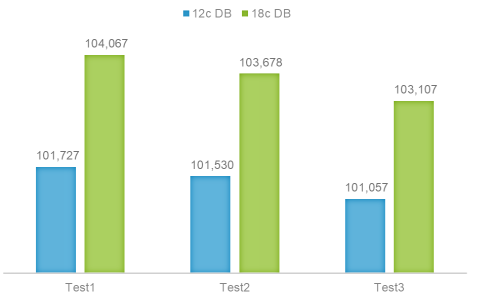
Figure 25. Comparative analysis of total IOPS numbers for Test 1, Test 2, and Test 3
As shown in Figure 25, all three tests generated slightly more IOPS with the 18c database than with the 12c database. In Tests 2 and 3, despite snapshots being created during stress testing (Test 2) and before stress testing (Test 3), the reduction in the number of IOPS is minimal. Also, the IOPS numbers achieved by the 18c database are consistently higher than those of the 12c database.
Database server CPU utilization results
The following figure shows the database server CPU utilization as captured by the AWR report for Tests 1, 2, and 3.
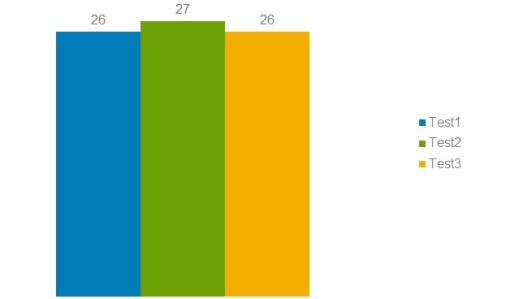
Figure 26. Database server CPU utilization (%) comparison for Tests 1, 2, and 3
Creating two snapshots in Test 2 caused database server CPU utilization to increase very little in Test 2 and Test 3. In Test 3, which included stress testing with the SLOB tool after creation of snapshots, CPU utilization actually decreased by 1 percent in comparison to Test 2. Tests 2 and 3 prove that snapshot creation and stress testing have very little impact on the Oracle Database 18cR1 server running on the Unity 650F storage array.
Any data written to either the baseline database or to the snapshot database is redirected to a new write location in the same storage pool. The Unity storage array uses metadata to track data blocks that belong to the base objects, and all snapshots consume more storage system resources such as CPU and memory to handle metadata updates. Even considering the metadata updates, there was no significant increase in the database server CPU utilization percentage. Therefore, there is no significant performance impact on Test 2 and Test 3 in comparison to Test 1 (the baseline test).
Comparing database server CPU utilization during the tests running on the Oracle 12c database with those on the 18cR1 database, we find that database server CPU utilization decreases with the 18cR1 database, as shown in the following figure.
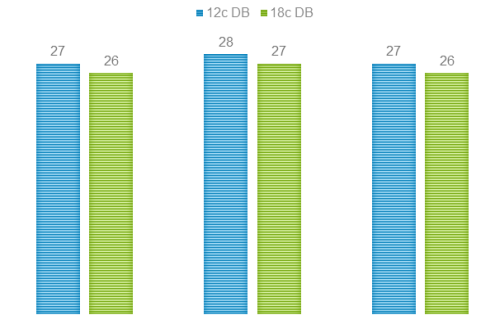
Figure 27. Comparative analysis of database server CPU utilization (%) during Test 1, Test 2 and Test 3
This leaves plenty of unused CPU resources available for other activities.
Database bandwidth results
The following figure compares database bandwidth in terms of MB/s for Oracle Database 18cR1 for Tests 1, 2, and 3.
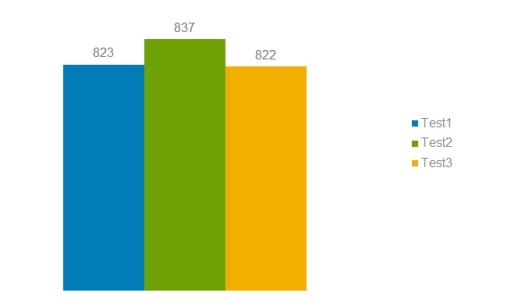
Figure 28. Comparative analysis of DB bandwidth during Test 1, Test 2, and Test 3
Figure 28 demonstrates that creating two snapshots and performing OLTP operations such as SLOB data loading do not adversely affect the bandwidth, so there is no impact on the performance of the Oracle Database 18cR1 running on the Unity 650F storage array. On the contrary, the database performance (bandwidth) increases by about 2 percent as more workloads are applied along with the creation of snapshots during Test 2.
The following figure compares the bandwidth results for the Oracle 12cR2 and 18cR1 databases during the three tests.
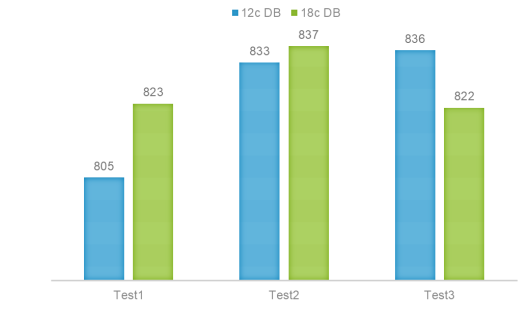
Figure 29. Comparative analysis of database bandwidth during Test 1, Test 2, and Test 3
As shown, the bandwidth numbers that were recorded during 12c and 18c database testing remained the same or improved slightly despite snapshots being created during stress testing (Test 2) and before stress testing (Test 3) compared with the benchmarking test (Test 1).
Database response time results
The following figure shows database performance (response time) as measured in Tests 1, 2, and 3. As shown, the database maintained the same response level during the creation of snapshots during stress testing (Test 2) and before the stress testing (Test 3) when compared with the baseline number (Test 1). Creating snapshots and doing stress testing did not significantly impact the database response time and had no impact on the latency performance of Oracle Database 18cR1 running on the Unity 650F storage array.
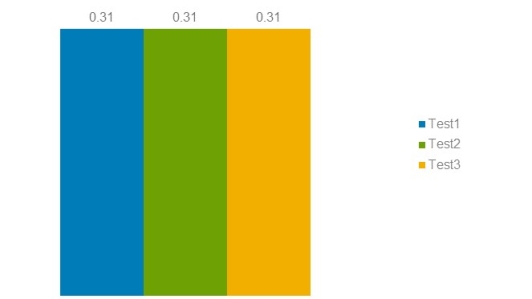
Figure 30. Database response time during Test 1, Test 2, and Test 3
The following figure compares the 12cR2 and 18cR1 database response times during our testing.
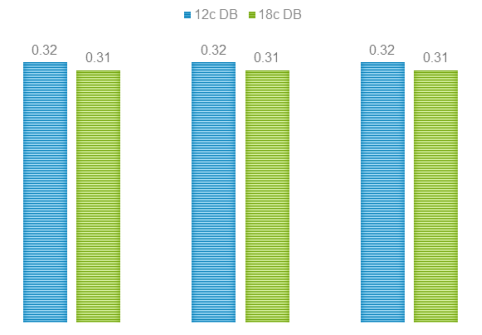
Figure 31. Comparative analysis of database response time during Test 1, Test 2, and Test 3
As shown in Figure 31, the database response time during testing of the 12c and 18c databases remained nearly the same despite snapshots being created during stress testing (Test 2) and before stress testing (Test 3) compared with the benchmarking test (Test 1).
Transactions per second results
The following figure shows the transaction throughput that was achieved in Tests 1, 2, and 3 during the testing of the Oracle Database 18c. The figure shows a minimal drop in TPS of less than 1 percent in Test 2 and Test 3 compared with the baseline number from Test 1.
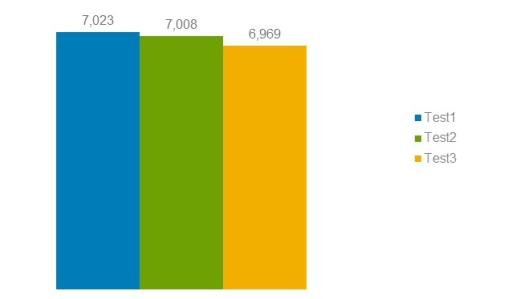
Figure 32. TPS during Test 1, Test 2, and Test 3
The following figure compares the 12c and 18c database TPS results.
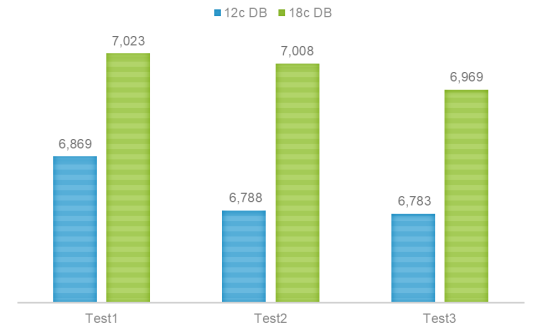
Figure 33. Comparative analysis of TPS during Test 1, Test 2, and Test 3
A comparison of the 12c and 18c database test results shows a minimal reduction of 2 percent TPS from the creation of two snapshots. Thus, we can conclude that Oracle 12c and 18c databases running on this reference architecture maintain stable transaction throughput.
The performance metrics from Tests 1, 2, and 3 show that there was minimal impact from creating snapshots and applying stress testing, and there was no performance impact when running an Oracle Database 18cR1 on the Unity 650F storage array. This capability of minimizing impact on the server performance is helpful when you have to create multiple copies of the production database for nonproduction purposes.
Use case 4: Deduplication and compression of Oracle Database 18cR1 with data changes
Test methodology
To further determine the storage capacity savings that is realized through the use of the deduplication and compression feature of the Unity 650F storage array during a data change, we increased the data that was loaded during Use Case 1 by 5 percent and captured the savings in storage capacity. The following diagram shows the comparison of storage capacity before and after the 5 percent data increase.
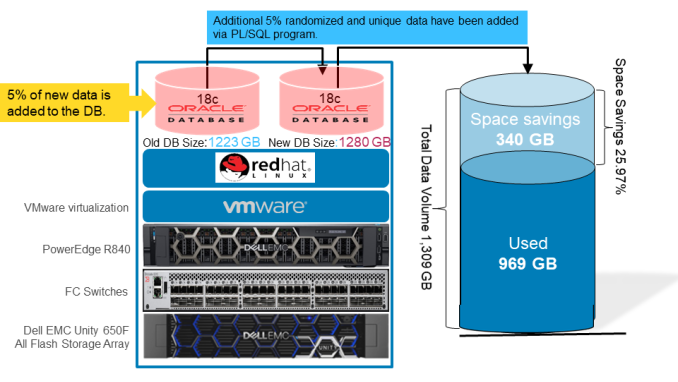
Figure 34. Data reduction achieved in 18c database after 5% data insertion
The figure above shows that Unity’s data reduction capabilities yield a space savings of 25.97 percent inside the Unity storage array after adding five percent new data. This space savings helps the customer to consolidate their data which reduces the cost of storage and the total cost of ownership. (TCO).
Test Results
We performed the testing in Use Case 4 to find the data reduction percentage after inserting data in six new SLOB schemas with 100% randomized and unique data generated by a PL/SQL program. After loading the data in six new schemas, we achieved a space savings of 25.97 percent, as shown in Figure 34. We achieved similar savings by running the same tests on an Oracle Database 12c.
The following figure compares the data compression rates that were achieved during our testing with the 12cR2 and 18cR1 databases.
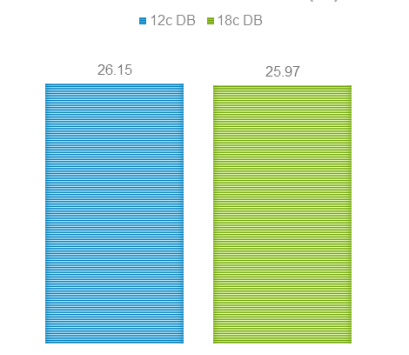
Figure 35. Comparative analysis of data reduction (%) for Use Case 4 between 12c and 18c databases
Figure 35 shows that the data reduction percentage between Oracle Database 12cR2 and 18cR1 on the Unity 650F storage array is quite similar.
Conclusion
The tests described in Chapters 3 and 4 prove that Dell EMC Ready Solutions for Oracle designed using the Unity 650F storage array and other Dell EMC hardware for networking and servers creates a reliable reference architecture that will support the upgrade from Oracle Database 12cR2 to Oracle Database 18cR1. Snapshot creation results in very little impact to the performance of these databases. This solution exhibits a simplified upgrade from 12c R2 to 18cR1. Customers can enjoy the many advantages of Dell EMC product portfolios along with the advanced features of the Oracle Database 18cR1.