


WRF Performance with 3rd Generation Intel Xeon Scalable Processors On Dell EMC PowerEdge servers
Tue, 21 Sep 2021 13:56:11 -0000
|Read Time: 0 minutes
Many sectors like aviation, travel, tourism, energy, and transportation heavily rely on timely and accurate weather predictions provided by weather forecast centers. These operational forecast centers make use of numerical weather prediction (NWP) models to predict the weather based on current weather conditions. Weather research and forecasting (WRF) is one of the most widely used numerical weather prediction systems for weather forecasting. A suitable combination of robust computational resources, high-speed network and high throughput storage is required to achieve the maximum performance on high-performance computing (HPC) cluster for the WRF model to deliver timely forecasts.
In this blog, we highlight the performance improvement for WRF with Intel Ice Lake processors as compared with Intel Cascade Lake processors with Dell EMC PowerEdge servers. These tests were carried out on two socket Dell PowerEdge servers by setting the BIOS option to the HPC workload profile. The testbed hardware and software details are outlined in the following table:
Table 1: Testbed hardware and software details
Component | Dell EMC PowerEdge R750 server | Dell EMC PowerEdge R650 server | Dell EMC PowerEdge C6420 server | Dell EMC PowerEdge C6420 server |
SKU | 8380 | 6338 | 8280 | 6252 |
Cores/Socket | 40 | 32 | 28 | 24 |
Frequency (Base-Max Turbo) | 2.30 – 3.40 GHz | 2.0 – 3.20 GHz | 2.70 – 4.0 GHz | 2.10 – 3.70 GHz |
TDP | 270 W | 205 W | 205 W | 150 W |
L3Cache | 60M | 48M | 38.5M | 37.75M |
Operating System | Red Hat Enterprise Linux 8.3 4.18.0-240.22.1.el8_3.x86_64 | Red Hat Enterprise Linux 8.3 4.18.0-240.22.1.el8_3.x86_64 | Red Hat Enterprise Linux 8.3 4.18.0-240.el8.x86_64 | Red Hat Enterprise Linux 8.3 4.18.0-240.el8.x86_64 |
Memory | 32 GB x 16 (2Rx8) 3200 MT/s | 32 GB x 16 (2Rx8) 3200 MT/s | 16 GB x 12 (2Rx8) 2933 MT/s | 16 GB x 12 (2Rx8) 2933 MT/s |
BIOS/CPLD | 1.2.4/1.0.5 | 2.11.2/1.1.0 | ||
Interconnect | NVIDIA Mellanox HDR | NVIDIA Mellanox HDR | NVIDIA Mellanox HDR100 | NVIDIA Mellanox HDR100 |
Compiler | Intel parallel studio 2020 (update 4) | |||
Datasets | ||||
We benchmarked WRF-V3.9.1.1 with the conus 2.5km and new conus 2.5km datasets and WRF-V4.2.2 with new conus 2.5km and wrf_large 3km datasets. The following figure shows the simulation domain for the tested datasets:
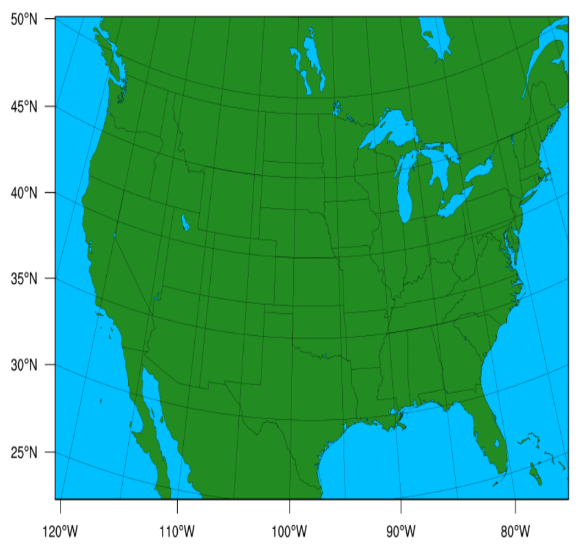
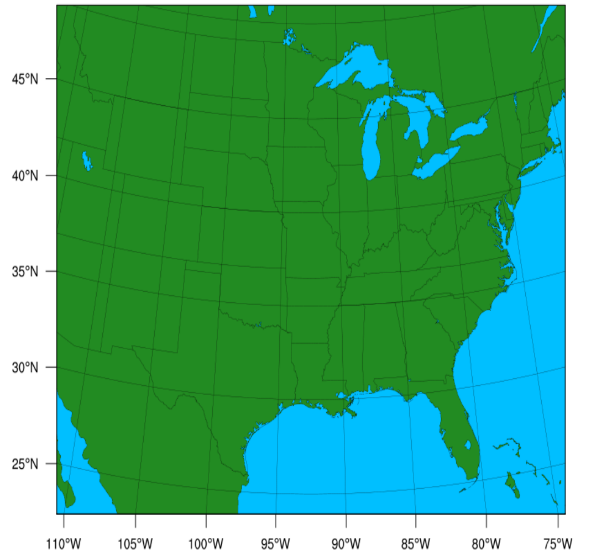
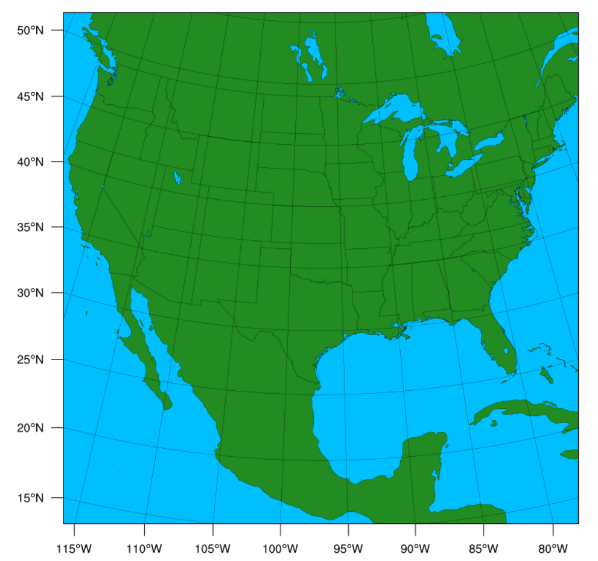
Figure 1: Domain configuration for new conus 2.5 km, conus 2.5 km, and wrf_large datasets.
The following table provides a brief description of each dataset:
Table 2: Configuration for new conus 2.5 km, conus 2.5 km and wrf_large datasets
| conus 2.5 km | new conus 2.5 km | wrf_large |
Run hours | 3 | 3 | 2 |
Resolution(m) | 2500 | 2500 | 3000 |
Vertical layers | 35 | 35 | 50 |
Grid points | 1501 x 1201 | 1901 x 1301 | 1500 x 1500 |
interval_seconds | 10800 | 10800 | 21600 |
The results were measured by averaging the WRF computation time of each timestep from the rsl.error.0000 output file. The timesteps during the file read / write (of wrfout* / wrfinput* ) were not included in the average.
Single node performance
The following figures show the application performance for the datasets mentioned in Table 2. In each figure, the numbers over the bars represent the relative performance compared to the performance obtained with the Intel 6252 Cascade Lake processor model. The blue and green bars represent application performance obtained with Ice lake and Cascade Lake processors.
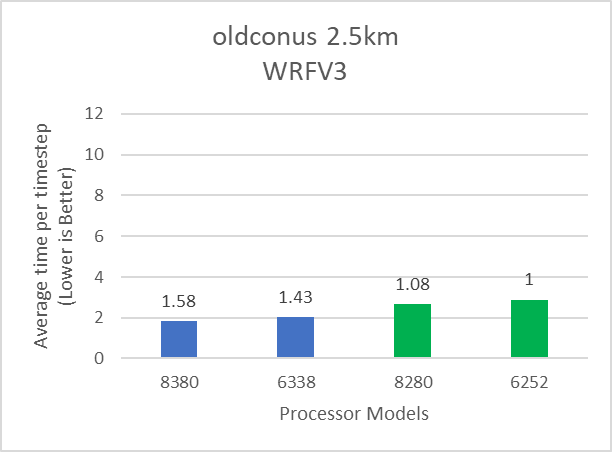
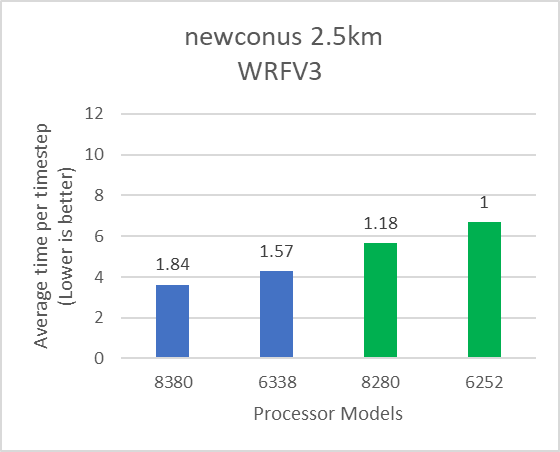
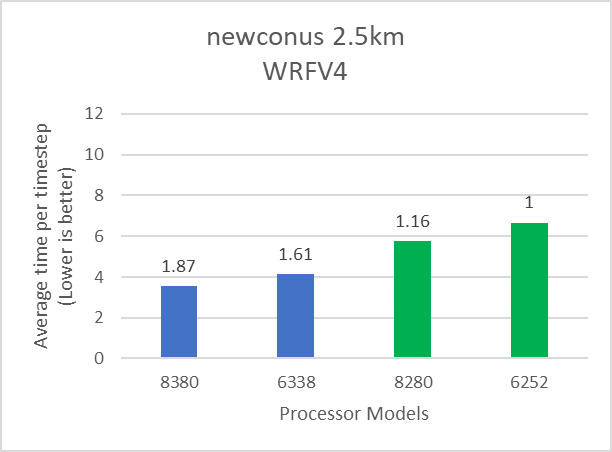
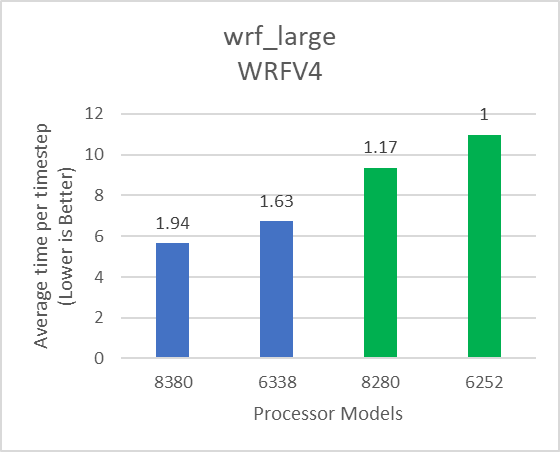
Figure 2: Relative performance of WRF by processor and dataset type mentioned in Table 1
WRF was compiled with the "dm + sm" configuration with avx2 instructions and serial netcdf support (io_form* set to 2). All the available cores were subscribed during WRF simulation runs. To optimize performance, we tested different MPI process counts, OpenMP thread count combinations, and tiling schemes (WRF_NUM_TILES).
Depending on the dataset, the 8380 processor model can deliver up to 19 percent better performance compared to the 6338 processor model. Relative to Cascade Lake, the Ice Lake architecture has more memory channels and offers higher aggregate memory bandwidth. WRF, which is typically memory bandwidth bound, can take advantage of the additional memory bandwidth (Table 3) provided by Ice Lake and the results demonstrate up to 65 percent performance improvement over the Cascade Lake counterparts. Comparison of Instructions Per Cycle (IPC) and DRAM Bandwidth Utilization collected using Intel OneAPI Vtune profiler on Intel Ice Lake and Cascade Lake processors is shown in Table 3.
Table 3: Metrics collected using Intel OneAPI vtune profiler
8380 | 8280 | |||
IPC | Bandwidth(GB/s) | IPC | Bandwidth (GB/s) | |
conus 2.5km (WRFV3) | 0.99 | 257.32 | 0.86 | 128.30 |
new conus2.5km (WRFV3) | 1.57 | 192.18 | 1.48 | 120.96 |
new conus 2.5km (WRFV4) | 1.36 | 191.43 | 1.14 | 115.46 |
wrf_large (WRFV4) | 1.09 | 64.80 | 0.90 | 62.55 |
Intel’s Ice Lake is expected to deliver around 20 percent better IPC than the Cascade Lake model (8380 vs 8280). With datasets covered in this blog, we found that Intel 8380 processor reports 6 to 19% better IPC than the Intel 8280 processor.
Figure 3 shows the power consumption using the box and whiskers plot when the system was being benchmarked with the four tests shown in Figure 2. Box indicates the spread of the central 50% of the power data, and the central line represents the median power value. The dots shows the outlier power values , most of which were recorded during the initialization and finalization phase of the tests.
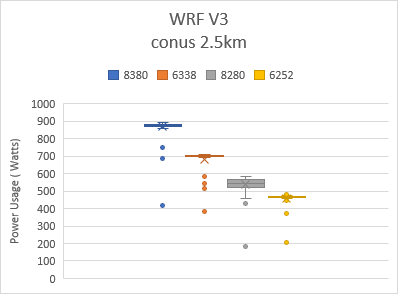
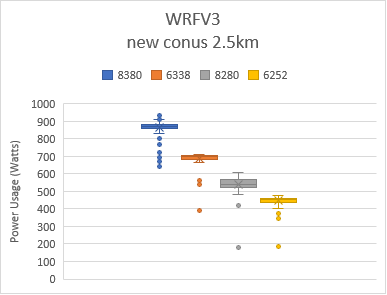
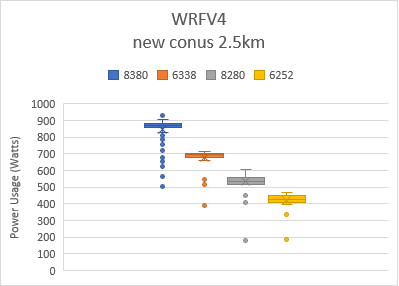
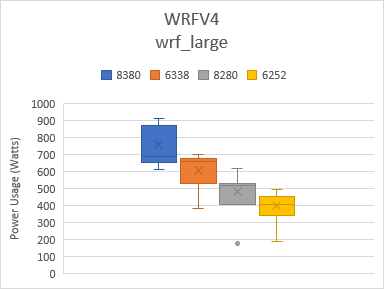
Figure 3: Power used by platform and processor type
Average frequency usage for 8380, 6338, 8280, and 6252 processors were around 2.9, 2.5, 3.0, and 2.5 GHz respectively for all datasets.
Multi-node Scalability
We used eight nodes to evaluate the scalability of WRF. Each node is equipped with the Intel 8380 processor and interconnected using the NVIDIA Mellanox HDR interconnect. The nodes used for benchmarking were connected to the same HDR switch. Table 1 provides details about the server and software that was used for the test. The text on top of the bar in Figure 4 represents the relative performance (on two, four, and eight nodes) for the application as compared with the performance with a single node.
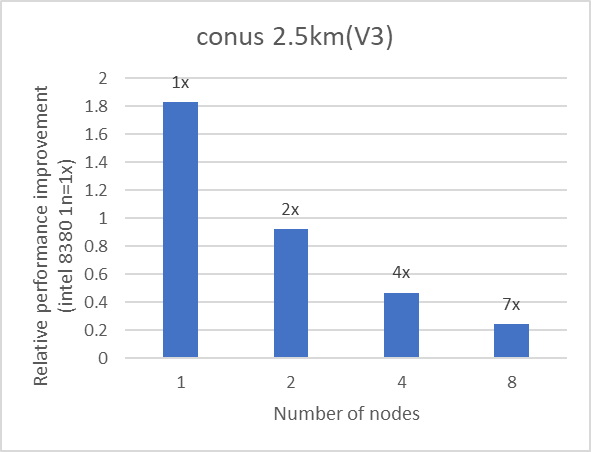
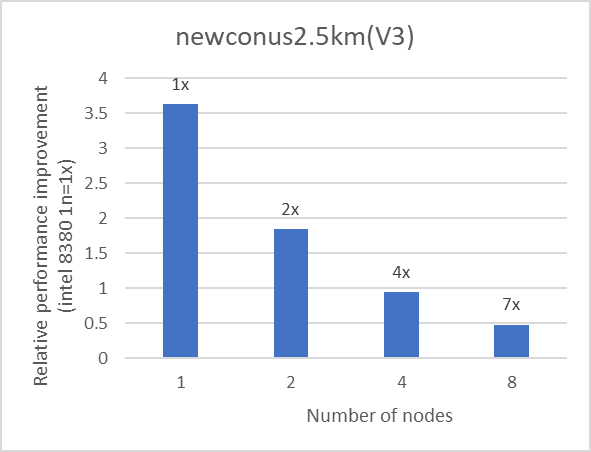

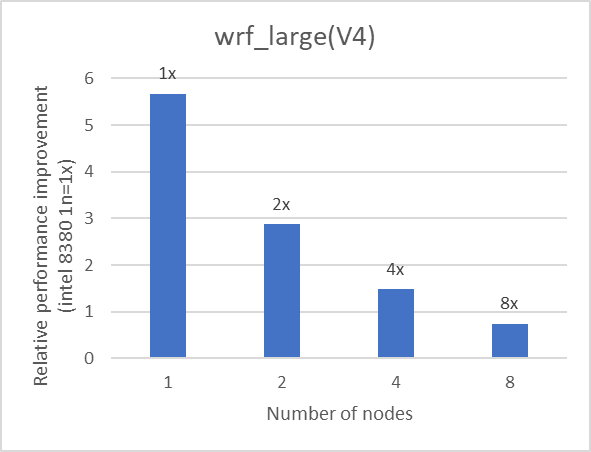
Figure 4: Multi-node performance of WRF on an Intel 8380 processor model for datasets listed in Table 1
The scalability numbers have been rounded off to a single digit. We observed good scalability with all the datasets listed in Table 1.
Conclusions and recommendations
For WRF, Intel Ice Lake demonstrates significant performance improvement as compared with Intel Cascade Lake processors. WRF simulations scale well with the datasets described in this blog. The scalability might vary depending on the dataset being used and the node count being tested. For the best performance with WRF, the impact of the tile size, process, and threads per process should be evaluated.