


Tuxedo Pipeline Performance on Dell EMC PowerEdge R6525
Tue, 27 Apr 2021 03:48:30 -0000
|Read Time: 0 minutes
Overview
Gene expression analysis is as important as identifying Single Nucleotide Polymorphism (SNP), insertion/deletion (indel), or chromosomal restructuring. Ultimately, all physiological and biochemical events depend on the final gene expression products, proteins. Although most mammals have an additional controlling layer before protein expression, knowing how many transcripts exist in a system helps to characterize the biochemical status of a cell. Ideally, technology would enable us to quantify all proteins in a cell, which would significantly advance the progress of Life Science. However, we are far from achieving this.
This blog provides the test results of one popular RNA-Seq data analysis pipeline known as the Tuxedo pipeline (1). The Tuxedo pipeline suite offers a set of tools for analyzing a variety of RNA-Seq data, including short-read mapping, identification of splice junctions, transcript, and isoform detection, differential expression, visualizations, and quality control metrics. The tested workflow is a differentially expressed gene (DEG) analysis, and the detailed steps in the pipeline are shown in Figure 1.
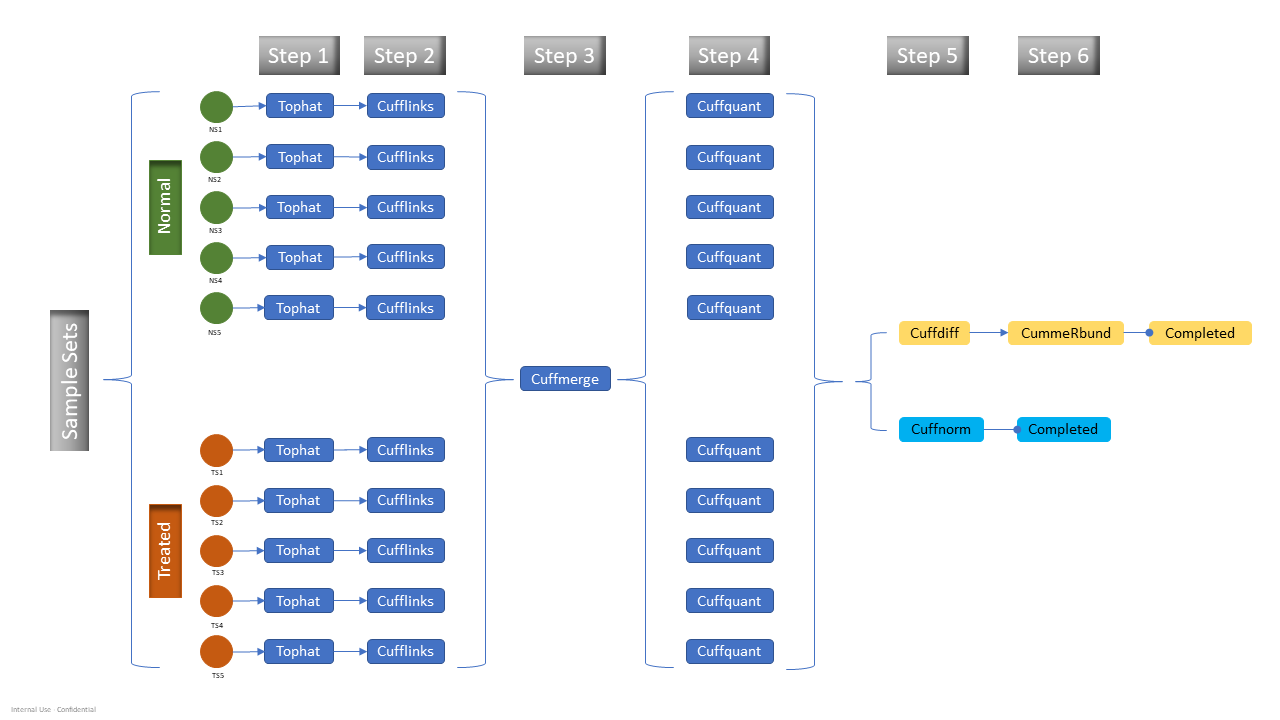
Figure 1. Updated tuxedo pipeline with cuffquant step
A single node study with AMD EPYC 7002 series (Rome) and AMD EPYC 7003 series (Milan) on Dell EMC PowerEdge R6525 server was done. The configurations of the test system are summarized in Table 1.
Table 1. Tested compute node configuration
| Dell EMC PowerEdge R6525 | |
|---|---|
| CPU | Tested AMD Milan: 2x 7763 (Milan), 64 Cores, 2.45 GHz – 3.5 GHz Base-Boost, TDP 280 W, 256 MB L3 Cache 2x 7713 (Milan), 64 Cores, 2.0 GHz – 3.7 GHz Base-Boost, TDP 225 W, 256 MB L3 Cache 7543 (Milan), 32 Cores, 2.8 GHz – 3.7 GHz Base-Boost, TDP 225 W, 256 MB L3 Cache
Tested AMD Rome: 7702 (Rome), 64 Cores, 2.0 GHz – 3.35 GHz Base-Boost, TDP 200 W, 256 MB L3 Cache |
| RAM | DDR4 256 GB (16 Gb x 16) 3200 MT/s |
| Operating system | RHEL 8.3 (4.18.0-240.el8.x86_64) |
| Interconnect | Mellanox InfiniBand HDR100 |
| Filesystem | Dell EMC Ready Solutions for HPC BeeGFS High Capacity Storage |
| BIOS system profile | Performance optimized |
| Logical processor | Disabled |
| Virtualization technology | Disabled |
| tophat | 2.1.1 |
| bowtie2 | 2.2.5 |
| R | 3.6 |
| bioconductor cummerbund | 2.26.0 |
A performance study of the RNA-Seq pipeline is not trivial because the nature of the workflow requires non-identical input files yet similar input files in size. Hence, 185 RNA-Seq paired-end read data are collected from a public data repository. All the read datafiles contain around 25 Million Fragments (MF) and have similar read lengths. The samples for a test are randomly selected from the pool of the 185 paired-end read files. Although these test data will not have any biological meaning, certainly these data with the high level of noise will put the tests in the worst-case scenario.
Performance Evaluation
Throughput test - Single pipeline with more than two samples, biological, and technical duplicates
Typical RNA-Seq studies consist of multiple samples, sometimes 100s of different samples, normal versus disease, or untreated versus treated samples. These samples tend to have a high level of noise due to biological reasons; hence, the analysis requires vigorous data preprocessing procedure.
A number of various samples were processed, with different RNA-Seq data selected from 185 paired-end reads dataset, to see how much data a single node can process. Typically, when the number of samples increases, the runtime of the Tuxedo pipeline increases. However, as shown in the figure below, the runtimes with two sample tests using 7713, are higher than the runtimes from four samples. The standard error from five repeated runs does not overlap with four and eight sample results. The interference of other users may cause this large variance. The current testing environment, especially a shared file system designed for large capacity, is not ideal for a Next Generation Sequencing (NGS) data analysis benchmark.
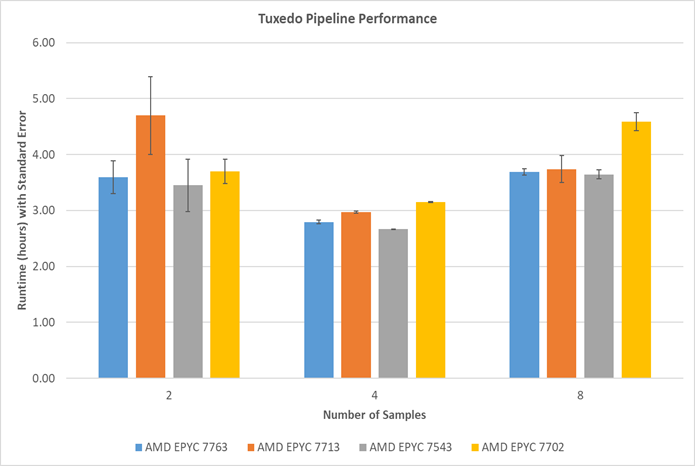
Figure 2. Runtime comparisons among various AMD EPYC 7003 Series processors: Standard error is estimated from an estimated standard deviation based on a sample (STDDEV.S function in Excel)
The eight sample test results show that AMD Milan processors perform better than one of the Rome processors (7702) in a higher workload.
Conclusion
Many tests are still required to obtain a better insight from the AMD Milan processors for the NGS data analysis area. Unfortunately, the tests could not exceed eight samples due to storage limitations. However, there seems to be plenty of room for a higher throughput that processes more than eight samples together. AMD Milan 7763 performed 20% better than AMD Rome 7702. AMD Milan 7713 performed 18% better in eight sample tests for the Tuxedo pipeline as described in Figure 2.