


TPCx-Big Bench Rocks on Dell EMC PowerEdge R7515 with AMD Milan Processors
Thu, 06 May 2021 11:05:30 -0000
|Read Time: 0 minutes
Introduction
As part of the Dell Technologies AMD Milan launch in March 2021, Dell Technologies published eight results with the Transaction Processing Performance Council (TPC) (www.tpc.org). Six of those results are categorized as big data; five as TPCx-HS, and one as TPCx-Big Bench. Milan is a code name for AMD EPYC third-generation processors which represent a broad line-up of processors for cloud, enterprise, and high-performance computing workloads. This blog is part of a series that present these results. It also dives into why they should matter to Big Data enthusiasts and professionals in Engineering, Marketing, and Sales.
System under test (SUT)
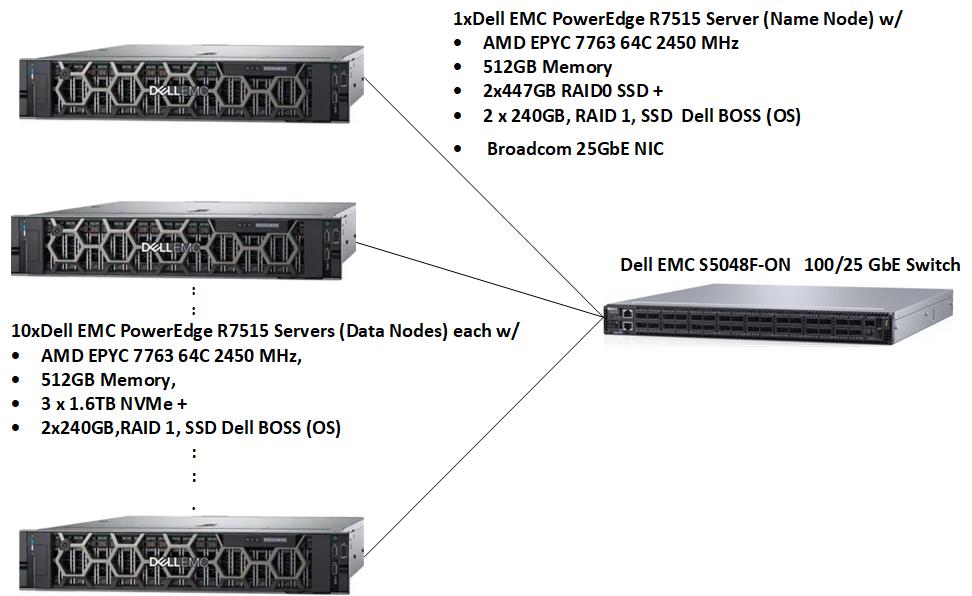
Figure 1: SUT for TPCx-BB result
The SUT for the TPCx-BB result used 11 x Dell EMC PowerEdge R7515 servers: one NameNode server and 10 DataNode servers as shown in the Figure 1 above.
Hardware configuration | |
Data Size | SF 3000 |
Number of nodes | 11 |
Processor | 1 x AMD EPYC 7763 64-core, 2.45 GHz, 256 MB-L3 |
Memory | 512 GB (8 x 64 GB RDIM 3200 MT/s Dual Rank) |
Network (cluster connectivity) | 1x Broadcom Dual Port 25 GbE NIC Mezzanine |
Network (remote connectivity) | 1 x Broadcom Gigabit Ethernet BCM5720 NIC |
Software stack | |
Operating system | SUSE Linux Enterprise Server 12 SP5 |
Hadoop | Cloudera Private Cloud Base 7.1.4 |
Query execution engine | Hive on Tez |
Java | Open JDK 64-Bit Server build 1.8.0_232-cloudera |
Table 1: SUT configuration
TPCx-BB Overview
TPCx-Big Bench (TPCx-BB) is an application benchmark for Big Data Analytic Systems (BDAS). Three cornerstone aspects characterize Big Data systems: volume, velocity, and variety.
Volume refers to the size of the Big Bench dataset that is based on a single scale factor and is predictable and deterministic. Scale Factors are used to scale data from 1 TB to up to Petabytes of data. Velocity refers to the ability of the Big Data system to stay current through periodic refreshes, commonly known as Extraction, Transformation, and Load (ETL). Variety refers to the ability to deal with differently organized data, from unstructured to semi-structured and structured data.
TPCx-BB features 30 complex queries; query 1 to query 30. These queries are real-world and are designed along one business dimension and three technical dimensions that cover different business cases and technical perspectives: Data Source, Processing type, and Analytic technique.
Based on the McKinsey report (McKinsey Report on Big Data; Big Data: The next frontier for innovation, competition, and productivity; https://www.mckinsey.com/~/media/McKinsey/Business%20Functions/McKinsey%20Digital/Our%20Insights/Big%20data%20The%20next%20frontier%20for%20innovation/MGI_big_data_full_report.pdf ) on big data, 10 (query 1 – query 10) queries were identified that fall into five main categories of a retail business: Marketing, Merchandising, Operations, Supply Chain and New business models (price comparisons).
Data source dimension measures the type of input data the query is targeting. There are three types of input data in Big Bench: structured, semi-structured and unstructured. For example, Query 1 uses semi-structured web click streams as data source, while Query 3 performs sentiment words extraction on unstructured product reviews data.
Processing type dimension measures the type of processing appropriate for the query. This dimension covers the two common paradigms of declarative and procedural languages. In other words, some of the queries can be answered by declarative languages; others by procedural languages; and others by a mix of both.
Analytic technique dimension measures different techniques for answering business analytics questions. In general, three major categories of analytic techniques were identified: statistical analysis, data mining, and simple reporting.
The TPC requires that Express benchmarks like TPCx-BB must run the TPC-provided kit in order to publish a compliant TPC Express result. The latest TPCx-BB kit can be downloaded from TPC Documentation Webpage.
Scale Factor
TPCx-BB defines a set of discrete scaling points (scale factors) based on the approximate size of the raw data that the data generator produces, in GB. Each defined scale factor has an associated value for SF, a unit-less quantity, roughly equivalent to the number of GB of data present on the storage. Test sponsors may choose any scale factor from the defined series except SF1 which is used for Result validation only. No other scale factors may be used for a TPCx-BB Result.
1 | 1000 | 3000 | 10000 | 30000 | 100000 | 300000 | 1000000 |
Table 2: Allowable scale factors
Dell Technologies published on SF 3000 which is equivalent to 2,794 GB of raw data.
Benchmark Phases
TPCx-BB defines three phases: Load test, Power test, and Throughput test. The three tests run sequentially and are not permitted to overlap.
During the load test, the test database that is used to run the three phases is built. The Power test determines the time the SUT can process all 30 queries which must run sequentially in ascending order. The Throughput test runs 30 queries using concurrent streams. Each stream runs all 30 queries in a specified placement order. The default number of streams is set to 2, but the number of concurrent streams is configurable with no maximum limit.
The results must be run as per TPCx-BB specification in order to pass an audit. Then the TPC publishes them. A compliant benchmark test consists of a validation test followed by two benchmark runs; Run 1 and Run 2. A benchmark run consists of three phases as stated above: Load test, Power test, and Throughput test. The validation test performs the three benchmark phases with Scale Factor 1 and validates the results against the reference result set in the kit. The validation test ensures that the engine that the test sponsor uses can match the reference result set generated.
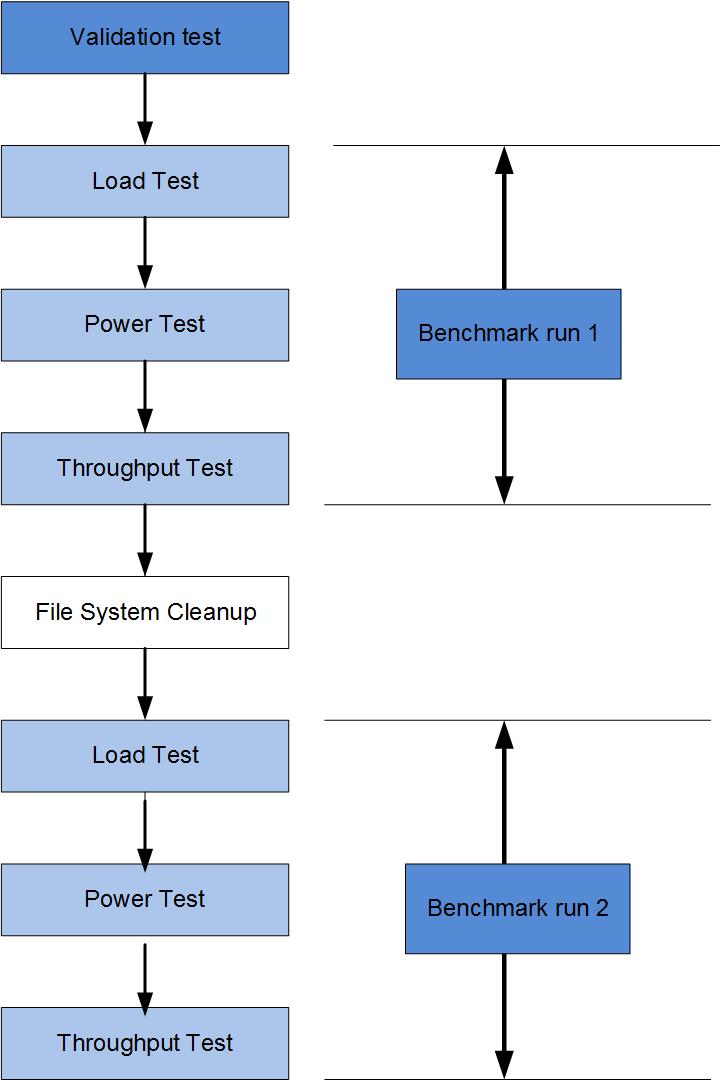
Figure 2: Benchmark execution phases
What is measured?
The benchmark measures the time that it takes for all 30 queries to be performed. All TPC published results must disclose a Primary Metric that consists of three elements: Performance metric, Price/Performance metric, and an availability date.
The performance metric is computed from metric components representing Load, Power, and Throughput tests as defined above.
SF | Scale Factor |
|
TLoad | Elapsed time of Load test |
|
TLD | Load Factor | TLD=0.1 * TLoad |
Q(i) | Elapsed time in seconds of Query i |
|
M | Number of Queries |
|
TPT | Geometric Mean of the elapsed time of each of the 30 Queries measured in the power run |
|
TTput | Elapsed time of all streams in the Throughput test |
|
TTT | Throughput test metric |
|
n | Number of streams in the Throughput Test |
|
Performance Metric |
|
|
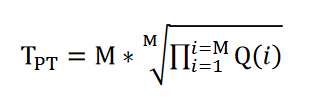
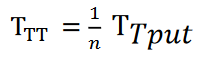
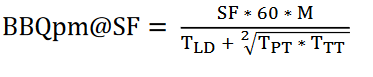
Table 3: Computation of the performance metric
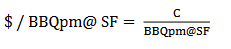
The price/performance metric is computed as below:
The system availability date is the date all components of the SUT are generally available to customers. Any reference to a TPC result must disclose all the 3 elements of the Primary Metric.
TPCx-BB consists of application level workloads that essentially measure the efficiency of the underlying infrastructure. A good result will depend on a well optimized and tuned infrastructure, from the BIOS/OS settings through the Hadoop framework, to the application level (Hive, Spark). For this result, Cloudera Private Cloud Base (CDP 7.1.4) configuration settings were optimized (Dell EMC PowerEdge 14G Performance Characterization for Data Analytics; https://infohub.delltechnologies.com/section-assets/h17247-poweredge-14g-performance-characterization-for-data-analytics-technical-white-paper) based on the resources (CPU cores, Memory and Storage ) available to the cluster. Hive (SQL Engine) settings for each query were also tweaked for improved query performance. Additionally, Spark Submit operator settings were adjusted for better performance of the five Machine Learning queries (q5, q20, q25,q26 and q28).
Results
The artifacts for this result can be found on this TPC Results Page. Table 4 below summarizes two results of the TPCx-BB SF3000 performance table: the most recent result based on Dell EMC PowerEdge 7515 and the previous best result (PrevBest) from a competing company. The PrevBest result was submitted four years ago and is now historical.
A historical result is one that:
- Is still in an accepted state
- Has been posted:
- At least 185 days past the submission date
- At least 60 days past the availability date.
On the TPCx-BB Performance results page, historical results are not displayed by default unless the Include Historical Results option is checked. This result (PrevBest) was the previous best result. It is added to show how far technology has moved and improved Big Data performance in the last four years.
| Run 1 | Run 2 | PrevBest (PrevBest is a historical result.) |
Load test (s) | 473.10 | 472.69 | 1,302.23 |
Power test (s) | 5,612.53 | 5,630.56 | 16,294.45 |
Throughput test (s) | 24,907.11 | 24,792.50 | 52,751.28 |
Overall run time | 30,992.74 (8.61 hrs.) | 30,895.76 | 70,347.97 (19.54 hrs.) |
Performance (BBQpm) | 1,544.13 | 1,547.29 | 611.31 |
Price/Performance ($/BBQpm) | 487.85 |
| 646.31 |
Availability date | 03-15-2021 |
| 12-29-2016 |
Number of nodes | 11 |
| 16 |
Total rack units (TRU) | 23 |
| 34 |
Processor/Cores/Threads (P/C/T) | 11/704/1,408 |
| 32/512/1,024 |
Storage | 54,240GB/30xNVMe + 24 SSD |
| 220,480GB/ 254 HDD |
Table 4: TPCx-BB SF3000 performance results on March 15, 2021
Figure 2 above shows the benchmark phases. Run 1 and Run 2 are run sequentially on the same SUT. The run with the smallest BBQpm score, in this case Run1, is designated as the Performance run. The run with the lowest score (Run 2) is the Repeatability run.
Figure 3 below is a chart showing that the Dell EMC PowerEdge 7515 result scored 2.53x better performance than the previous best result. PrevBest* is a historical result.
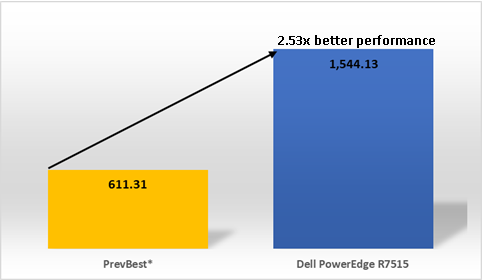
Fig 3: TPCx-BB SF 3000 performance result on March 15, 2021
Figure 4 is a chart that shows that price/performance improved by 24.52%.
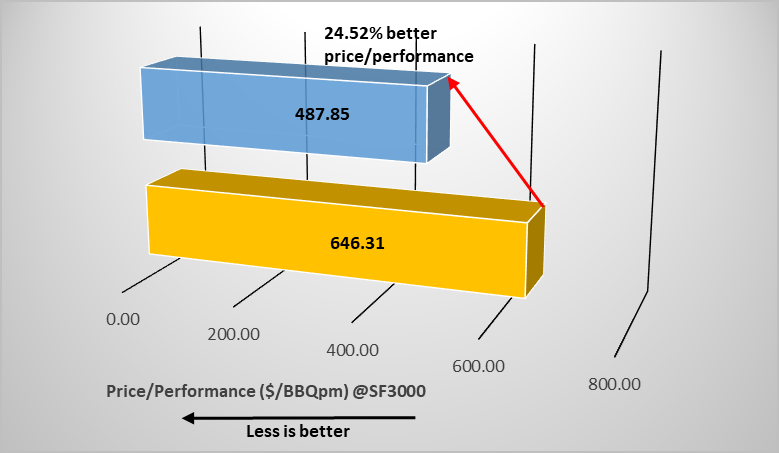
Fig 4: TPCx-BB SF 3000 price/performance result on March 15, 2021
Key Takeaways
- Dell Technologies renews its interest in the smaller SF TPCx-BB space after over four years.
- More processing power is contained in smaller packages. The Dell EMC PowerEdge R7515 result used more processing cores in a smaller footprint (TRU) compared to the previous best result. This tendency is consistent with current industry trends.
- It pays to invest in faster storage. The Dell EMC PowerEdge R7515 result used about 54 TB of NVMe + SSD storage compared to about 220 TB of HDD storage. The faster storage better matched the faster processors enabling more efficient processing. That power contributed to the SUT posting 2.53x better performance and 24.52% better price/performance than the previous best TPCx-BB SF 3000 result. The SUT used in this result took advantage of the lower prices for NVMe/SSD storage devices.
- Real-world queries should run over 2x faster on the PowerEdge R7515, based on previous results. Table 4 shows that the Dell EMC PowerEdge R7515 result was performed in 8.61 hours compared to 19.54 hours used by the previous best result.
Conclusion
This result demonstrates that Dell Technologies has a renewed interest in smaller SFs after several years. The previous most recent results from Dell EMC have been on the bigger SF 10000.
The TPCx-BB SF 3000 result showed that Dell EMC PowerEdge R7515 hardware platforms with AMD Milan processors pack blazing performance in smaller (than predecessors) rack units. These servers enable smaller data center footprints without sacrificing price or performance. This advantage coincides with observations from the other results which are part of this blog series.
Dell Technologies uses these results to provide verifiable performance data about its products and solutions to its customers. For that reason, Dell Technologies has been an active member of the TPCx-Big Bench Technical Committee. Dell Technologies continues to collaborate with other stakeholders within the industry to maintain the TPCx-BB specification.