


Dell Reinforces its TPCx-AI Benchmark Leadership using the 16G PowerEdge R6625 Hardware Platform at SF1000
Wed, 12 Jul 2023 18:52:17 -0000
|Read Time: 0 minutes
Overview
On 06-13-2023, Dell Technologies published a TPCx-AI SF1000 result that was based on an 11 x Dell PowerEdge R6625 hardware platform powered by AMD Genoa processors. As of the publication date, Dell results held number one slots on the Top Performance and Price/Performance tables for TPCx-AI on SF3, SF100, SF300, and SF1000. These results reinforce Dell Technologies’ TPCx-AI benchmark leadership position; a statement to the great performance provided by its AI, ML, and DL solutions.
This blog presents the hardware platform that was tested, what was measured and what the results mean.
What TPCx-AI tests measure
TPCx-AI measures the end-to-end machine learning or data science platform using a diverse representative dataset scaling from 1 GB to 10 TB. The TPCx-AI benchmark assesses various aspects of AI training and inference performance, including data generation, model training, serving, scoring, and system scalability. The benchmark can be used across a wide range of different systems from edge to data center. It aims to provide a standardized and objective measure of AI performance across different platforms and configurations.
By using TPCx-AI, organizations and vendors can make informed decisions about the AI infrastructure that best suits their needs. The benchmark helps in understanding the system's capability to handle large-scale AI training workloads and can help optimize performance and resource allocation for AI tasks.
The TPCx-AI standard defines 10 use cases based on data science pipelines modeled on a retail business data center to evaluate the performance of artificial intelligence systems. The workload trains deep neural networks on large datasets using prominent machine learning frameworks such as TensorFlow. The benchmark measures:
- The total time taken to train a model for each use case to a specific level of accuracy
- The time taken for that model to be used for inference or serving
The blog, Interpreting the results of the TPCx-AI Benchmark, outlines the ten use cases, their data science models, and the benchmark phases.
System under test (SUT)
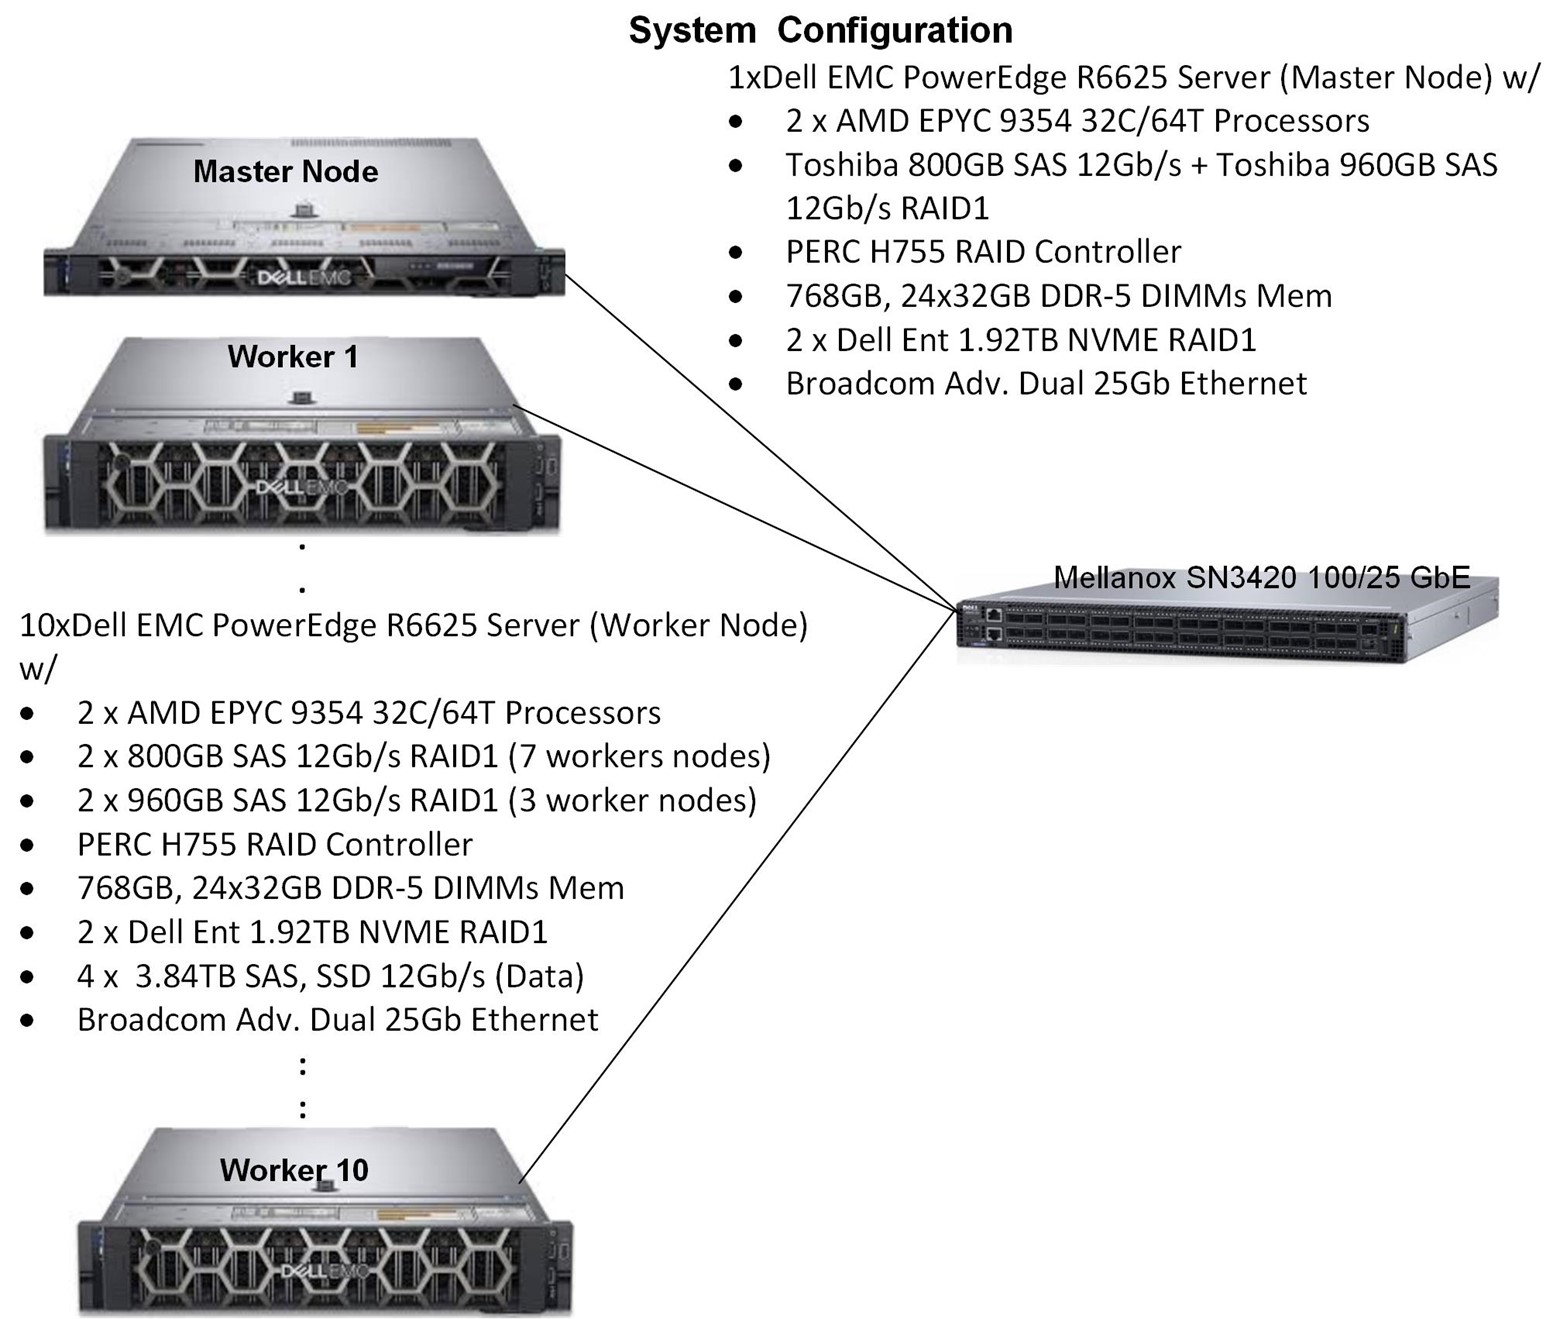
Figure 1 System Under Test (SUT).
Software versions
Table 1 Software versions
Software | Version |
Cloudera Data Platform (CDP) | 7.1.7 SP2 |
Hadoop | 3.1.1 |
HDFS | 3.1.1 |
YARN | 3.1.1 |
MR2 | 3.1.1 |
Spark | 2.4.7 |
ZooKeeper | 3.5.5 |
Java | 1.8.0 |
Python | 3.7.16 |
Red Hat Enterprise Linux | 8.7 (Master node) |
TPCx-AI Kit | 1.0.2 |
The result
Primary metrics
Table 2 Primary metric scores
Primary Metric | Score |
Performance (AIUCpm@1000) | 3,258.01 |
Price/Performance (USD/AIUCpm@100) | 267.96 |
Availability | June 13, 2023 |
The three primary metrics in Table 2 are required for all TPC results. The top ten results, based on performance or price/performance at a particular SF category, are displayed in the tables of the respective benchmark standard categorized by the metric and SF. To compare any results, all three metrics must be disclosed in the body of the message. The TPC does not allow comparing TPCx-AI results from different SF categories. The blog, Interpreting the results of the TPCx-AI Benchmark, goes into the details of how the performance and price/performance metrics are calculated. The availability date is the date all the priced line items (SKUs) are available to customers and must be within 185 days of the submission date. For the performance metric, the higher the score the better. For price/performance, the lower the better.
Other metrics
Table 3 Other metrics
Metric | Score |
Total system cost | $872,988 |
Framework | Cloudera SEL Data Platform Private Cloud Base Edition |
Operating system | Red Hat Enterprise Linux 8.6/8.7 |
Scale factor | 1,000 |
Physical storage divided by scale factor | 214.56 |
Scale factor divided by physical memory | 0.12 |
Main data redundancy mode | Replication 3, RAID 1 |
Number of servers | 11 |
Total processors, cores, and threads | 22/704/1,344 |
Number of streams | 4 |
The metrics in Table 3 are required to be reported and disclosed in the Full Disclosure Report (FDR) and Executive Summary (ES). Except for the total system cost, these other metrics are not used in the calculation of the primary metrics but provide additional information about the system that was tested. For instance, the total system cost is the total cost of ownership (TCO) for one year. The redundancy modes provide the data protection mechanisms that were used in the configuration as required by the benchmark standard. The number of streams refers to the number of concurrent serving tests during the Throughput phase.
Numerical quantities
Benchmark run times
Table 4 Benchmark run times
Benchmark run | Time |
Benchmark start | 06-07-2023 9:35:25 PM |
Benchmark end | 06-08-2023 3:20:10 AM |
Benchmark duration | 5:44:45.193 |
Benchmark phase times
Table 5 Benchmark phase metrics
Benchmark phase | Metric_name | Metric value |
Data Generation | DATAGEN | 2419.613 |
Data Loading | TLOAD | 927.45 |
Load Test | TLD | 927.45 |
Power Training | TPTT | 492.143 |
Power Serving 1 | TPST1 | 56.998 |
Power Serving 2 | TPST2 | 57.357 |
Power Serving | TPST | 57.357 |
Throughput | TTT | 43.934 |
AIUCpm@1000.0 | 3258.066 |
The seven benchmark phases and their metrics are explained in Interpreting the results of the TPCx-AI Benchmark, and are performed sequentially from data generation to throughput tests. In power training, models are generated and trained for each use case sequentially from UC1 to UC10. In power serving, the models obtained during the training phase are used to conduct the serving phase sequentially, one use case at a time. There are two power serving tests. The test that registers the longer time provides the TPST metric. The throughput phase runs multiple streams of serving tests concurrently. The more the number of streams, the more the system resources are taxed. Typically, the number of streams are increased until TTTn+1 > TTTn (where n+1 refers to the next throughput test). The duration of the longest running stream (TTPUT) is used to calculate the throughput test metric TTT.
Use case times and accuracy
Table 6 Use case times and accuracy
Use case | TRAINING | SERVING_1 | SERVING_2 | Throughput | Accuracy | Threshold |
1 | 523.703 | 51.215 | 49.736 | 56.083 | -1.00000 | -1.0 >= -1 |
2 | 1813.764 | 85.354 | 88.783 | 129.274 | 0.43830 | word_error rate <= 0.5 |
3 | 95.795 | 12.443 | 12.811 | 13.84 | 4.57451 | mean_squared_log_error <= 5.4 |
4 | 59.08 | 25.475 | 25.489 | 31.016 | 0.71189 | f1_score >= 0.65 |
5 | 943.023 | 76.289 | 78.351 | 91.615 | 0.03347 | mean_squared_log_error <= 5.4 <= 0.5 |
6 | 435.865 | 33.135 | 33.071 | 37.12 | 0.21355 | matthews_corrcoef >= 0.19 |
7 | 43.585 | 15.317 | 15.3 | 17.143 | 1.65306 | median_absolute_error <= 1.8 |
8 | 1940.283 | 338.579 | 341.811 | 372.418 | 0.74996 | accuracy_score >= 0.65 |
9 | 5448.735 | 703.291 | 699.631 | 745.458 | 1.00000 | accuracy_score >= 0.9 |
10 | 818.635 | 28.326 | 28.19 | 31.162 | 0.81691 | accuracy_score >= 0.7 |
Table 6 shows the use case run times (in seconds) for each benchmark phase and the accuracy of the model that was used. For instance, the RNN model that was generated and trained for UC2 had a word_error rate of 0.4383 which was less (better) than the threshold error_rate of 0.5. The XGBoost model trained for UC8 was 74.99% accurate which was above and better than the 65% minimum accuracy threshold requirement.
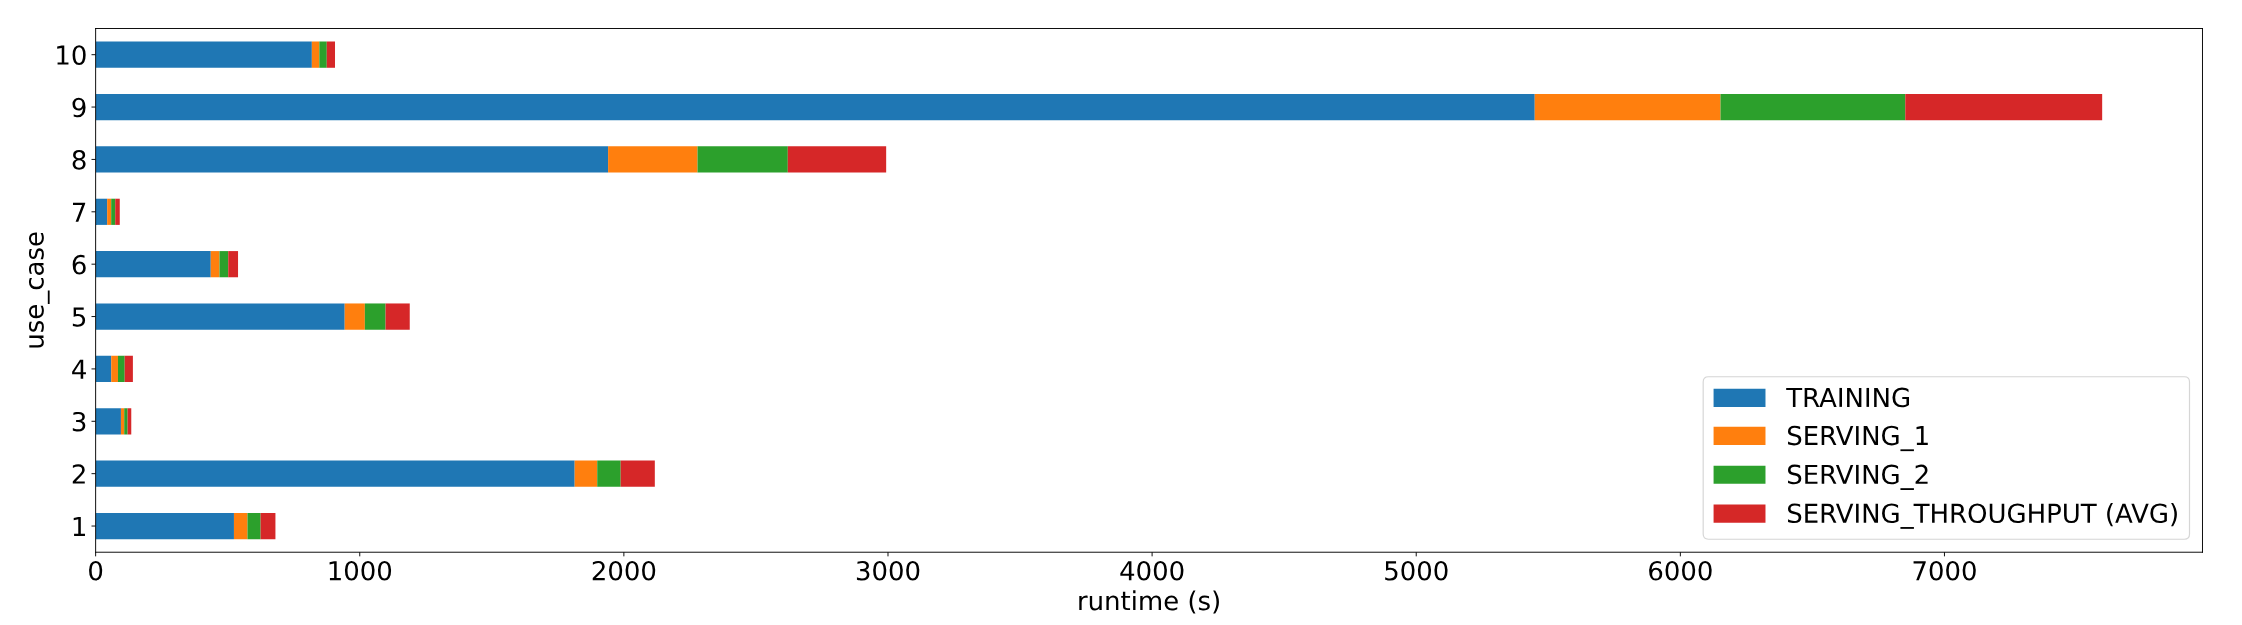
Figure 2 Use case time by benchmark phase
TPCx-AI SF1000 results tables
Table 7 displays the top TPCx-AI SF1000 tables as of the publication of this blog.
Table 7 SF1000 top performance table
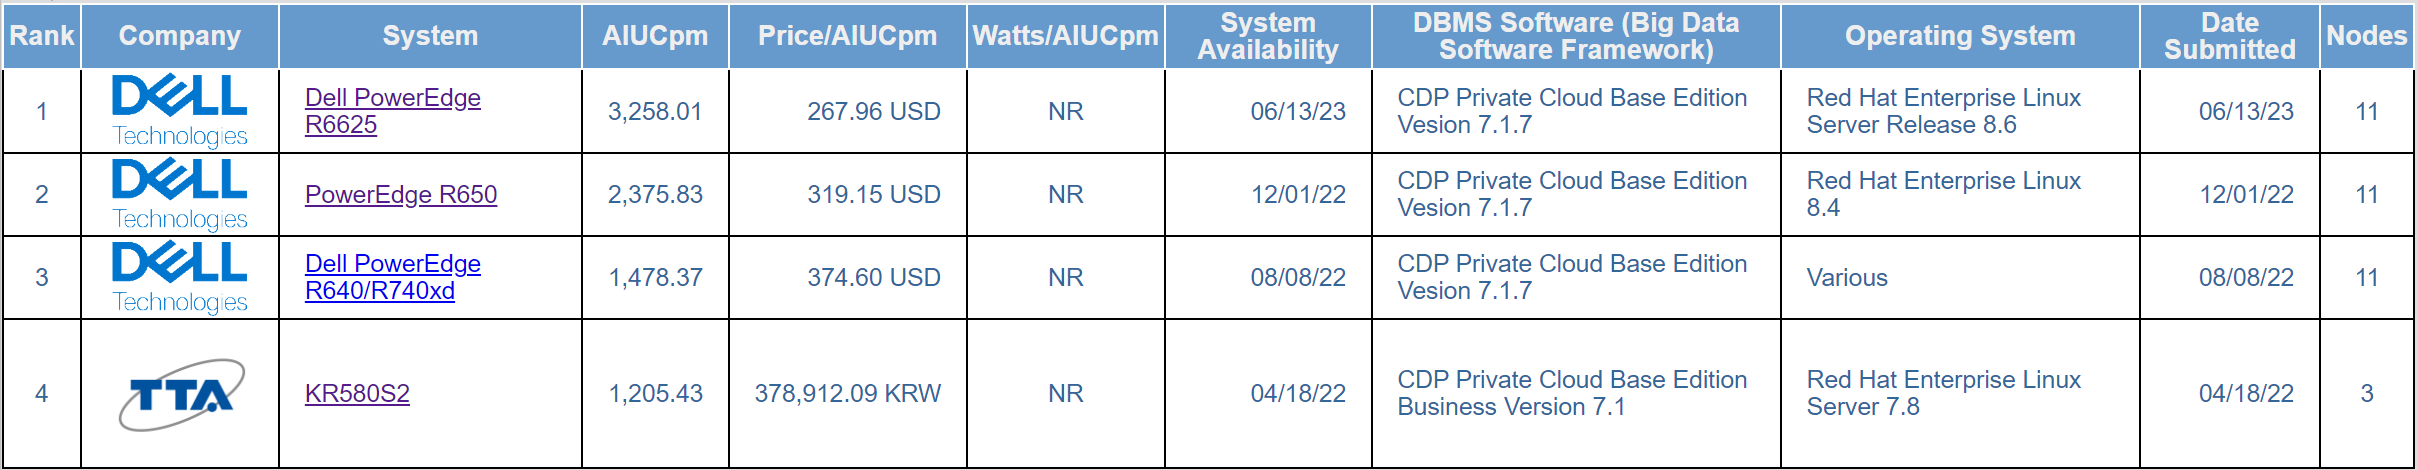
Table 8 Top price/performance table
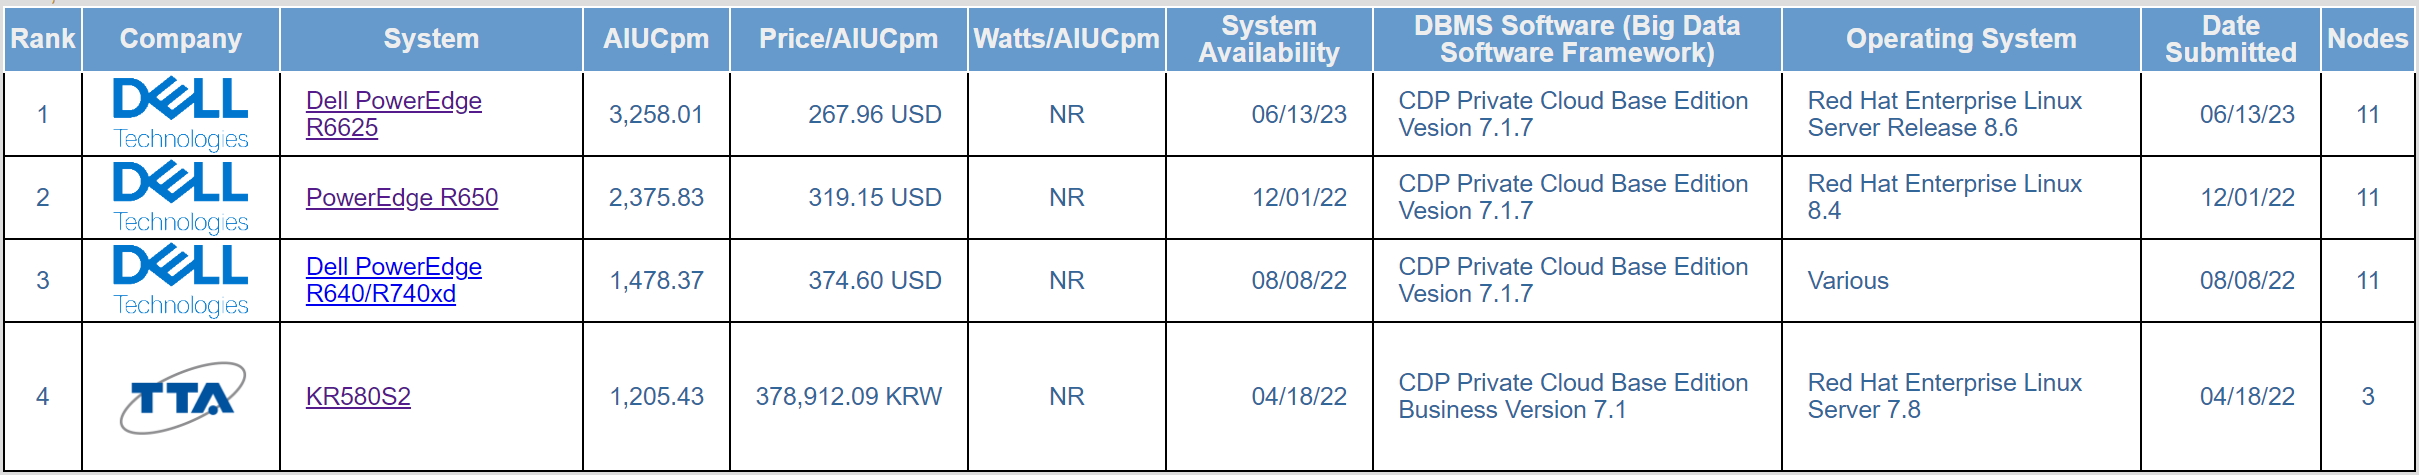
Table 7 and Table 8 are similar. Of the four published results at SF1000, Dell Technologies’ hardware platforms hold the number 1, number 2, and number 3 positions on both the performance and price/performance tables. The main difference between the three top results is the processor generations:
- The number 1 result used 4th generation AMD Genoa processors
- The number 2 result used 3rd generation Intel Ice Lake processors
- The number 3 result used 2nd generation Intel Cascade Lake processors
Key takeaways
- Dell dominates TPCx-AI top performance and price/performance tables at SF3, SF100, SF300, and SF1000.
- TPCx-AI performance improved greatly on newer generation Dell hardware platforms that have newer generation processors:
- There was a 60.71% performance improvement between hardware platforms powered by (14G) 2nd generation and (15G) 3rd generation processors.
- There was a 37.13% improvement between 3rd generation and (16G) 4th generation processors.
- TPCx-AI price/performance improved greatly between processor generations of the Dell 14G, 15G, and 16G hardware platforms:
- There was a 14.80% price/performance drop from hardware platforms powered by 2nd generation to 3rd generation processors.
- There was a 27.08% price/performance drop from 3rd generation to 4th generation processors.
- The form factor of the hardware platforms has reduced:
- The Dell 14G TPCx-AI SF1000 result used 2U servers
- The 15G and 16G results used 1U servers and scored better performance and price/performance
- Using NVMe data storage scored better price/performance metrics:
- The 14G result used hard drives
- The 15G and 16G results used more expensive NVMe data drives, and yet scored better price/performance metrics
Conclusion
This blog examined in detail the TPCx-AI performance result of the Dell 16G PE R6625 hardware platform. The result cemented Dell Technologies’ leadership positions on TPCx-AI performance and price/performance tables at SF1000, in addition to the leadership positions at SF3, SF100, and SF300. These results prove Dell Technologies’ leadership as a provider of high-performance AI, ML, and DL solutions based on verifiable performance data backed by a reputable, industry-standards performance consortium.
References
Nicholas Wakou, Nirmala Sundararajan; Interpreting the results of the TPCx-AI Benchmark; infohub.delltechnologies.com (February 2023).