The testing was performed on a three-node VxRail cluster for the Login VSI Knowledge Worker workload and a single node of the same VxRail cluster was used for the NVIDIA nVector graphics testing as this host contained the A16 GPUs.
One deviation from the APEX configurations was that each host had 1 TB of memory instead of the standard 2 TB because of memory supply chain constraints.
Login VSI Knowledge Worker test results
The VMware Horizon testing was performed with 170 instant clone VMs per physical host, providing for a total of 510 user sessions across the 3-node VxRail cluster.
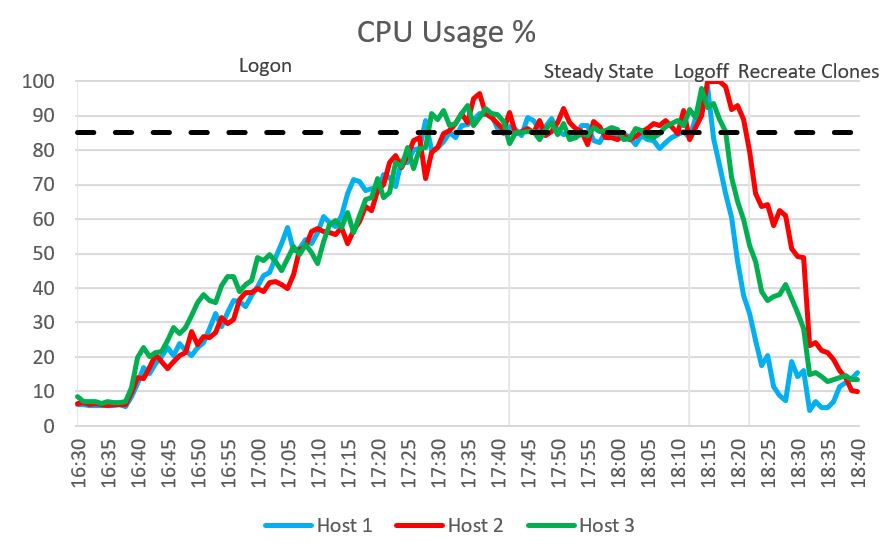
CPU usage
CPU usage steadily increased during the login phase and converged at the defined threshold during the steady state-phase of the test. The nodes showed only slight variations in usage during the login phase, which appears to be a normal distribution of usage. No anomalies were seen during testing.
The 85 percent value is exactly at the pass/fail threshold that we set for average CPU utilization. To maintain good EUE, do not exceed this threshold. You can load more user sessions while exceeding this threshold for CPU, but you might experience a degradation in user experience.
Figure 14. CPU usage
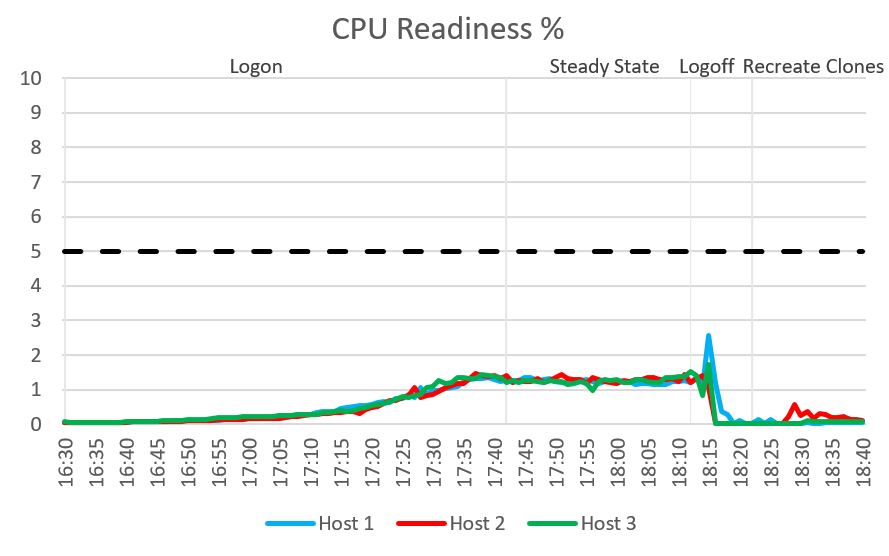
CPU readiness
CPU readiness remained at an acceptable level and well below the defined threshold. No anomalies were seen during testing.
Figure 15. CPU readiness
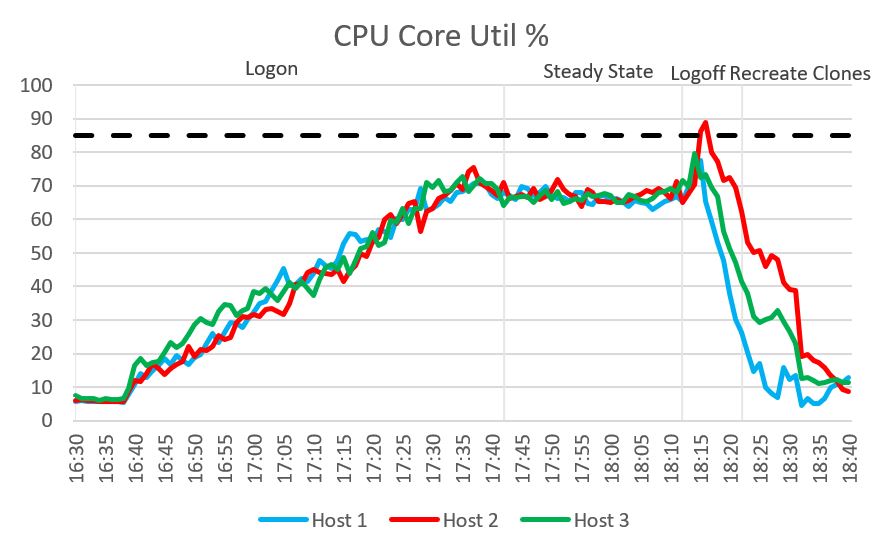
CPU core utilization
CPU core utilization steadily increased during the login phase and converged during the steady-state phase of the test. The compute nodes showed only slight variations in core utilization during the login phase, which appears to be a normal distribution of usage. No anomalies were seen during testing.
Figure 16. CPU core utilization
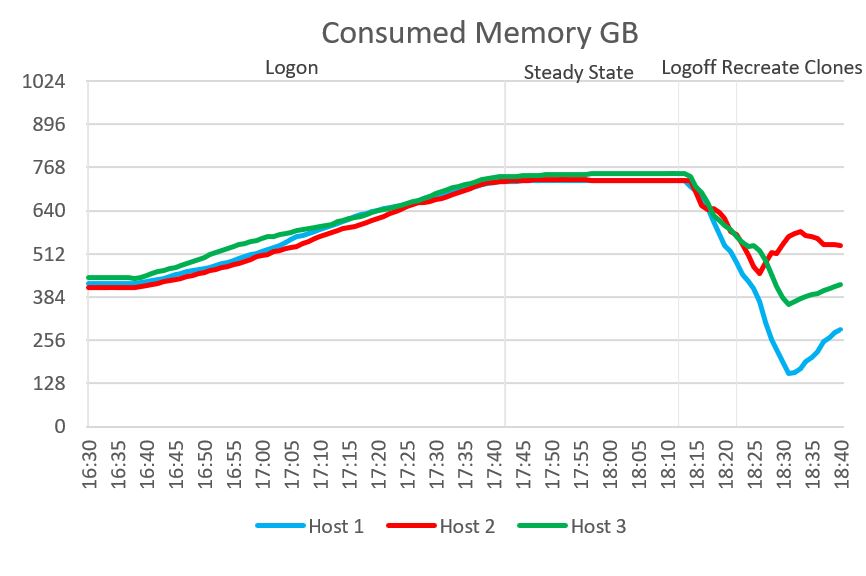
Memory
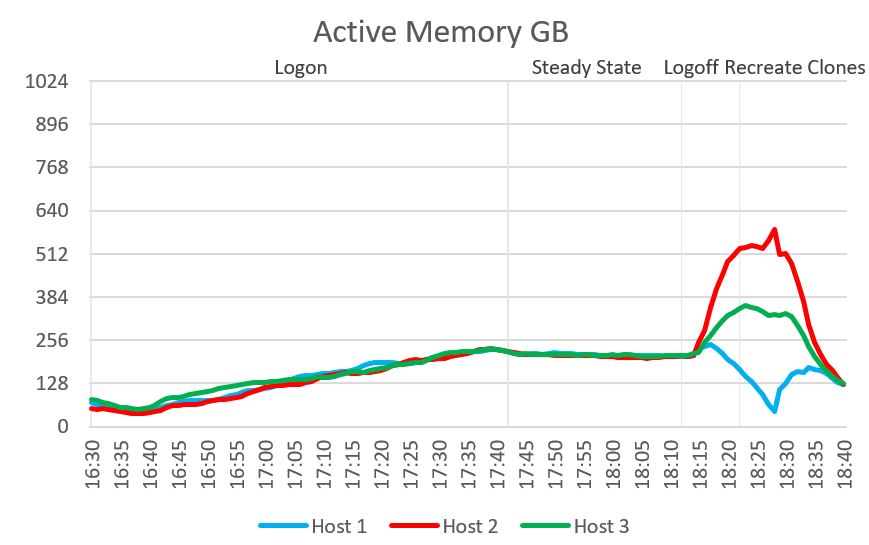
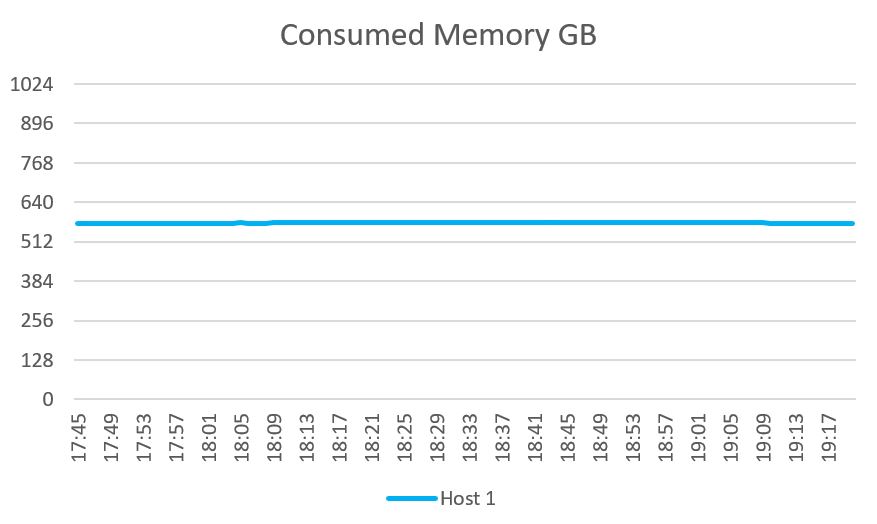
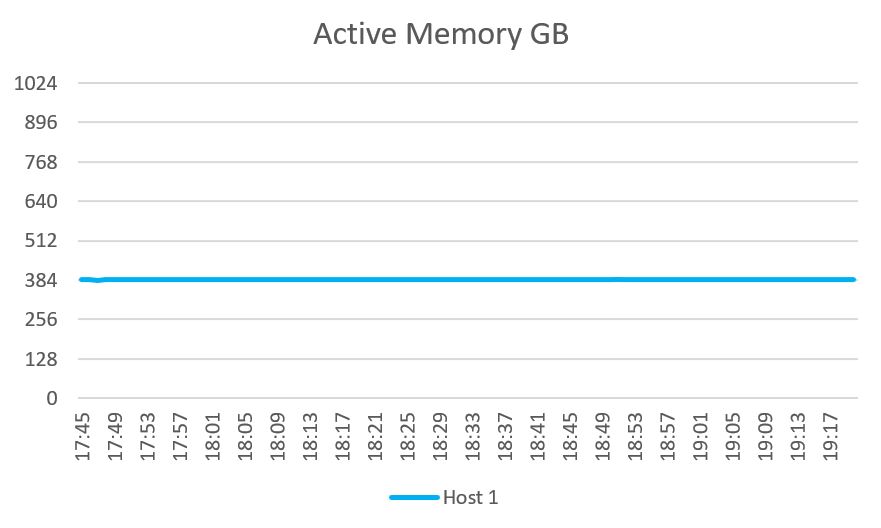
Consumed memory used up to three quarters of the physical capacity installed on each host but this was not enough to cause any memory ballooning or swapping. Active memory usage was quite low and steady during testing until the logging out and re-creation of the instant clones when there was a spike on one of the hosts. This was not a concern as the system was very busy at that point.
Figure 17. Consumed memory Figure 18. Active memory
Network usage
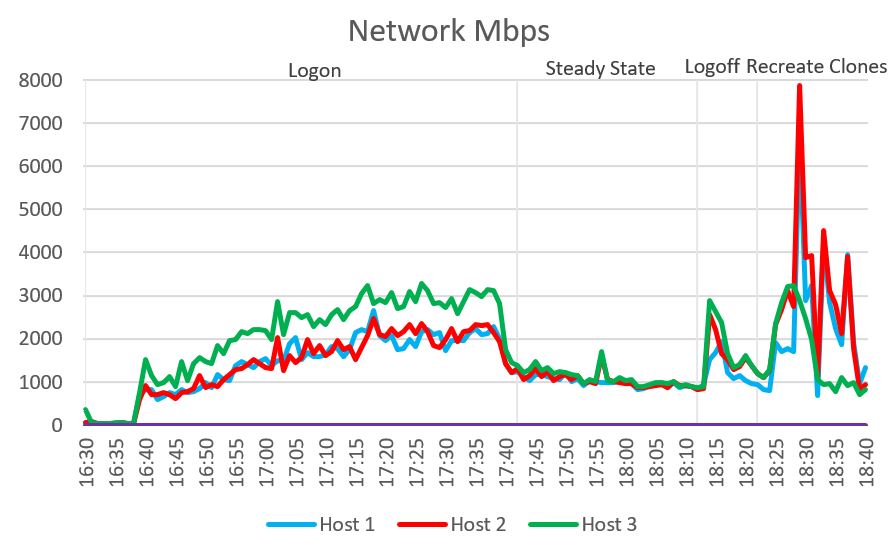
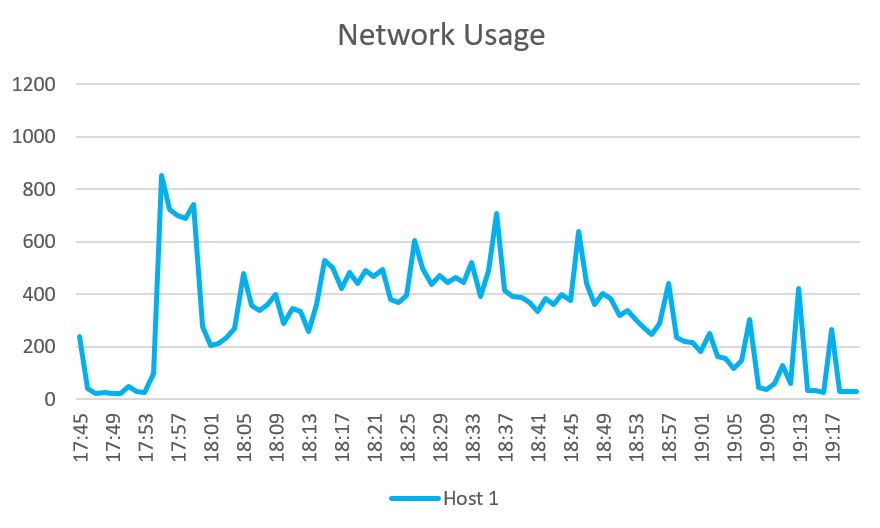
Network bandwidth steadily increased during the login phase and converged during the steady-state phase of the test. One of the compute nodes showed slightly higher network traffic during the login, steady state and logout phases, which does not appear to be abnormal and may be the result of hosting a VxRail management VM. The only anomaly seen during testing was a spike during the re-creation of the instant clones.
Figure 19. Network usage
Cluster IOPS
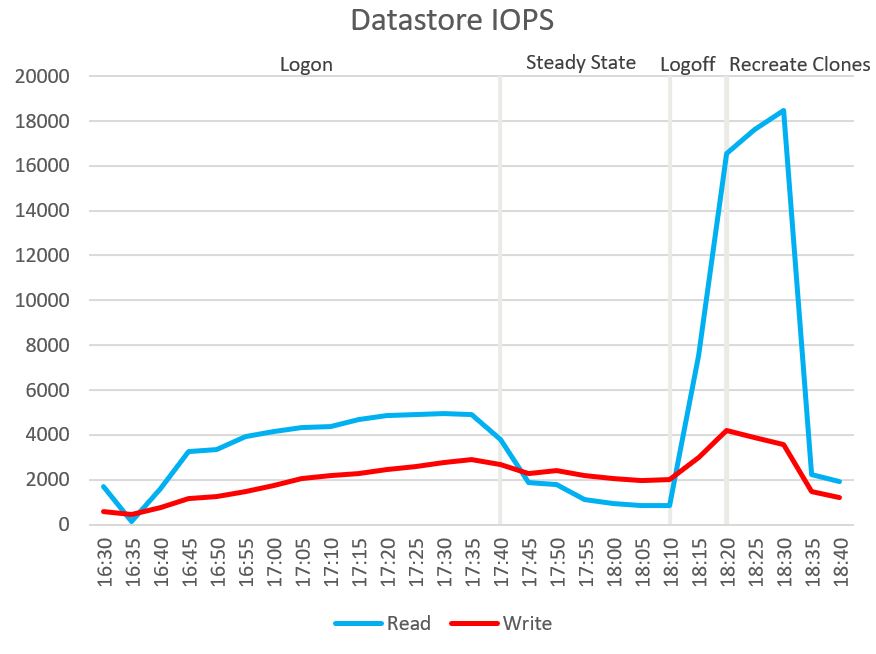
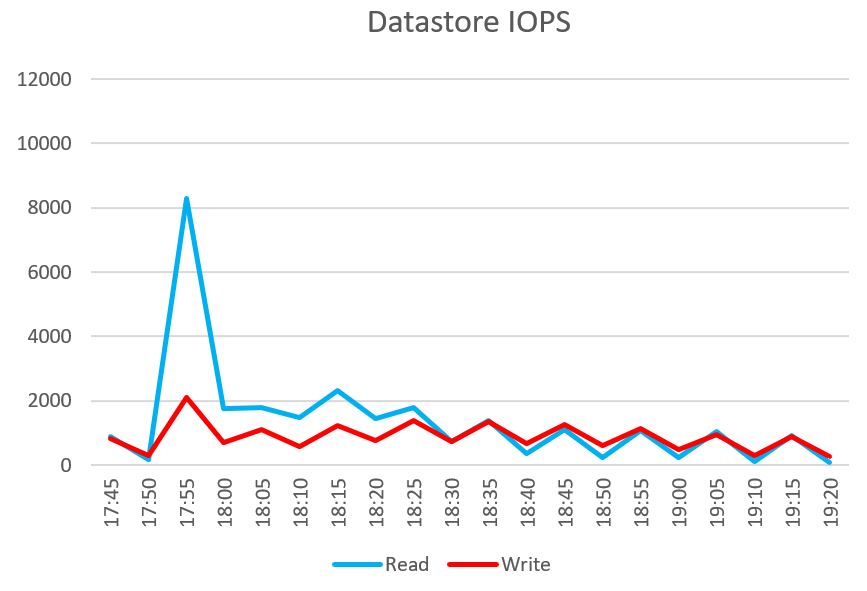
The total IOPS generated was as expected for testing with session hosts with higher write IOPS, especially as the systems logged off and wrote their profiles. No anomalies were noticed during testing.
Figure 20. Datastore IOPS
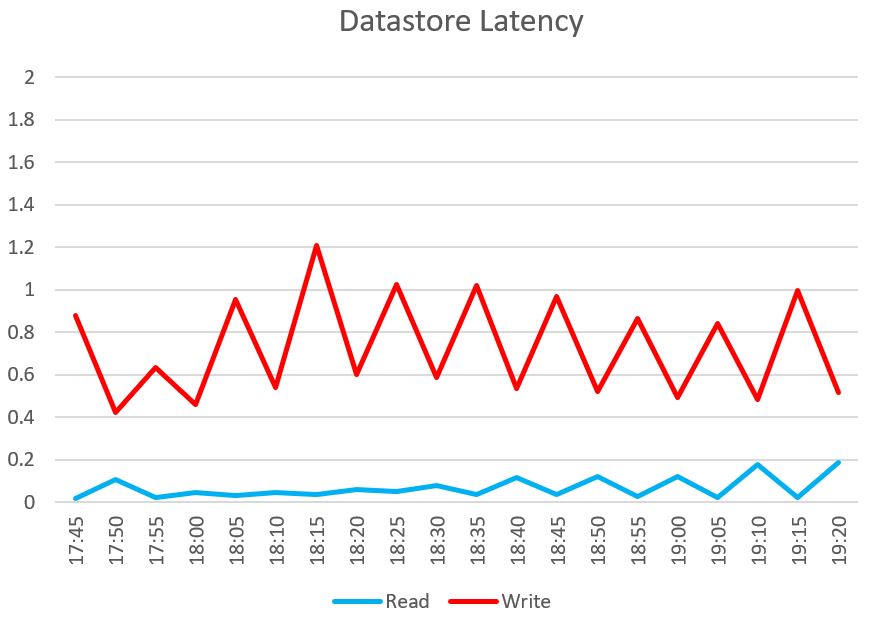
Disk I/O latency
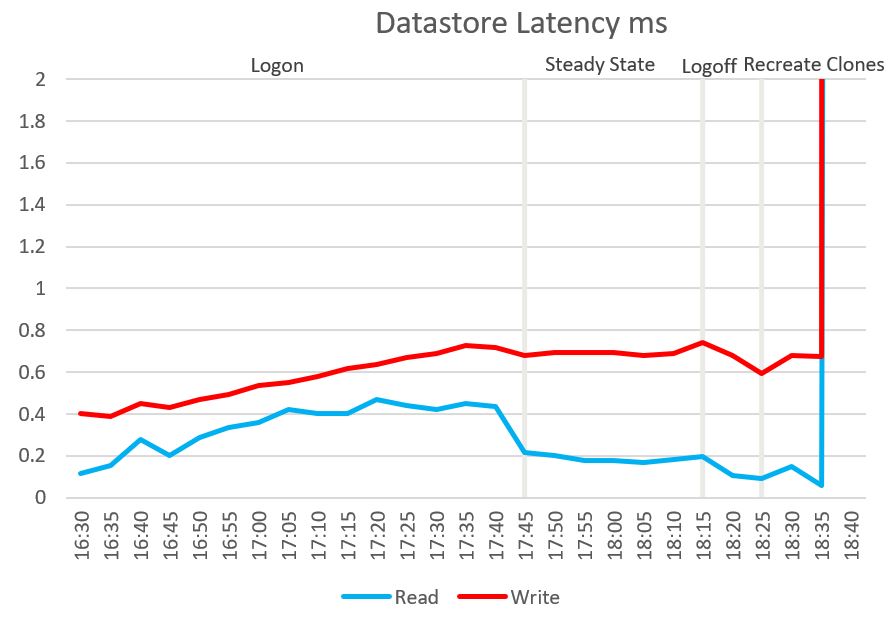
Disk latency on all physical nodes remained at an acceptable level through the test period and well below the defined threshold (20 ms). However, there was a large spike in latency after testing was completed during the re-creation of the instant clones. This is an unusual spike but it was not caused by the test load on the system, which remained very low throughout.
Figure 21. Datastore latency
User experience
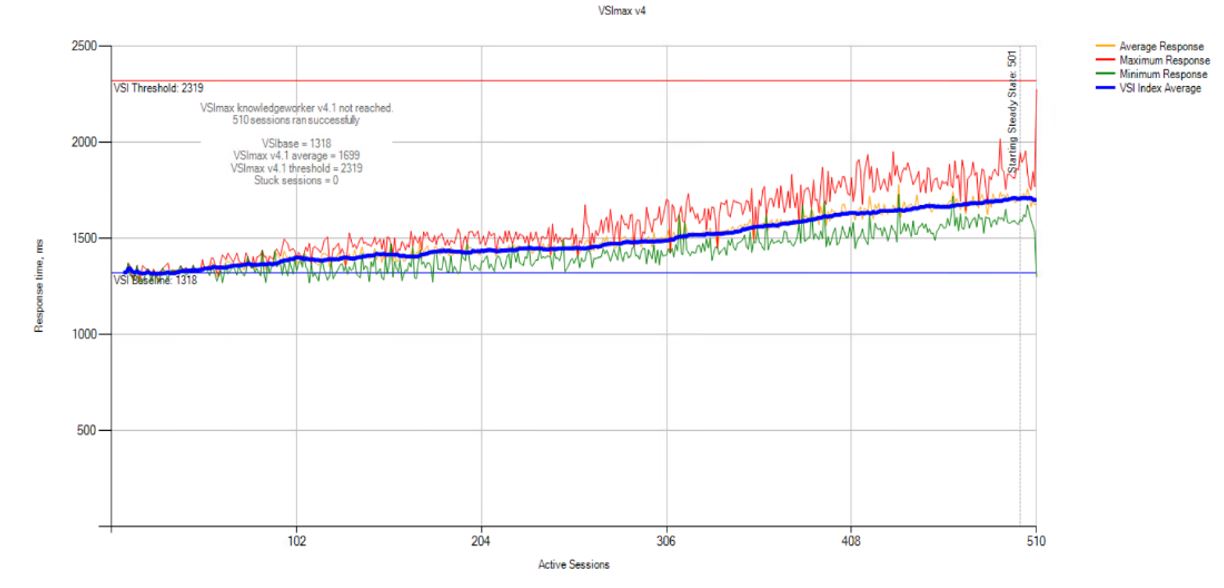
The baseline score for the Login VSI test was 1,318. This score falls in the 1200 to 1599 range rated as "Fair" by Login VSI. For more information about Login VSI baseline ratings and baseline calculations, see VSImax baseline scores.
As indicated by the blue line, the system reached a VSImax average score of 1,699 when 510 sessions were loaded. This value is well below the VSI threshold score of 2,319 set by the Login VSI tool. During the testing, VSImax was never reached, which typically indicates a stable system and a better user experience.
When manually interacting with the sessions during the steady-state phase, the mouse and window movement were responsive and video playback was good. No "stuck sessions" were reported during the testing, indicating that the system was not overloaded at any point.
Figure 22. User experience
NVIDIA nVector Knowledge Worker test results
The NVIDIA nVector testing was run with 128 VMs on a single host. VMWare Blast was the remote display protocol used. This host contained 2 NVIDIA A16 GPUs. The 128 user sessions equalled 2 users per instance.
GPU usage
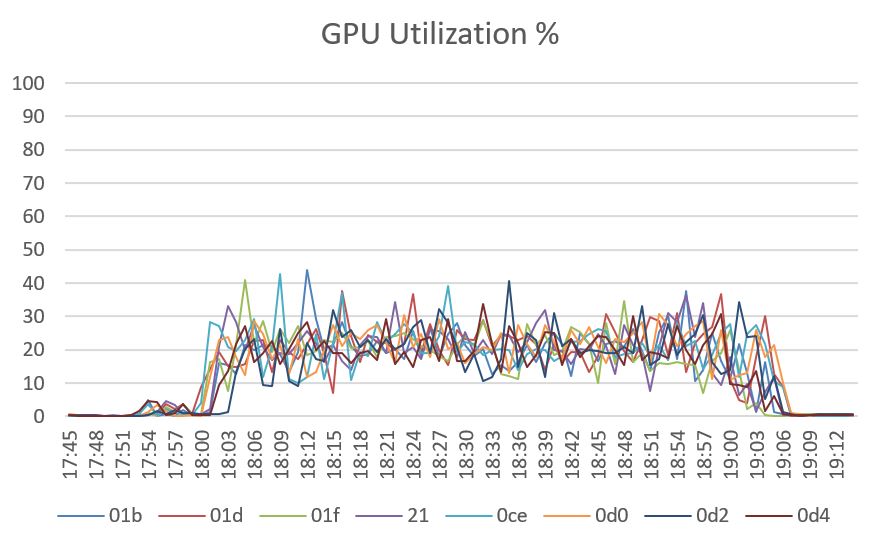
GPU usage is gathered directly from vCenter and was quite consistent through the test period. The eight metrics represent the four GPUs chips on each of the two NVIDIA A16 GPU cards. The graph shows that even with 128 vGPU-enabled VMs, the nVector Knowledge Worker workload did not put a heavy load on the GPUs. More graphics-heavy workloads like Specview Perf would have a much higher GPU load in this situation.
Figure 23. GPU usage
Frame rate
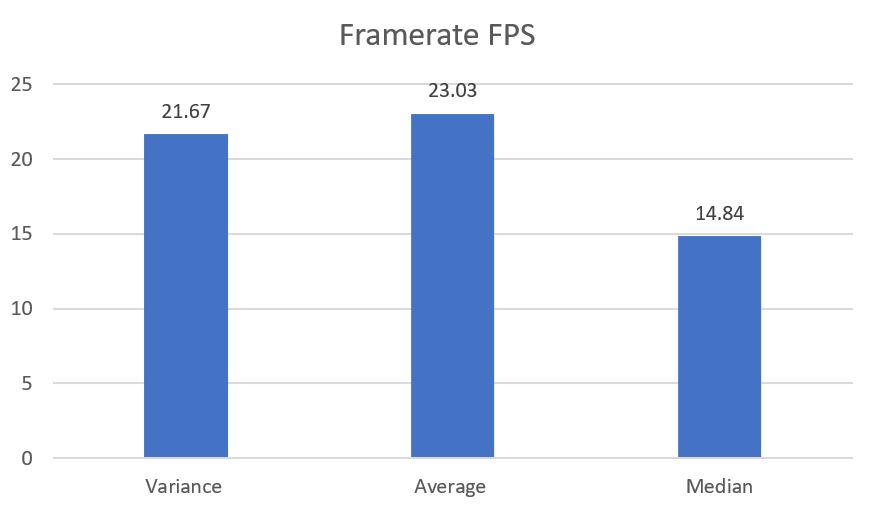
The frame rate measures the rate at which frames are delivered on the screen of the endpoint device and indicates how smooth the user experience is. An average of 23 frames per second indicates an end-user would experience smooth visuals at their endpoint and the high variance indicates some users would experience jumps to lower or higher frame rates at different points during the test.
Figure 24. Frame rate
End-user latency
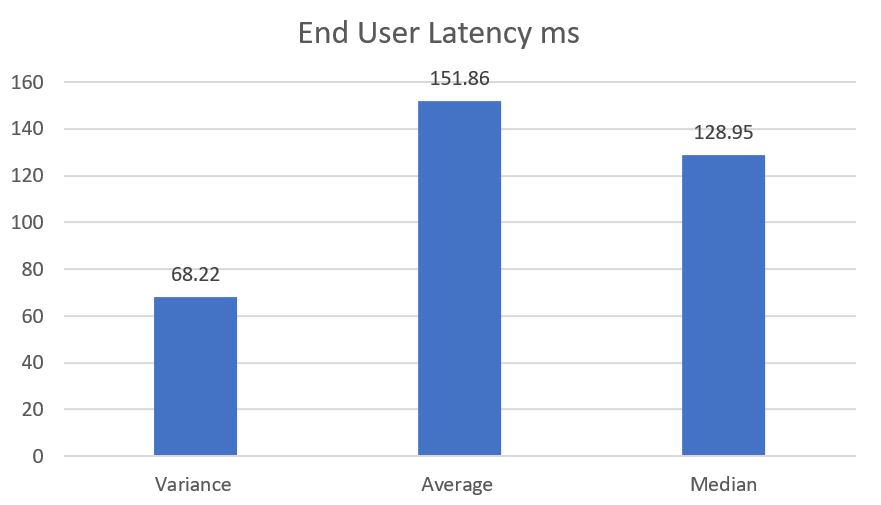
The end-user latency metric measures the amount of lag experienced by a user. Average end-user latency is approximately 150 ms, which is good for 128 user sessions running at the same time. There is some latency variance, so that while the user experience should be good overall, there would be some occasional minor spikes.
Figure 25. End-user latency
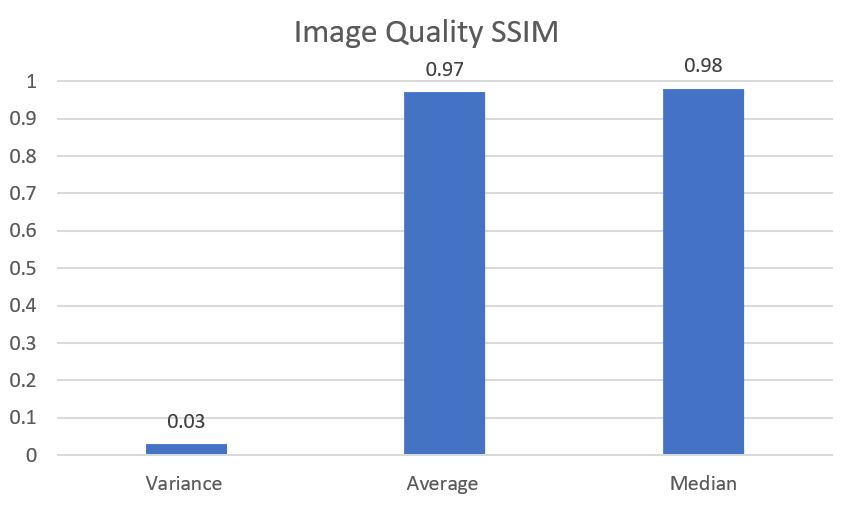
Image quality
The SSIM metric is the structural similarity of screenshots taken from the VDI desktop and the endpoint. The average image quality is 0.97 of the original screenshot, which is very good for 128 nVector sessions running on a single host across two A16 GPUs. Image quality variance was very low.
Figure 26. Image quality
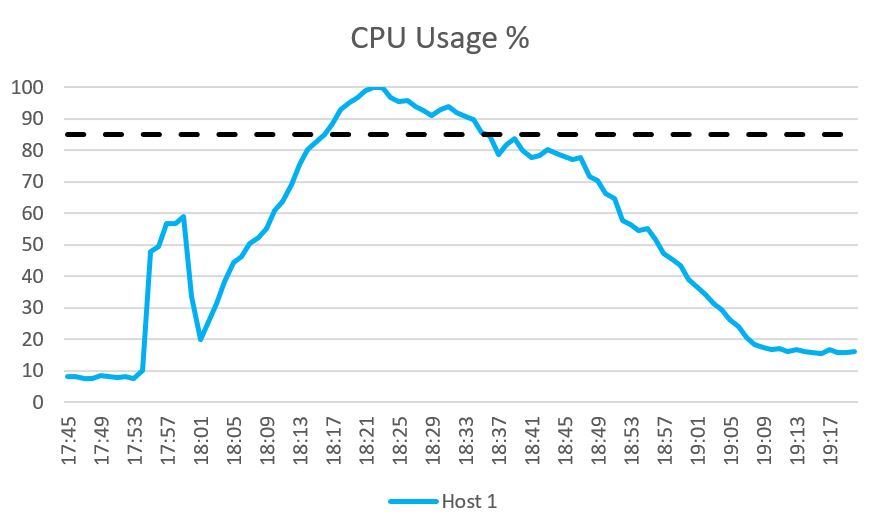
CPU usage
This CPU usage graph only shows the CPU usage for the host with the A16 GPUs installed as all the VMs ran on this host. CPU usage peaked briefly at 100 percent as all the user sessions had logged in and were running their workloads. This indicates that 128 nVector Knowledge Worker sessions was the maximum that this host could handle. The early spike in usage was caused by nVector logging in the VMs and starting the workload.
Figure 27. CPU usage
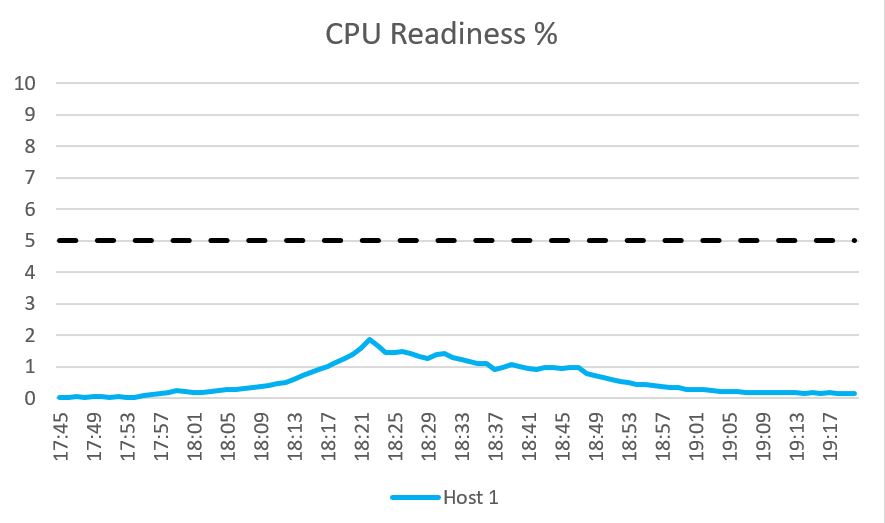
CPU readiness
CPU readiness remained at an acceptable level and well below the defined threshold. No anomalies were seen during testing.
Figure 28. CPU readiness
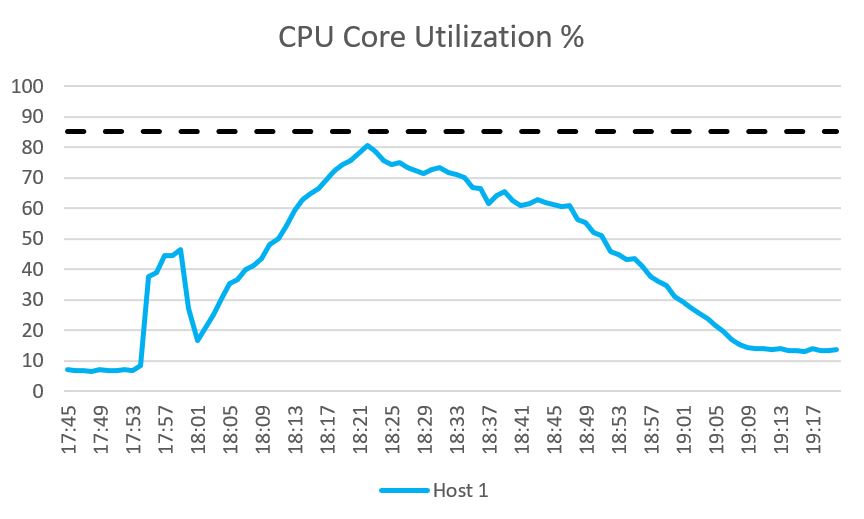
CPU core utilization
No anomalies were seen in CPU core utilization during testing.
Figure 29. CPU core utilization
Memory
Both active and consumed memory showed no variations during the test run as all memory was reserved on VMs containing a vGPU.
Figure 30. Consumed memory Figure 31. Active memory
Network usage
Network usage was low during the test with the only spike during the login and workload start of the desktops. This spike was also seen in the CPU and datastore metrics.
Figure 32. Network usage
Cluster IOPS
Datastore IOPS were very low during testing, indicating that vGPU testing with 128 users does not cause much load on the datastore. The only notable item was the spike in read IOPS as users logged in at the start of testing.
Figure 33. Cluster IOPS
Disk I/O latency
Disk latency on the VSAN datastore remained at an acceptable level through the test period and well below the defined threshold (20 ms).
Figure 34. Disk I/O latency
Test results summary
Overview
The Dell VDI team has provided extensive performance testing results and guidance based on the PAAC testing carried out with the Login VSI Knowledge Worker. The 3rd Generation Intel Xeon Scalable processors in our Memory-Optimized configuration provide performance, density, and agility for your VDI workloads.
The configurations for the VxRail appliances are optimized for VDI. We selected the memory and CPU configurations that provide optimal performance.
Dell Technologies offers comprehensive, flexible, and efficient VDI solutions that are designed and optimized for your organization's needs. Our VDI solutions are easy to plan, deploy, and run. Dell Validated Design for VDI offer several key benefits to customers, including:
Rapid deployment and scaling
Access from anywhere, any device
Hardened security
High performance
Predictable cost of ownership
Dell Technologies comprehensive support
With VDI solutions from Dell Technologies, you can streamline the design and implementation process and be assured that you have a solution that is optimized for performance, density, and cost-effectiveness.
User density recommendations
The recommended user densities in the following table were achieved during the performance testing on VxRail appliances. We followed the VMware best practices of FTT = 1 and configured a reserved slack space of 30 percent. Login VSI Knowledge Worker and nVector Knowledge Worker were tested with Windows 10 22H2 64bit and Microsoft 365 with Office Apps. We implemented all mitigations to patch the Spectre, Meltdown, and L1TF vulnerabilities at the hardware, firmware, and software levels to ensure an improved performance impact, which is reflected in the achieved user densities.
The following table shows the recommended user densities: