
Multiple VM Testing
Multiple VM Testing
-
Description
The Purpose of the multiple VM testing was to determine how the performance changes as more VMs were added to a system. We started the testing using three T4 GPUs and an NVIDA GRID setup allocating 25% of the GPU processing and buffer to each VM (T4-4Q).
Each VM was allocated:
- 12 GB of memory instead of 8 because we were seeing occasional VM memory warnings with the minimal 8 GB allocation and we did not want that to affect the test.
- 4 vCPUs and 25% of a single GPU was allocated by the NVIDIA GRID driver as a vGPU.
The test was run with 2 camera streams running to each VM.
Results
We looked at the performance of all the VMs. We determined that the performance of the first VM to be activated was the best way to show how the performance of a single VM varied as VMs were added.
Effects of adding VMs on performance
The following graph shows the effect of adding VMs and camera streams to the system. Notice that adding VMs seven and 8 shows the largest drop in performance relative to the others. At this point GPU-0 and GPU-1 have three VMs and six camera streams to process, while GPU-2 has only 2 VMs and 4 camera streams to process. While the average processed fps doesn’t drop by much, the confidence becomes smaller faster.

Series1 – Average fps
Series2 – 90% confidence
Series3 – 95% confidence
Figure 10 Effect of adding VMs on performance
The following graph shows the effect on the performance of a single VM while seven more VMs are added, one at a time. The expected performance is 12 fps. The variance in the performance increases and the overall performance decreases in the same manner as the previous graph.

Figure 11 Processed Frames Per Second from Application Profile Tool
The following graph shows GPU, CPU, frame buffer and VM memory utilization from the perspective of one VM. This VM was the first VM started and seven more VMs were added. Each VM added appears to decrease CPU utilization and increase GPU utilization. At the right end of the graph there are 6 camera streams on this GPU but only using 75% of the available GPU cores and buffer (T4-4Q). Note that the frame buffer is at 85%.but that it stays constant as VMs are added.

Figure 12 GPU and System Performance with 1-8 VMs
The following graph shows GPU, CPU, frame buffer and VM memory utilization from the perspective of one VM. This VM was the eighth and last VM started. You can compare this to the previous graph and see that the profiles are very similar. At the right end of the graph there are 6 camera streams on this GPU but only using 75% of the available GPU cores and buffer (T4-4Q). This profile is for 25% of the total GPU resources. Note that the frame buffer is at 82% which is only slightly lower than the 1st VM profile.
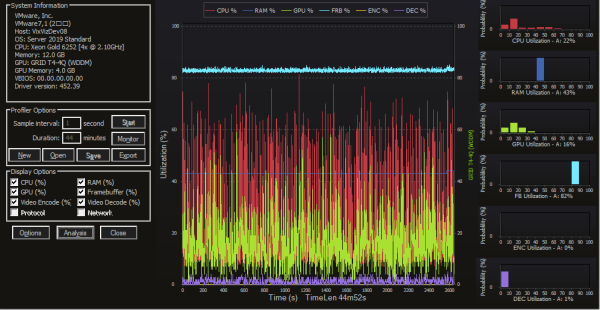
Figure 13 GPU and System Utilization from 8th VM perspective
This graphic shows the GPU power, utilization and temperature profiles as well as showing that as the VMs were brought online the assignment to a GPU maximized the dispersion of the load across the GPUs. VM-1 was assigned to GPU-0, VM-2 was assigned to GPU-1, and so forth. The VMs were named in order from Dev01 to Dev08.
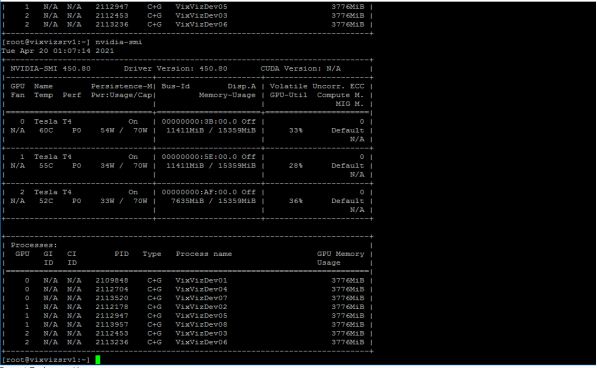
Figure 14 Output of nvidia-smi Utility