We conducted PAAC testing on this solution using the Login VSI load- generation tool. Login VSI is an industry-standard tool for benchmarking VDI workloads. It uses a carefully designed, holistic methodology that monitors both hardware resource utilization parameters and EUE during load testing.
Login VSI Task Worker
We performed this test with the Login VSI Task Worker workload on a 3-node VxRail cluster (see Table 2). We created the RDSH VMs using VMware Horizon instant clone technology and used the VMware Horizon Blast Extreme display protocol. We populated each compute host with 12 RDSH VMs.
CPU usage
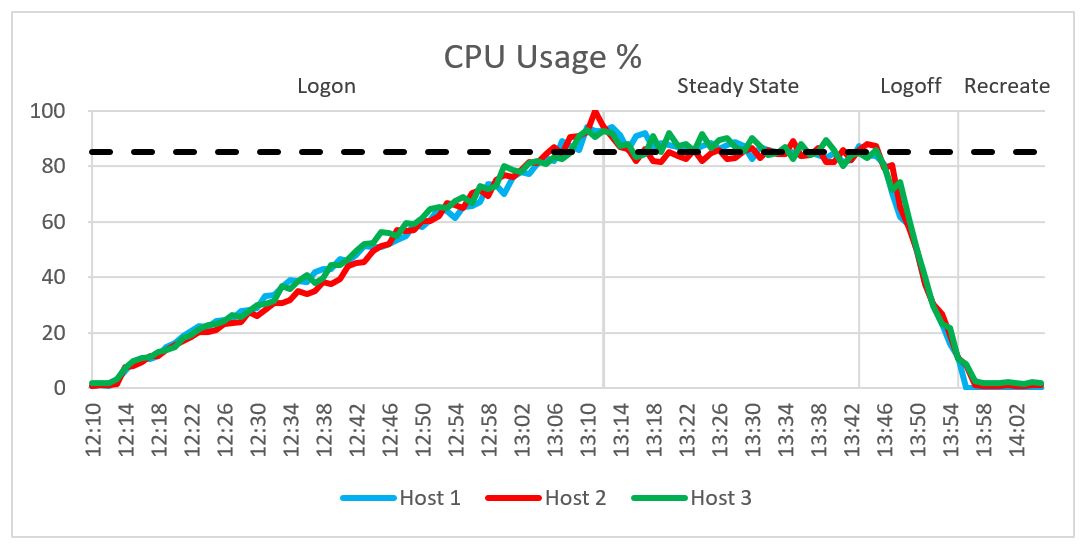
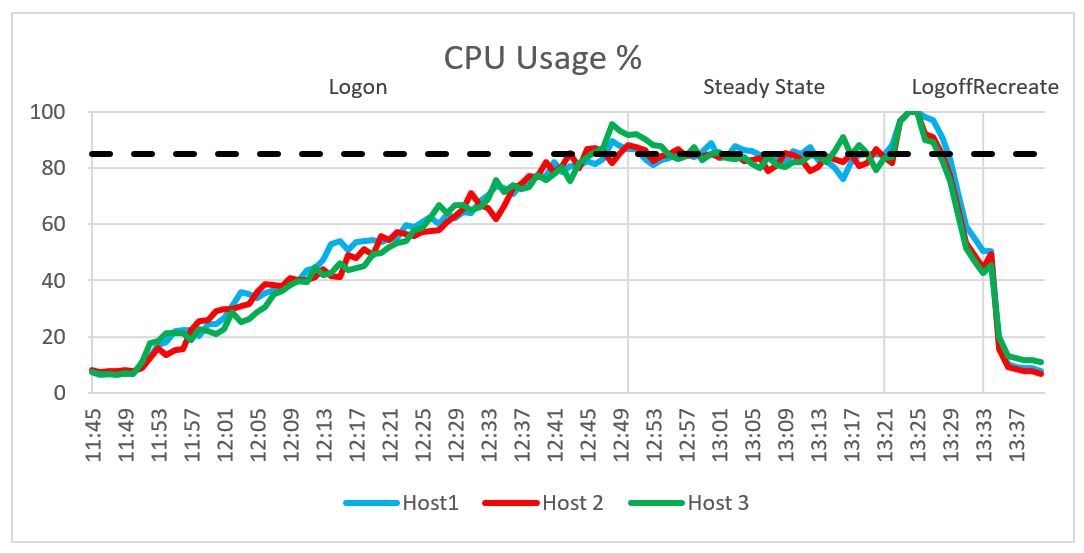
The following graphs show the CPU utilization across the three hosts during testing. CPU usage with all VMs powered on was approximately 1.8 percent before the test started. The CPU usage steadily increased during the login phase, as shown in the following figure.
Figure 5. CPU usage
During the steady state phase, an average CPU utilization of 86 percent was recorded. This value is close to the pass/fail threshold that we set for average CPU utilization (see Table 4). To maintain good EUE, do not exceed this threshold. You can load more user sessions while exceeding this threshold for CPU, but you might experience a degradation in user experience.
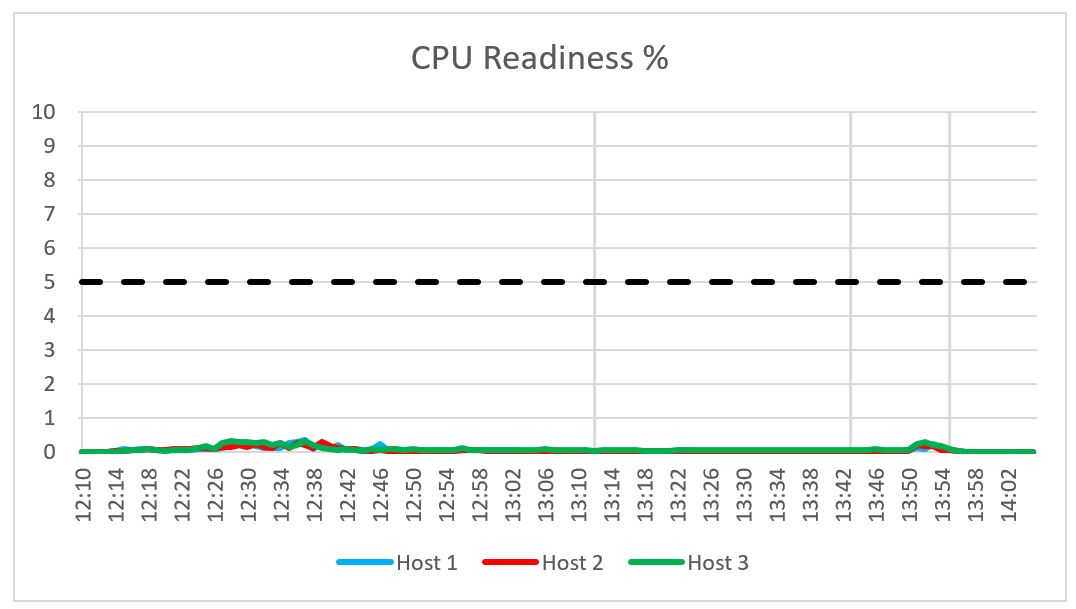
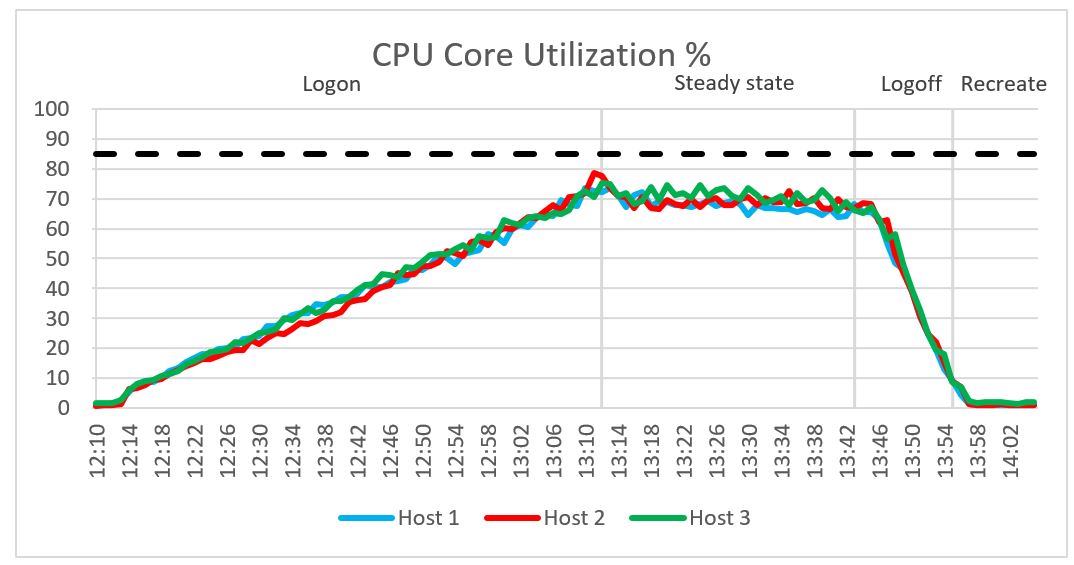
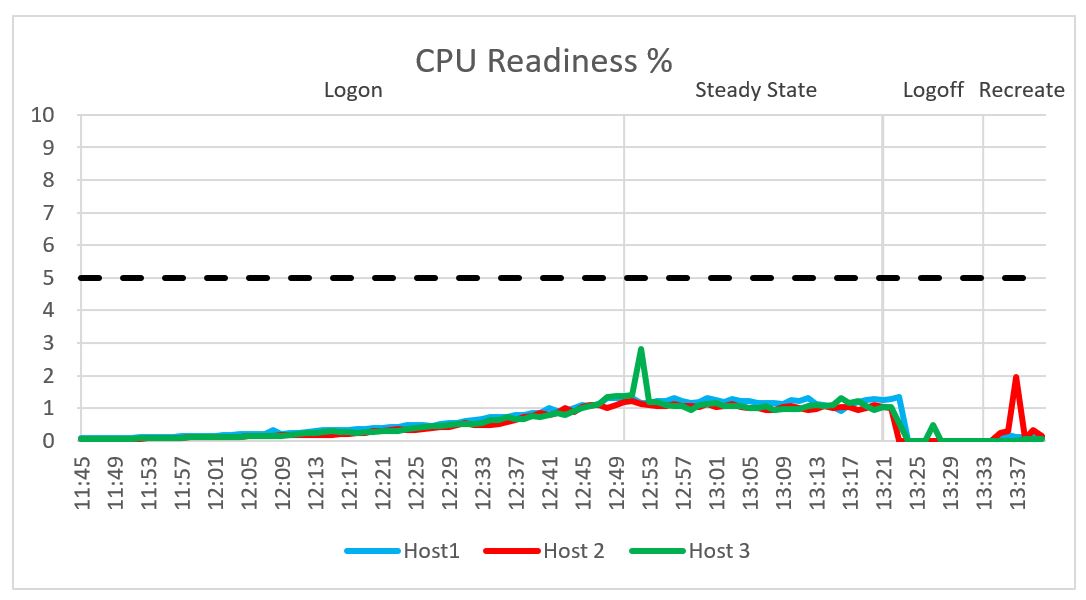
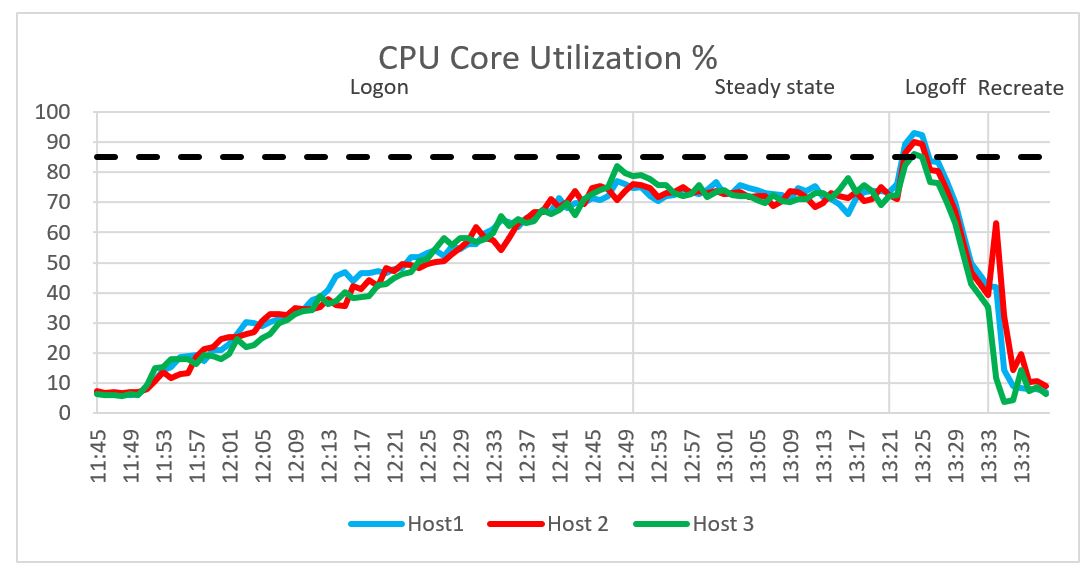
As shown in the following figure, the CPU readiness was well below the 5 percent threshold that we set. The average steady state CPU core utilization across the four hosts was 69 percent, as shown in the second figure.
Figure 6. CPU readiness Figure 7. CPU core utilization
Memory
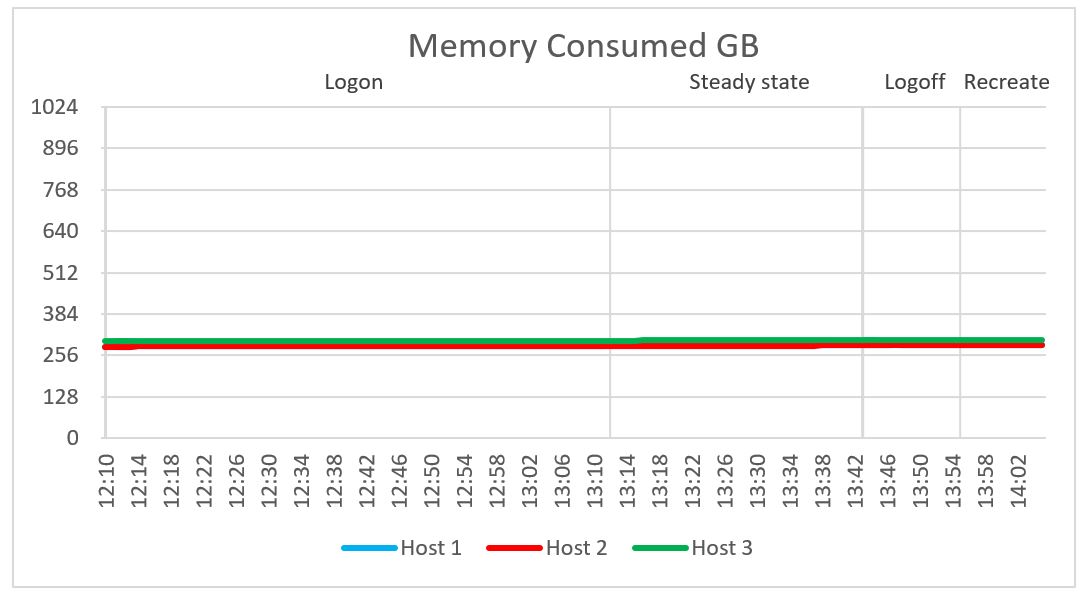
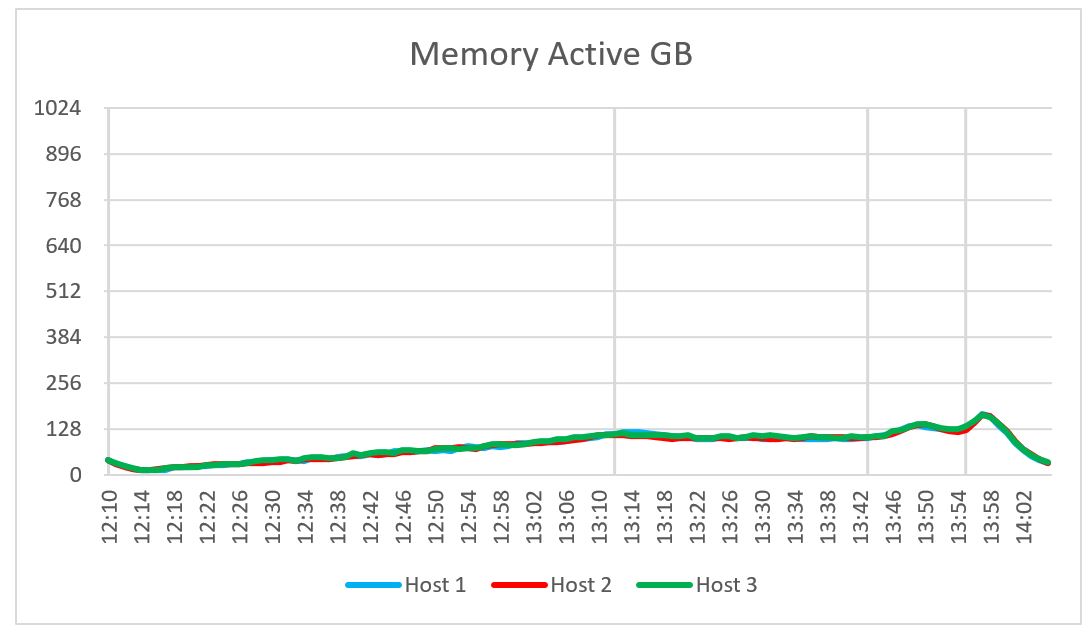
We observed no memory constraints during the testing on the compute hosts. Out of 1024 GB of available memory per node, the compute host reached a maximum consumed memory of 303 GB and a steady state average of 303 GB. Active memory usage reached a maximum active memory of 170 GB and recorded a steady state average memory of 109 GB. There was no memory ballooning or swapping on the hosts. The following figures show consumed and active memory.
Figure 8. Memory consumed Figure 9. Memory active
Network usage
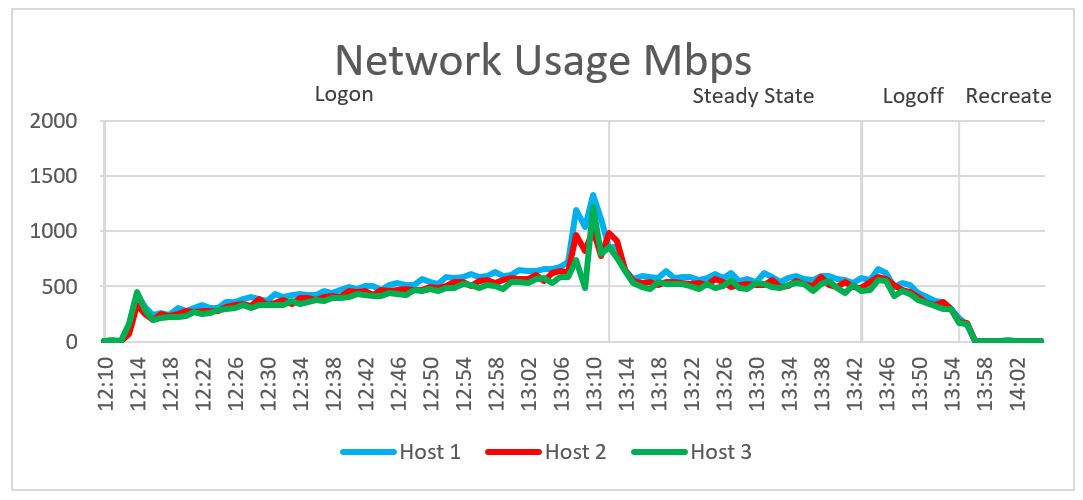
Network bandwidth was not an issue during testing. The network usage recorded a steady state average of 563 Mbps. The busiest period for network traffic was immediately after all users had logged in when a peak value of 1,333 Mbps was recorded. The following figure shows network usage:
Figure 10. Network usage
VxRail cluster IOPS
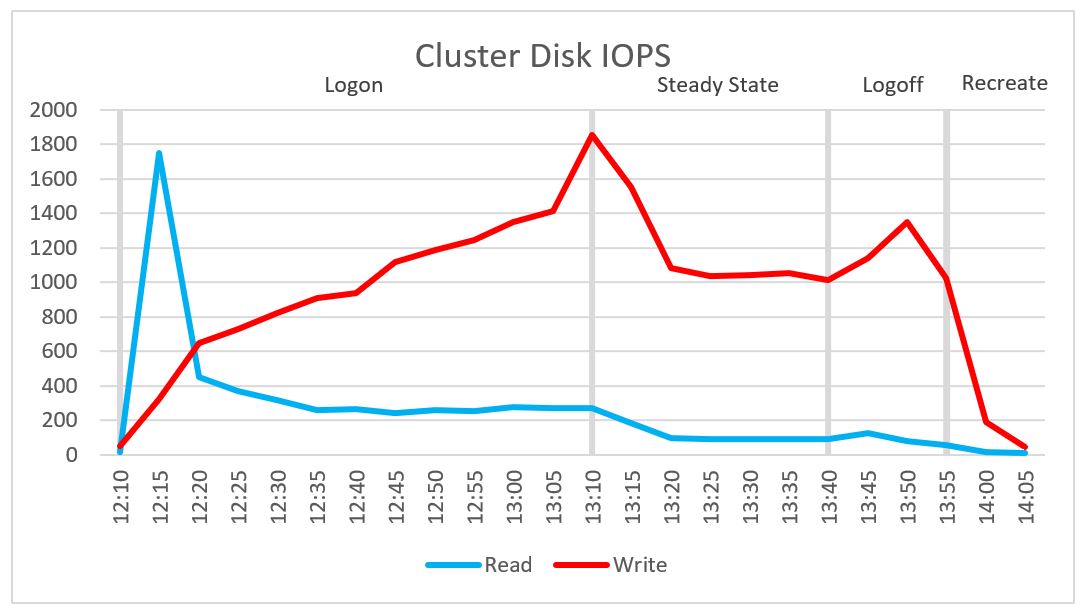
Cluster IOPS reached a maximum value of 186 for read IOPS and 1,550 for write IOPS during the steady state phase. The average steady average IOPS were 1,406. The following figure shows cluster IOPS:
Figure 11. Cluster IOPS
VxRail disk I/O Latency
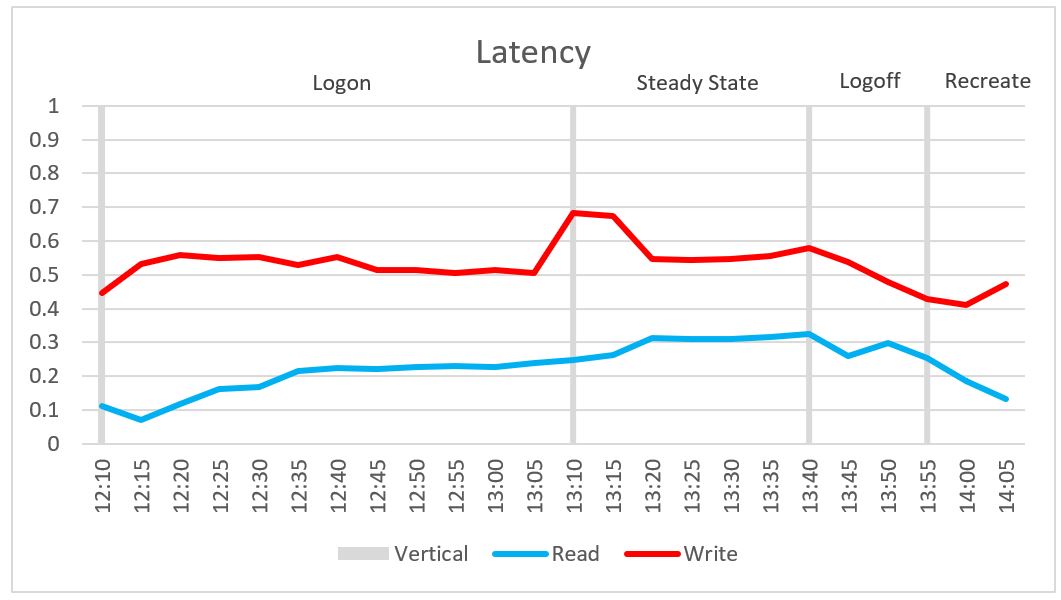
Cluster disk latency reached a maximum read latency of 0.309 milliseconds and a maximum write latency of 0.604 milliseconds during the steady state phase. The average steady state latency was 0.44 milliseconds. The following figure shows disk I/O latency:
Figure 12. Disk I/O Latency
Login VSI Knowledge Worker
We performed this test with the Login VSI Knowledge Worker workload on a 3-node VxRail cluster (see Table 2). We created the desktop VMs using VMware Horizon instant clone technology and used the VMware Horizon Blast Extreme display protocol. We populated each compute host with 230 desktop VMs.
CPU usage
The following graphs show the CPU utilization across the three hosts during the testing. CPU usage with all VMs powered on was approximately 7 percent before the test started. The CPU usage steadily increased during the login phase, as shown in the following figure.
Figure 14. CPU usage
During the steady state phase, an average CPU utilization of 84 percent was recorded. This value is close to the pass/fail threshold that we set for average CPU utilization (see Table 4). To maintain good EUE, do not exceed this threshold. You can load more user sessions while exceeding this threshold for CPU, but you might experience a degradation in user experience.
As shown in the following figure, the CPU readiness was well below the 5 percent threshold that we set. The average steady state CPU core utilization across the four hosts was 72 percent, as shown in the second figure.
Figure 15. CPU readiness Figure 16. CPU core utilization
Memory
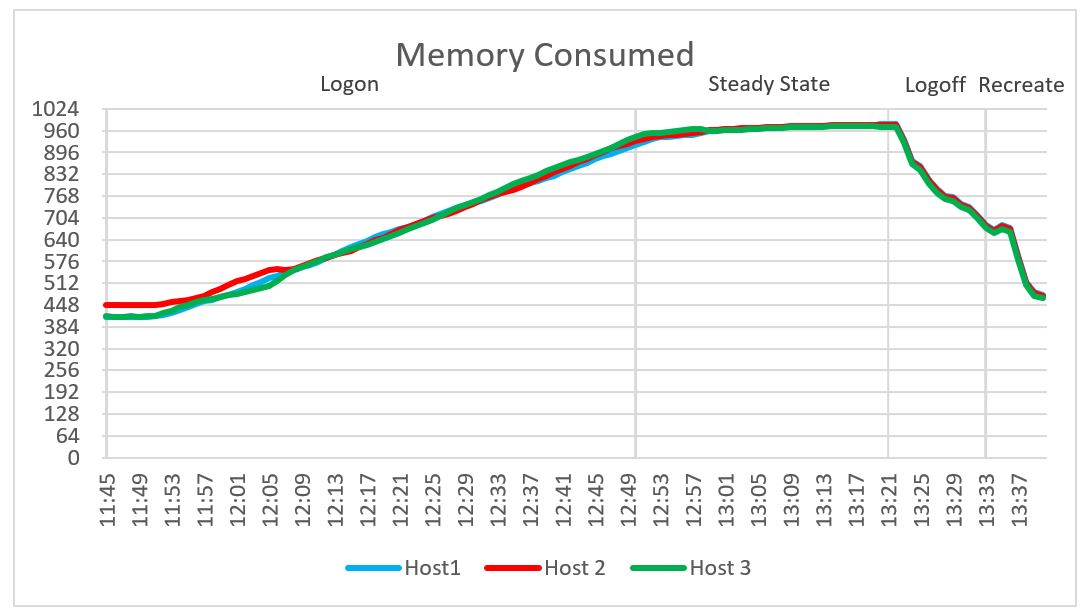
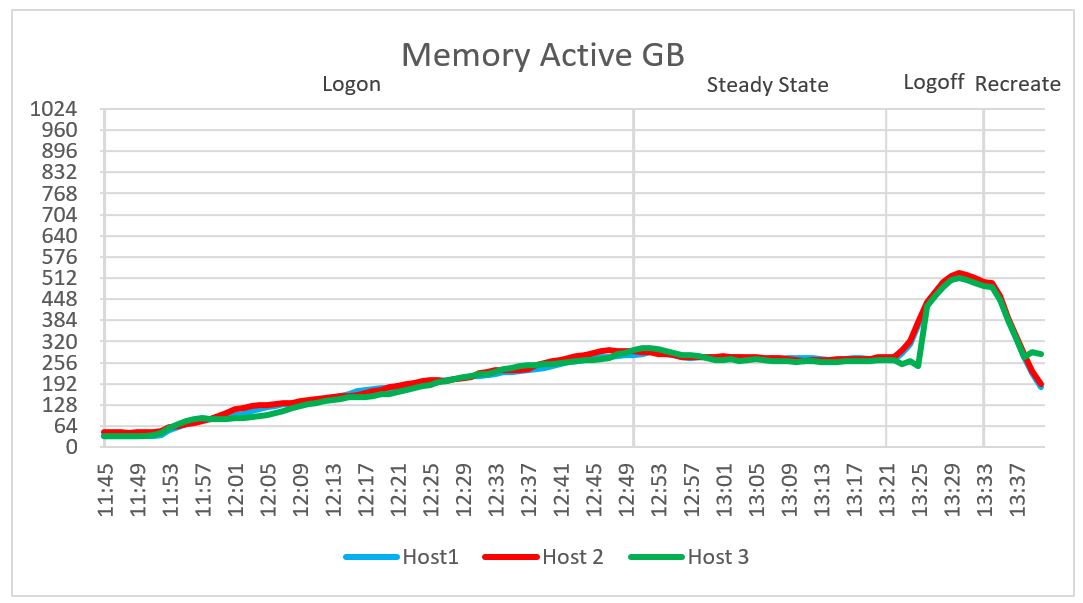
We observed no memory constraints during the testing on the compute hosts. Out of 1024 GB of available memory per node, the compute host reached a maximum consumed memory of 977 GB and a steady state average of 969 GB. Active memory usage reached a maximum active memory of 540 GB and recorded a steady state average memory of 260 GB. There was no memory ballooning or swapping on the hosts. The following figures show consumed and active memory.
Figure 17. Memory consumed Figure 18. Memory active
Network usage
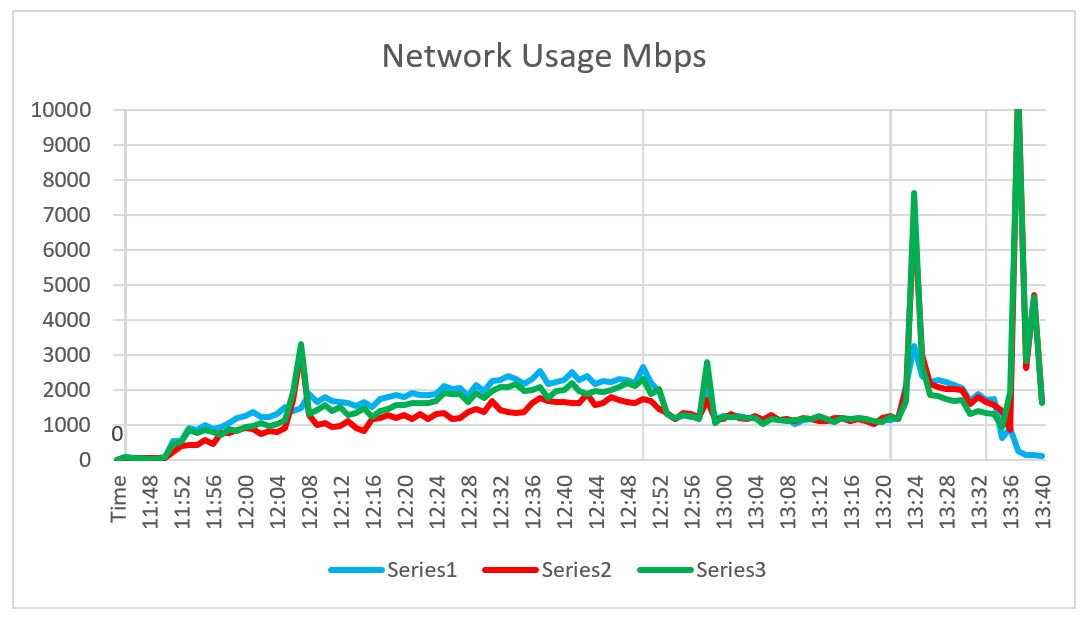
Network bandwidth was not an issue during testing. The network usage recorded a steady state average of 1286 Mbps. The busiest period for network traffic was during the re-create phase when a peak value of 10,000 Mbps was recorded. The following figure shows network usage:
Figure 19. Network usage
VxRail cluster IOPS
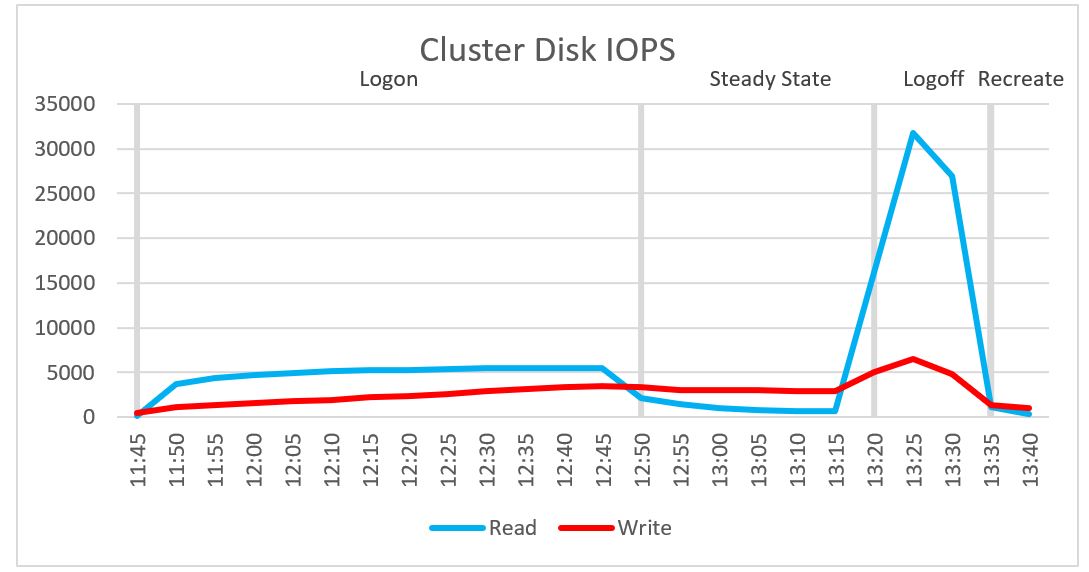
Cluster IOPS reached a maximum value of 1,458 for read IOPS and 3,039 for write IOPS during the steady state phase. The average steady average IOPS were 2,109. The following figure shows cluster disk IOPS:
Figure 20. Cluster disk IOPS
VxRail disk I/O latency
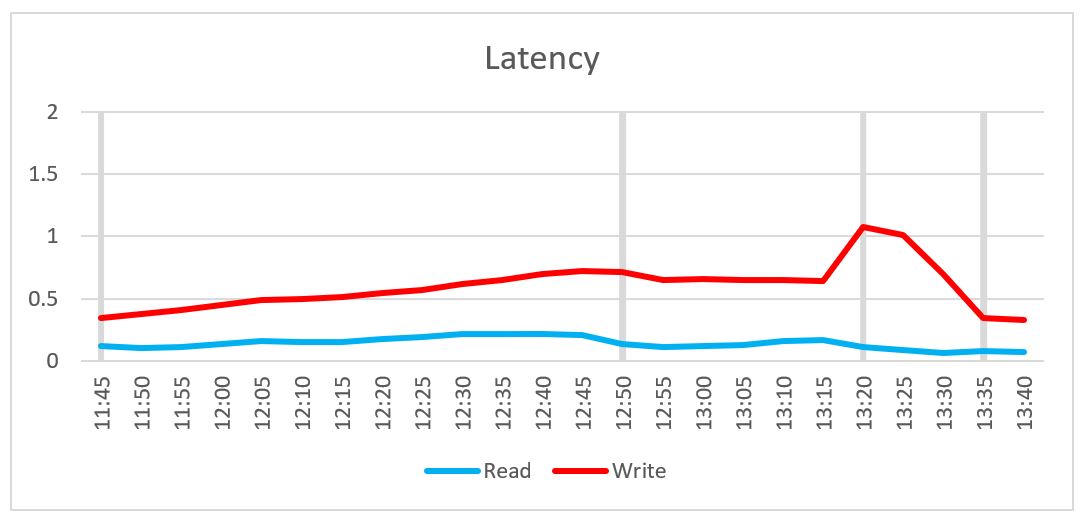
Cluster disk latency reached a maximum read latency of 1.187 milliseconds and a maximum write latency of 0.645 milliseconds during the steady state phase. The average steady state latency was 0.39 milliseconds. The following figure shows disk I/O latency:
Figure 21. Disk I/O latency
User experience
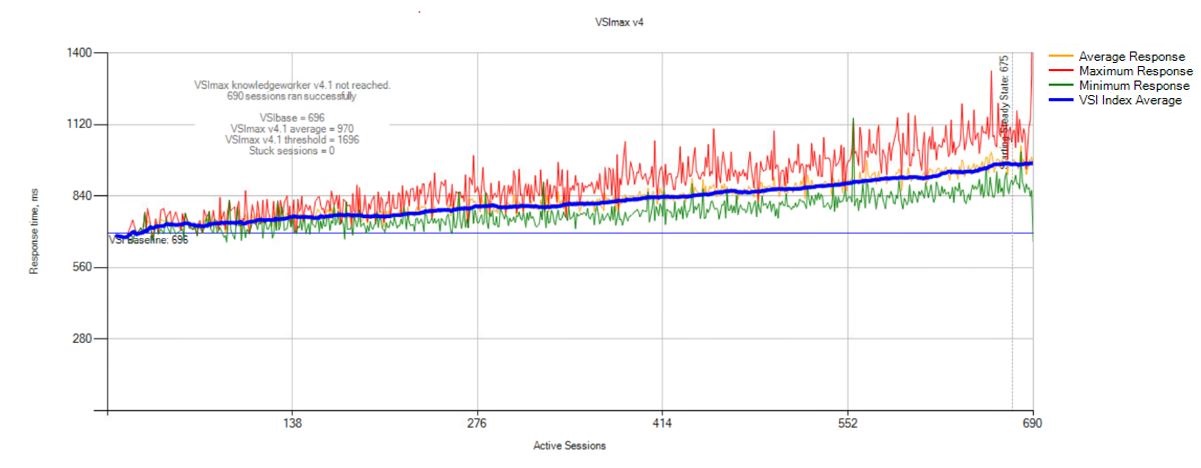
The baseline score for the Login VSI test was 696. This score falls in the 0 to 799 range rated as "Very Good" by Login VSI. For more information about Login VSI baseline ratings and baseline calculations, see VSImax baseline scores. As indicated by the blue line in the following figure, the system reached a VSImax average score of 970 when 690 sessions were loaded. This value is well below the VSI threshold score of 1,696 set by the Login VSI tool. During testing, VSImax was never reached, which typically indicates a stable system and a better user experience.
The Login VSImax user experience score for this test was not reached. When manually interacting with the sessions during the steady state phase, the mouse and window movement were responsive, and video playback was good. No "stuck sessions" were reported during the testing, indicating that the system was not overloaded at any point. See Appendix A, which explains the Login VSI metrics.