This appendix contains further details on the test results for the four dual workload test cases. The graphs shown here have time marked on the X axis and the metric marked on the Y axis.
Performance metrics
The graphs in this section present the following metrics:
- CPU utilization
- GPU utilization
- GPU memory
- vSAN cluster latency
- Login VSI user experience
These represent the key results. Additional metrics that we collected during the performance testing included CPU core utilization and readiness, CPU active and consumed memory, network usage, and cluster disk IOPS.
Test results for dual workload test cases
The four dual workload test cases that this section describes are:
- Dual Workload AI Training and VDI Medical Knowledge Worker Both GPU Enhanced
- Dual Workload AI Validation and VDI Medical Knowledge Worker Both GPU Enhanced
- Dual Workload AI Training CPU Only and VDI Medical Knowledge Worker GPU Enhanced
- Dual Workload AI Validation CPU Only and VDI Medical Knowledge Worker GPU Enhanced
Dual Workload AI Training and VDI Medical Knowledge Worker Both GPU Enhanced
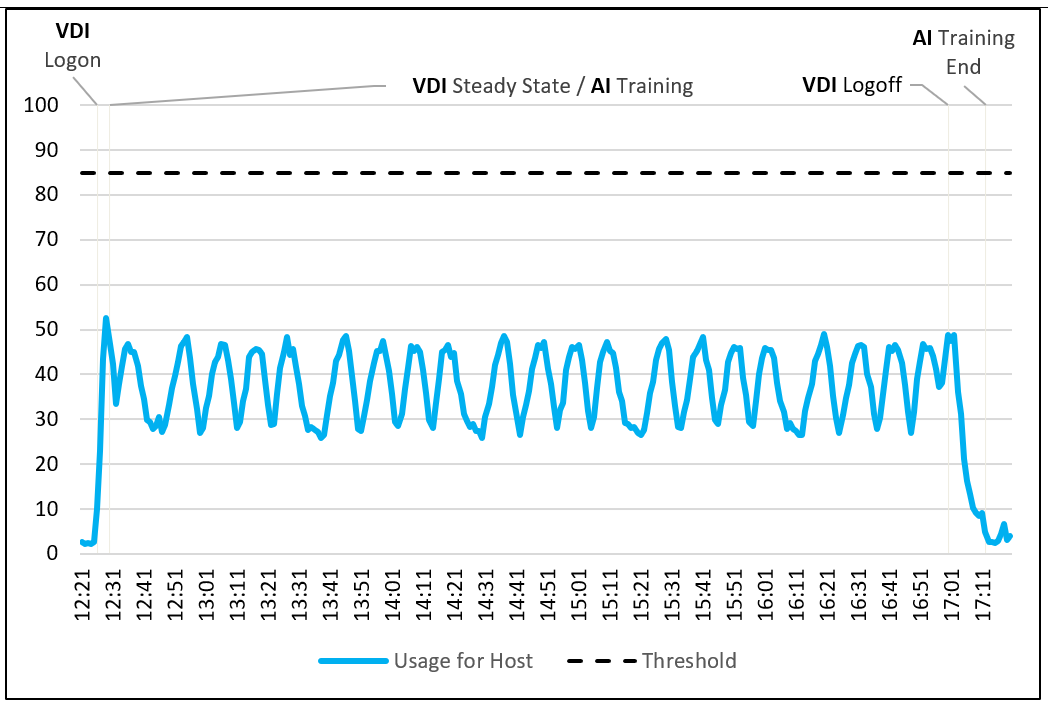
CPU utilizationThe following figure shows the average CPU utilization for VDI steady-state and AI training. The CPU average utilization during the steady-state phase was approximately 38 percent. The numerous CPU usage peaks are the VDI medical workload phases on top of a latent AI training CPU requirement of 25 percent. Minor CPU contention was seen during these phases along with elevated CPU readiness averaging 0.1 percent during the steady-state phase and peaking at 0.7 percent during the logout phase.
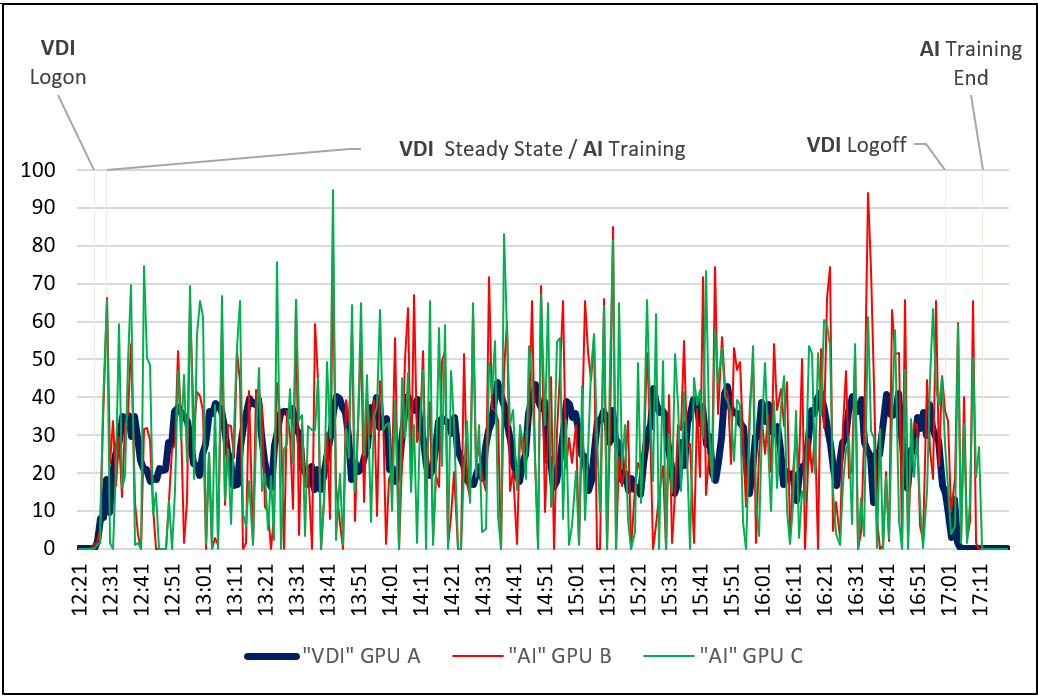
The following figure shows the peak GPU utilization for VDI steady-state and AI training. The two AI GPU cards show similar utilization throughout the training. AI GPU requirements show large peaks and troughs, but overall usage is similar to the VDI-assigned GPU of 28 percent. GPU B and C are not driven to the average usage of 81 percent when all three GPUs are assigned to AI. The VDI GPU workload utilization pattern can be seen clearly for GPU A following the various workload phases and averaged at 28 percent during the steady-state phase.
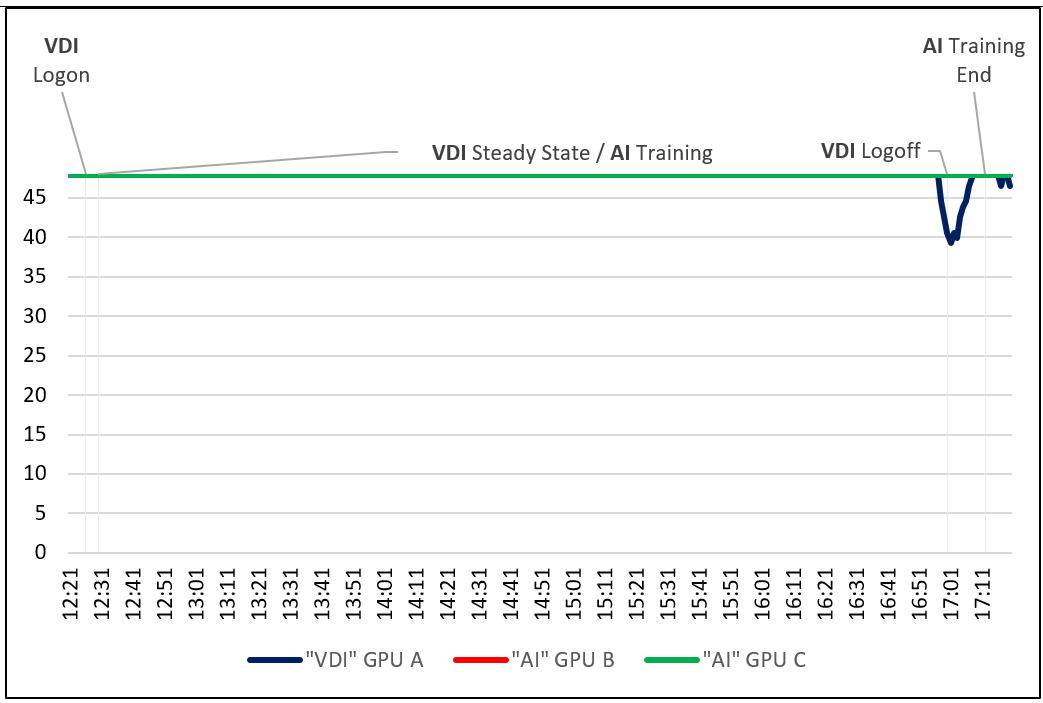
The following figure shows the peak GPU memory utilization for VDI steady-state and AI training. The three GPU cards showed the same memory usage, consuming 100 percent of available memory during the login period for steady-state and training. Memory usage dips during VDI clone recreation for GPU A before consuming 100 percent of available GPU memory when the VMs are re-created.
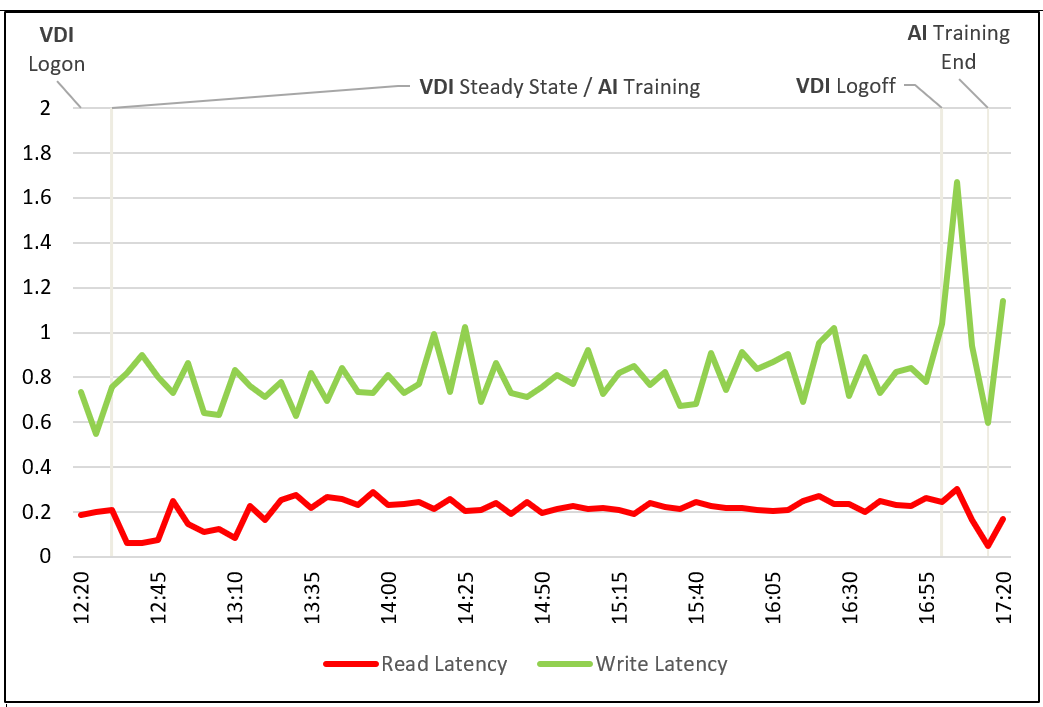
The following figure shows the vSAN cluster read and write latency for VDI steady-state and AI training. Cluster latency remained at an acceptable level with cluster read latency averaging 0.2 ms and cluster write latency averaging 0.8 ms during steady-state. No anomalies were seen during training.
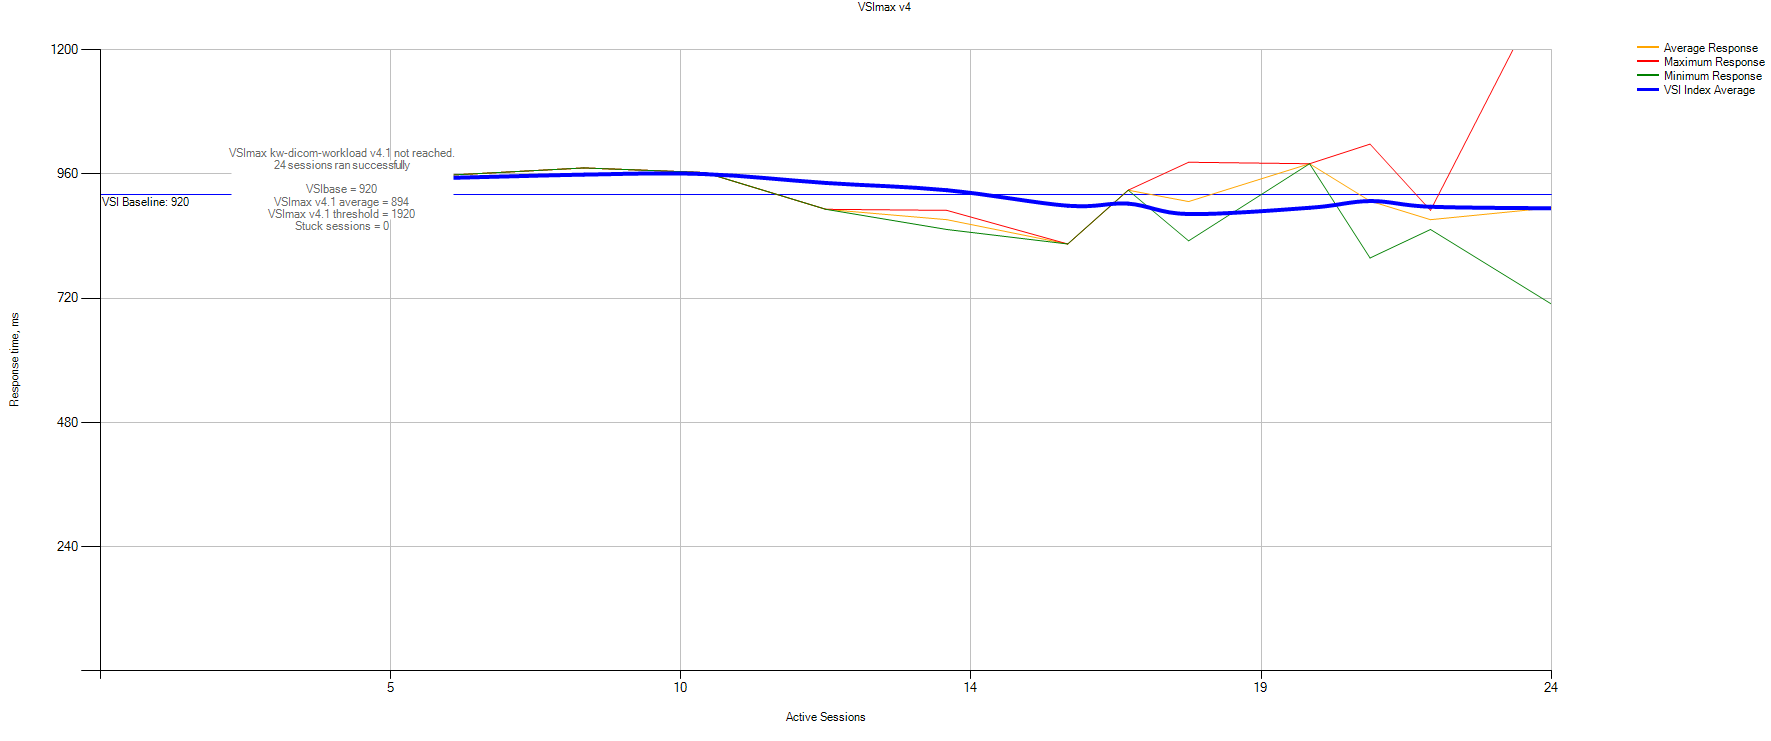
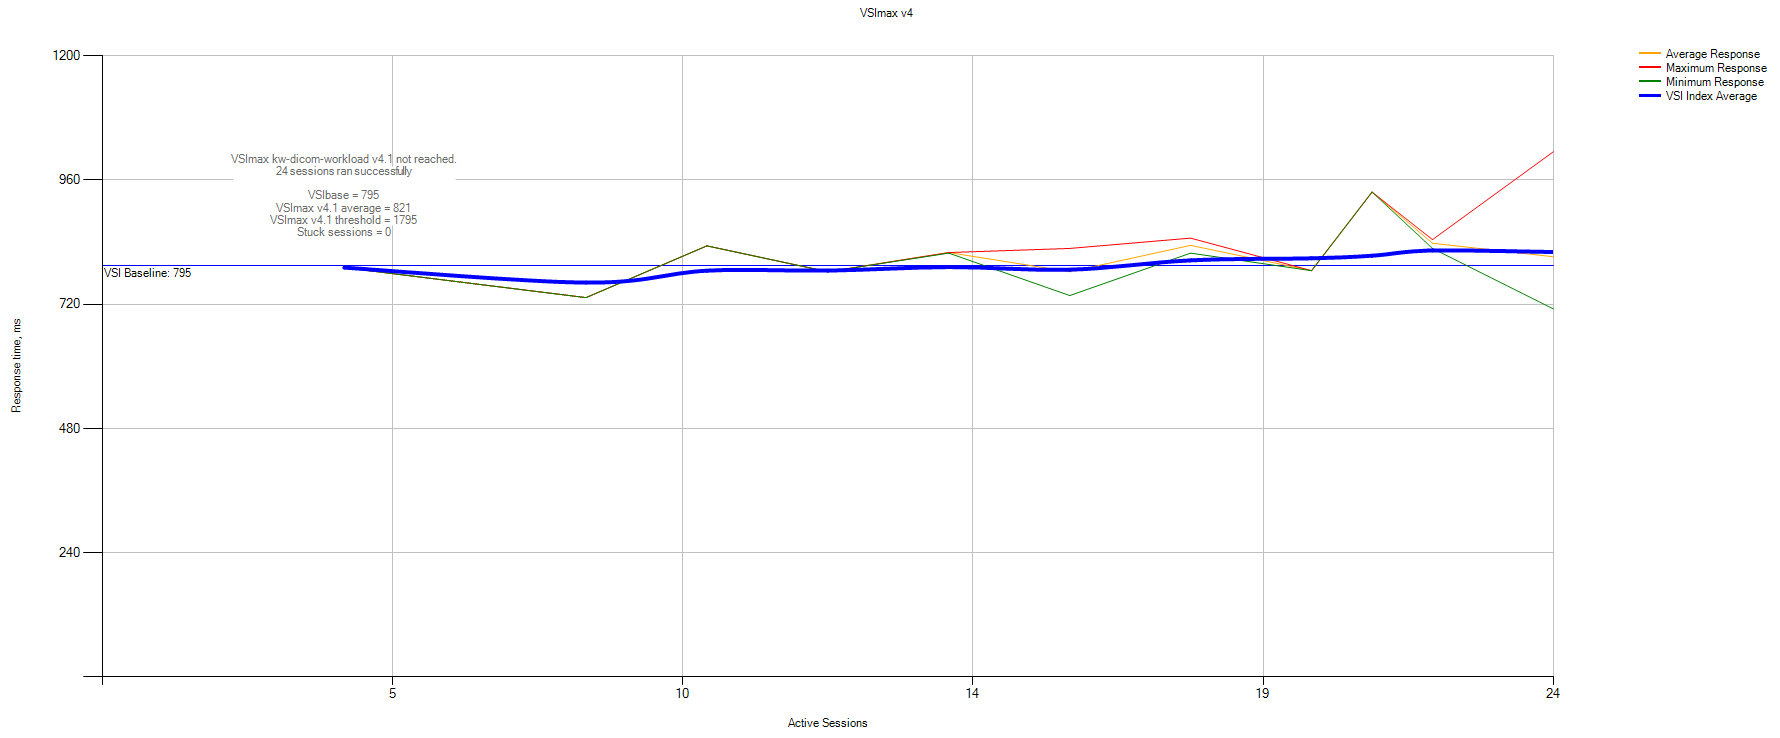
The following figure shows the Login VSI base, average, and maximum user experience response times. The VSI base is at an acceptable score. The VSI index average shows that the system responds appropriately as additional load is added and the system behaves in a predictable manner. The response times are tightly grouped, meaning that there is a consistent user experience across VDI sessions.
Dual Workload AI Validation and VDI Medical Knowledge Worker Both GPU Enhanced
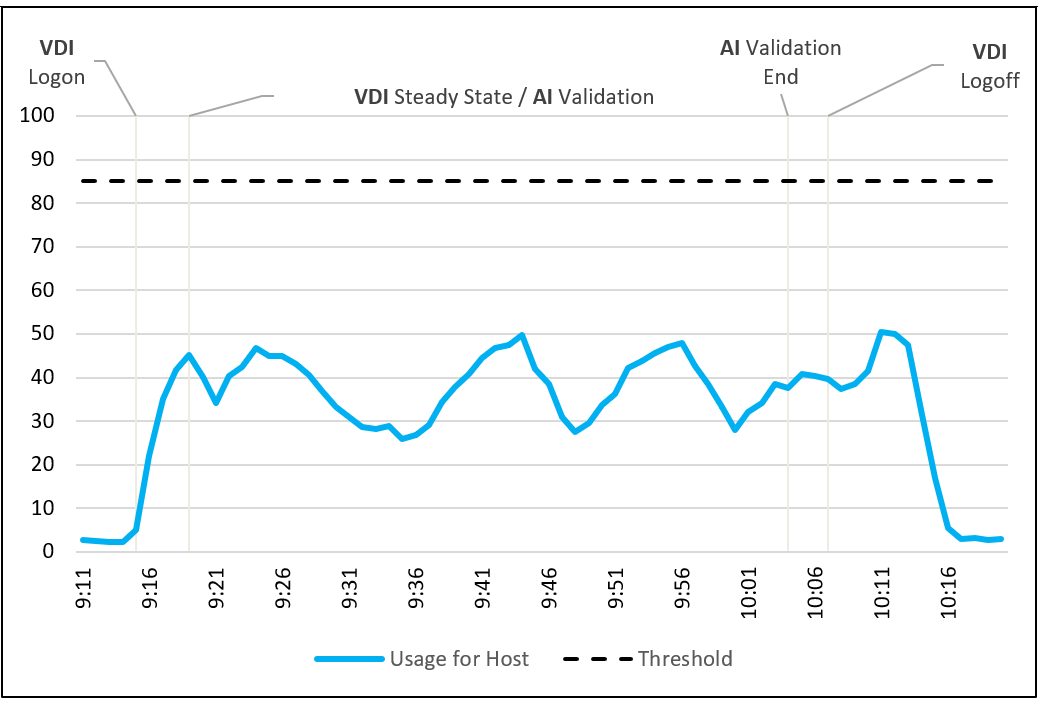
CPU utilizationThe following figure shows the average CPU utilization for VDI steady-state and AI validation. The numerous CPU usage peaks are the result of the VDI medical workload phases on top of a latent AI Validation CPU requirement of 13 percent. CPU readiness averaged at 0.1 percent during steady-state and peaked at 0.7 percent during the log out phase.
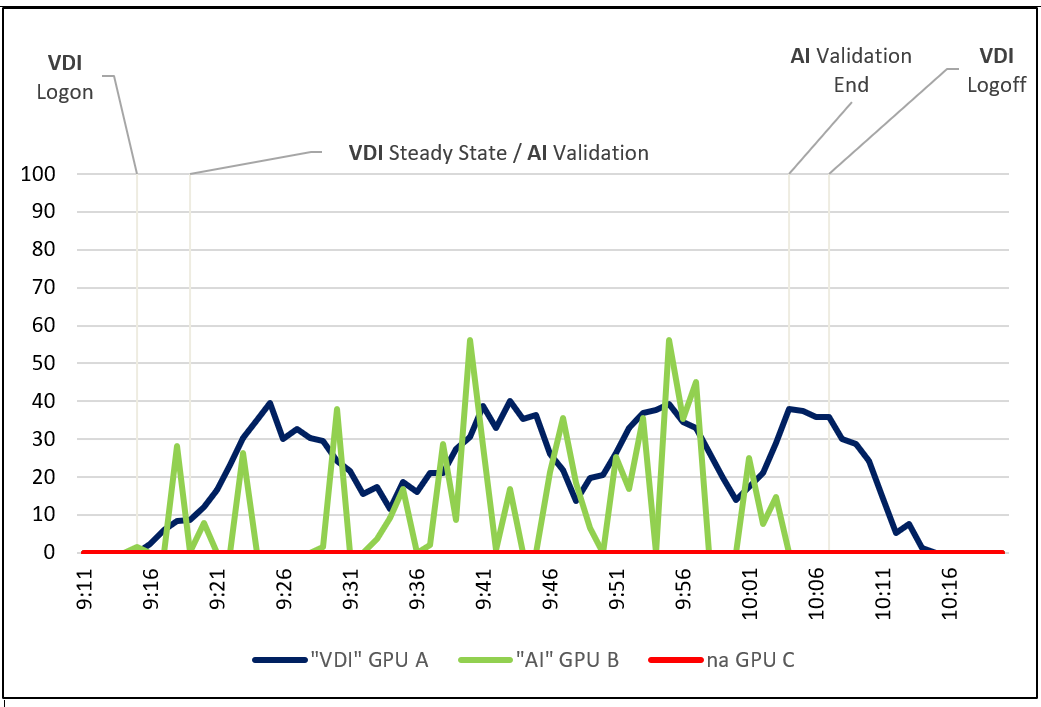
The following figure shows the peak GPU utilization for VDI steady-state and AI validation. The two GPU cards show distinctly different GPU utilization patterns. Fifteen peaks can be seen for the GPU B which possibly coincides with the 15 Epoch models being validated.
The following figure shows the peak GPU memory utilization for VDI steady-state and AI validation. The three GPU cards showed the same memory usage, consuming 100 percent of available memory during the login phase for steady-state and training. Memory usage dipped during VDI clone re-creation for GPU A before consuming 100 percent of available GPU memory when the VMs were re-created.
The following figure shows the vSAN cluster read and write latency for VDI steady-state and AI validation. Cluster latency remained at an acceptable level with cluster read latency averaging 0.1 ms and cluster write latency averaging 0.8 ms during steady-state. No anomalies were seen during training.
The following figure shows the Login VSI base, average, and maximum user experience response times. The VSI base was at an acceptable score. The VSI index average shows that the system responded appropriately as additional load was added and the system behaved in a predictable manner. The response times are tightly grouped, meaning that there is a consistent user experience across VDI sessions.
Dual Workload AI Training CPU Only and VDI Medical Knowledge Worker GPU Enhanced
CPU utilizationThe following figure shows the average CPU utilization for VDI steady-state and AI training. The numerous CPU usage peaks are the result of the VDI medical workload phases on top of a latent AI validation CPU requirement of 30 percent. CPU readiness averaged at 0.1 percent during steady-state and peaked at 100 percent spike during the logout phase.
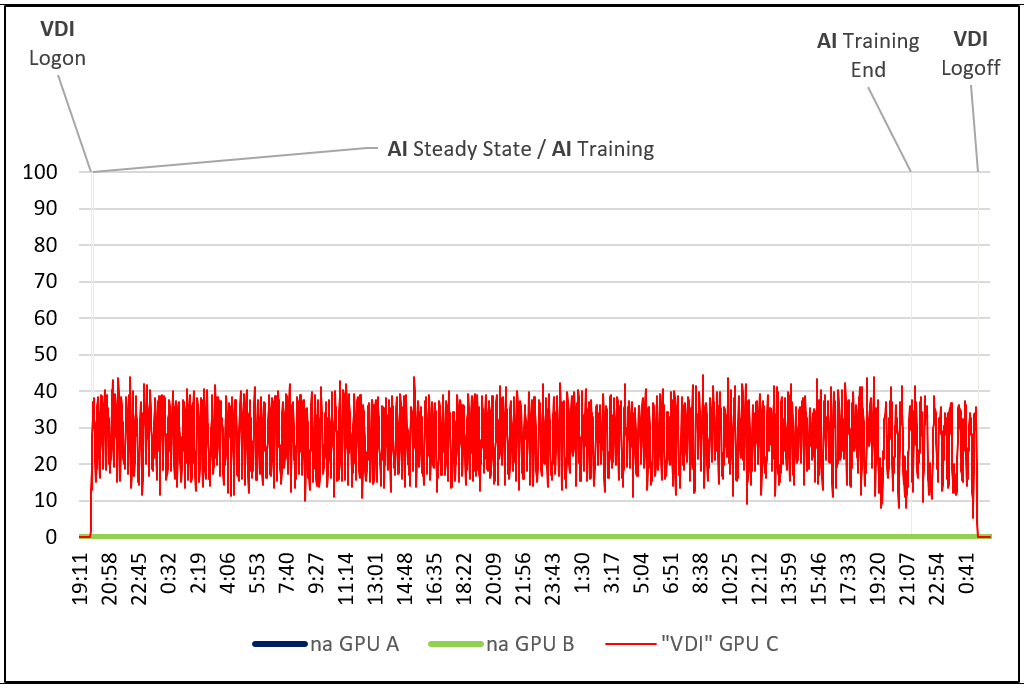
The following figure shows the peak GPU utilization for VDI steady-state and AI training. A single GPU card was used for VDI graphics during the testing, with a uniform usage pattern.
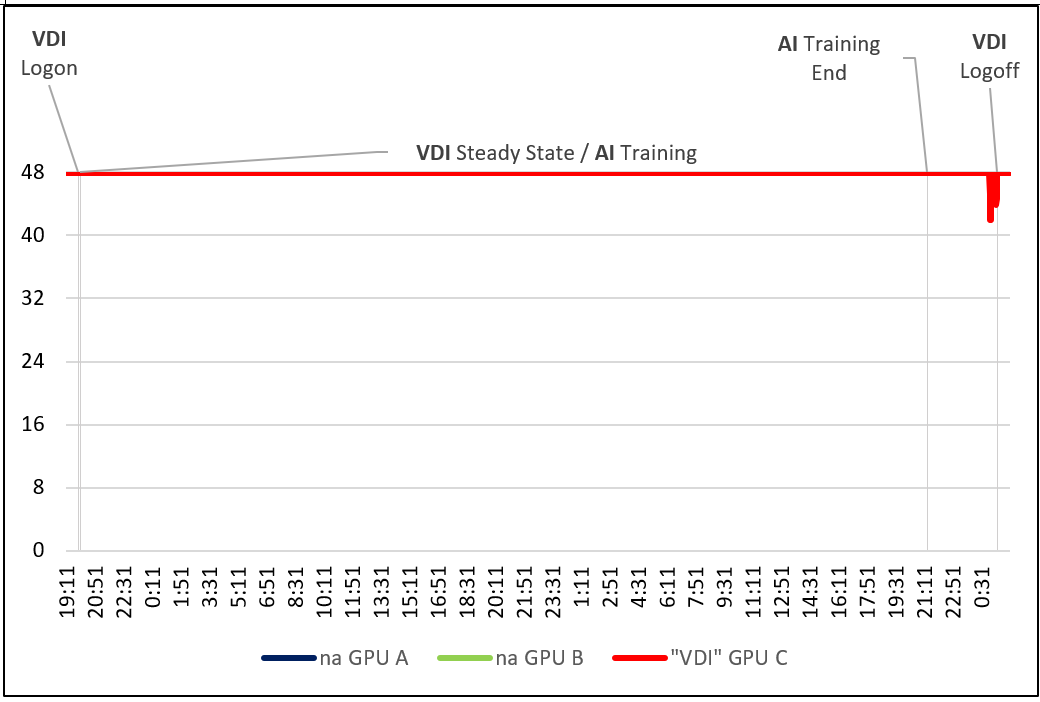
The following figure shows the peak GPU memory utilization for VDI steady-state and AI training. The GPU card consumed 100 percent of available memory during the login phase for steady-state and training.
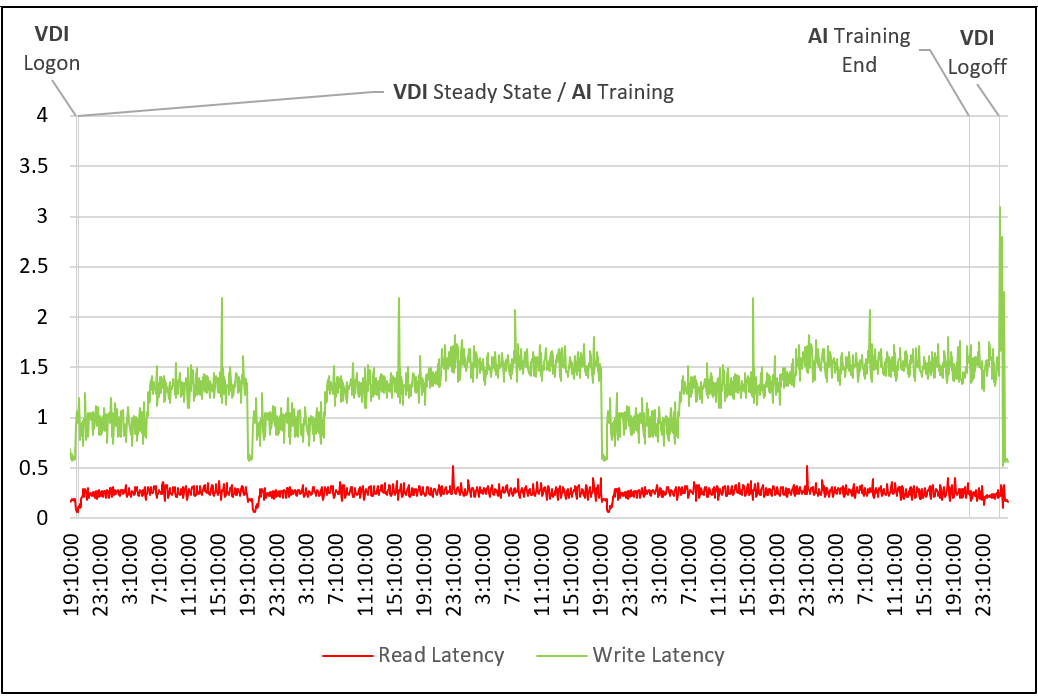
The following figure shows the vSAN cluster read and write latency for VDI steady-state and AI training. Cluster latency remained at an acceptable level with cluster read latency averaging 0.2 ms and cluster write latency averaging 1.3 ms during steady-state. No anomalies were seen during training. However, the write latency had an unusual pattern during steady-state, although that pattern was contained within a 0.5 ms to 2 ms envelope.
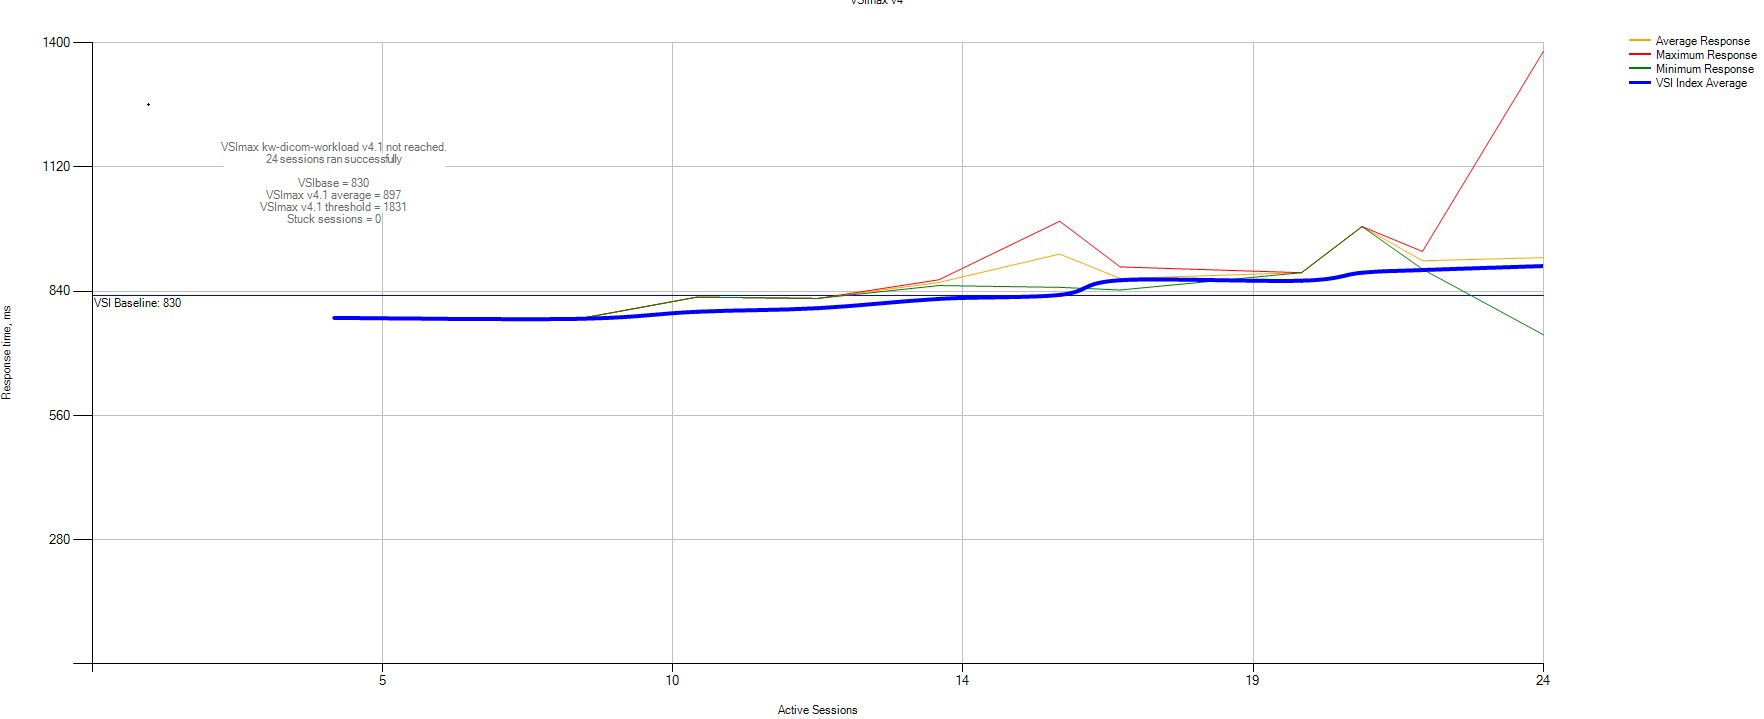
The following figure shows the Login VSI base, average, and maximum user experience response times. The VSI base was at an acceptable score. The VSI index average shows that the system responded appropriately as additional load was added and the system behaved in a predictable manner. The response times are tightly grouped, meaning that there is a consistent user experience across VDI sessions.
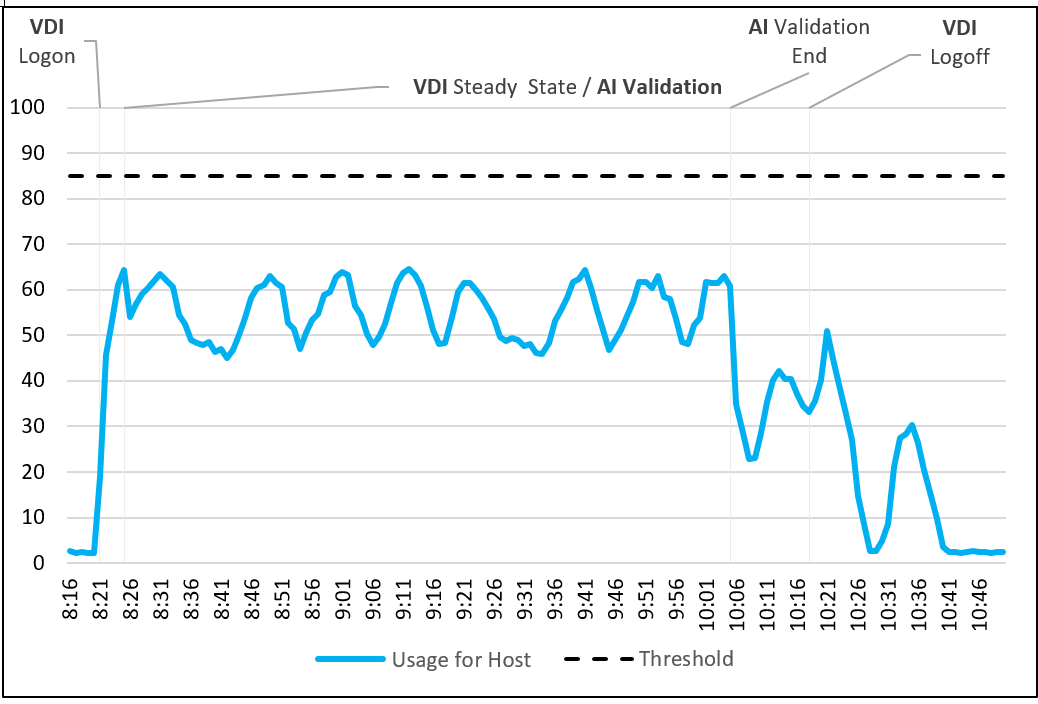
Dual Workload AI Validation CPU Only and VDI Medical Knowledge Worker GPU Enhanced
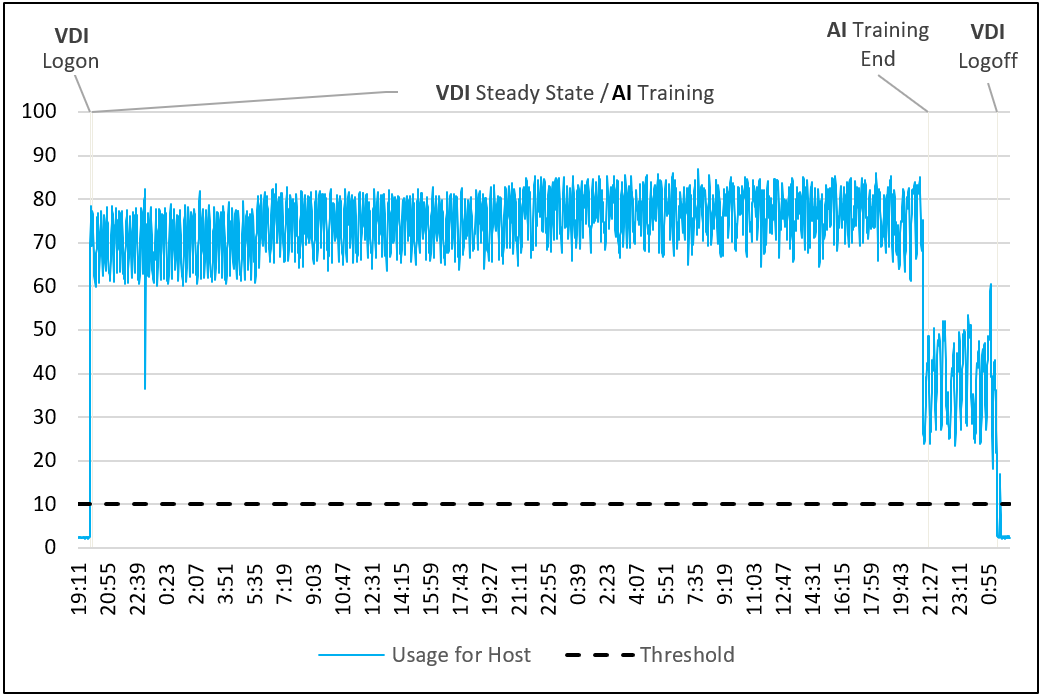
CPU utilizationThe following figure shows the average CPU utilization for VDI steady-state and AI validation. The numerous CPU usage peaks are a result of the VDI medical workload phases on top of a latent AI validation CPU requirement of 20 percent. CPU readiness averaged 0.29 percent during steady-state and peaked at 100 percent spike during the logout phase.
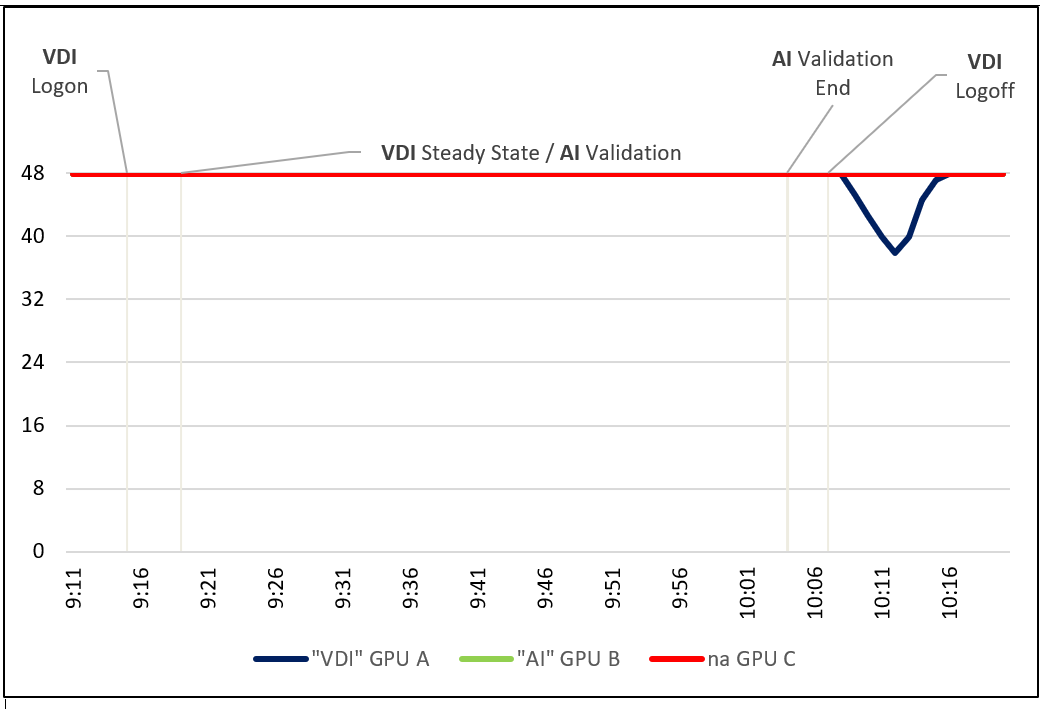
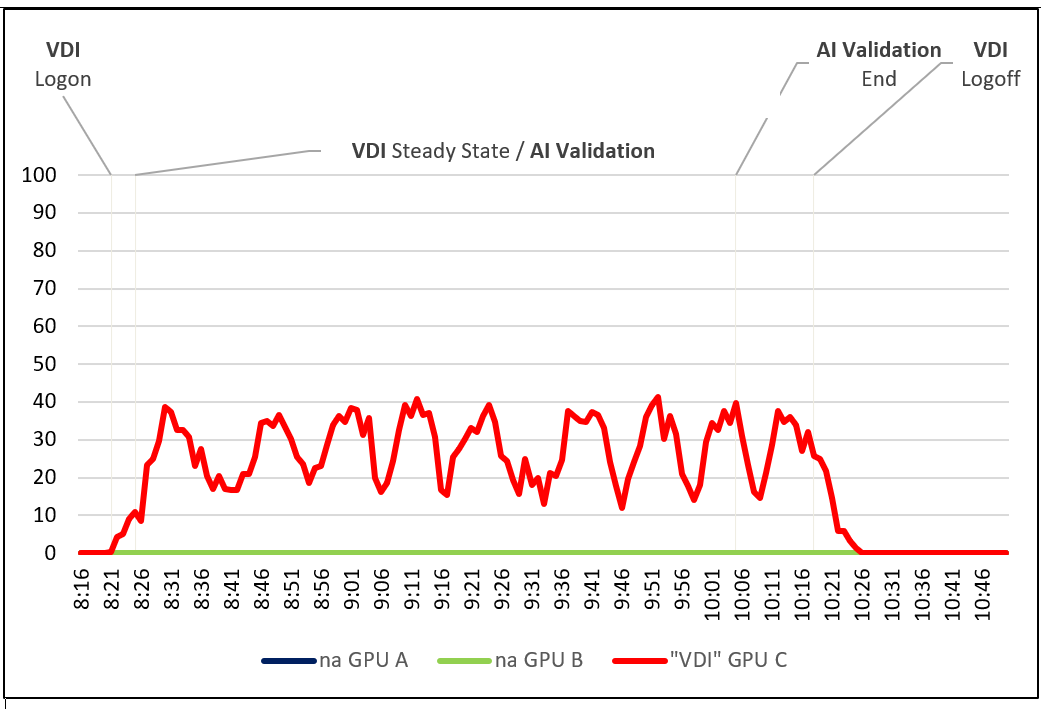
The following figure shows the peak GPU utilization for VDI steady-state and AI validation. A single GPU card was used for VDI graphics during testing and shows a modulating but steady usage pattern.
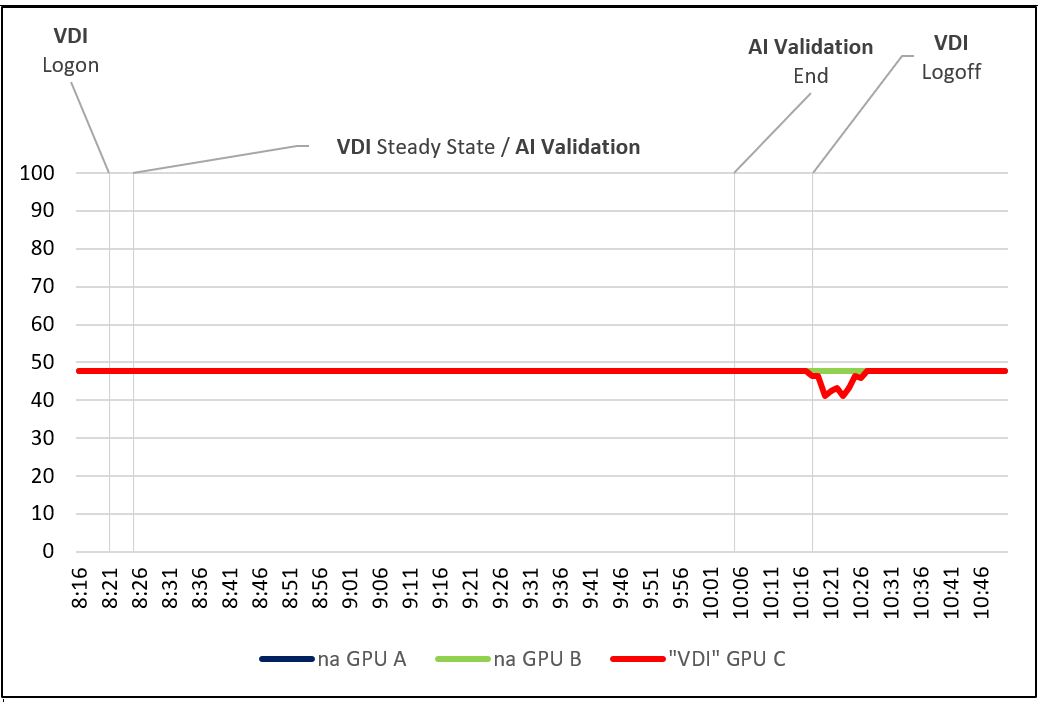
The following figure shows the peak GPU memory utilization for VDI steady-state and AI validation. The GPU card consumed about 50 percent of available memory during the login phase for steady-state and training.
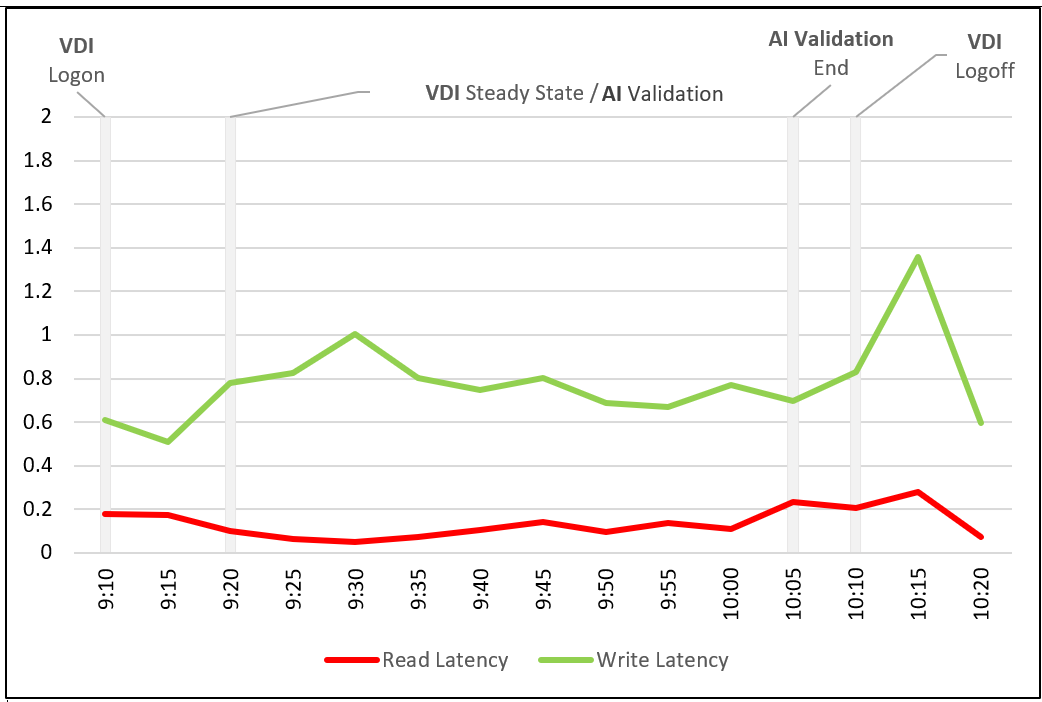
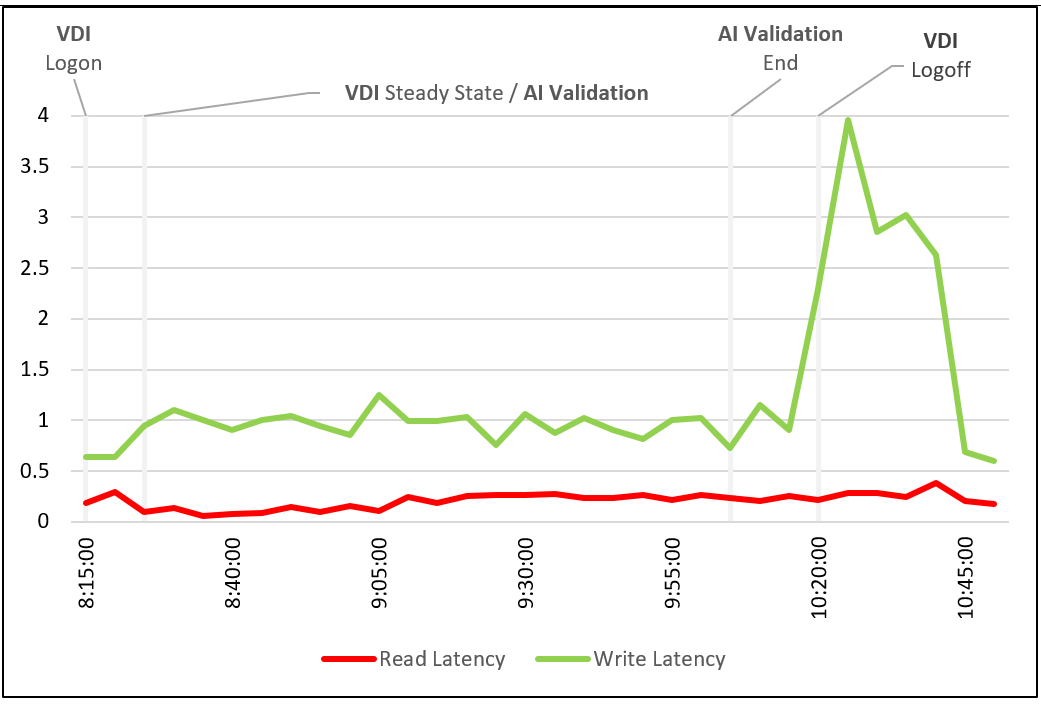
The following figure shows the vSAN cluster read and write latency for VDI steady-state and AI validation. Cluster latency remained at an acceptable level, with cluster read latency averaging 0.2 ms and cluster write latency averaging 1.0 ms during steady-state. No anomalies were seen during validation.
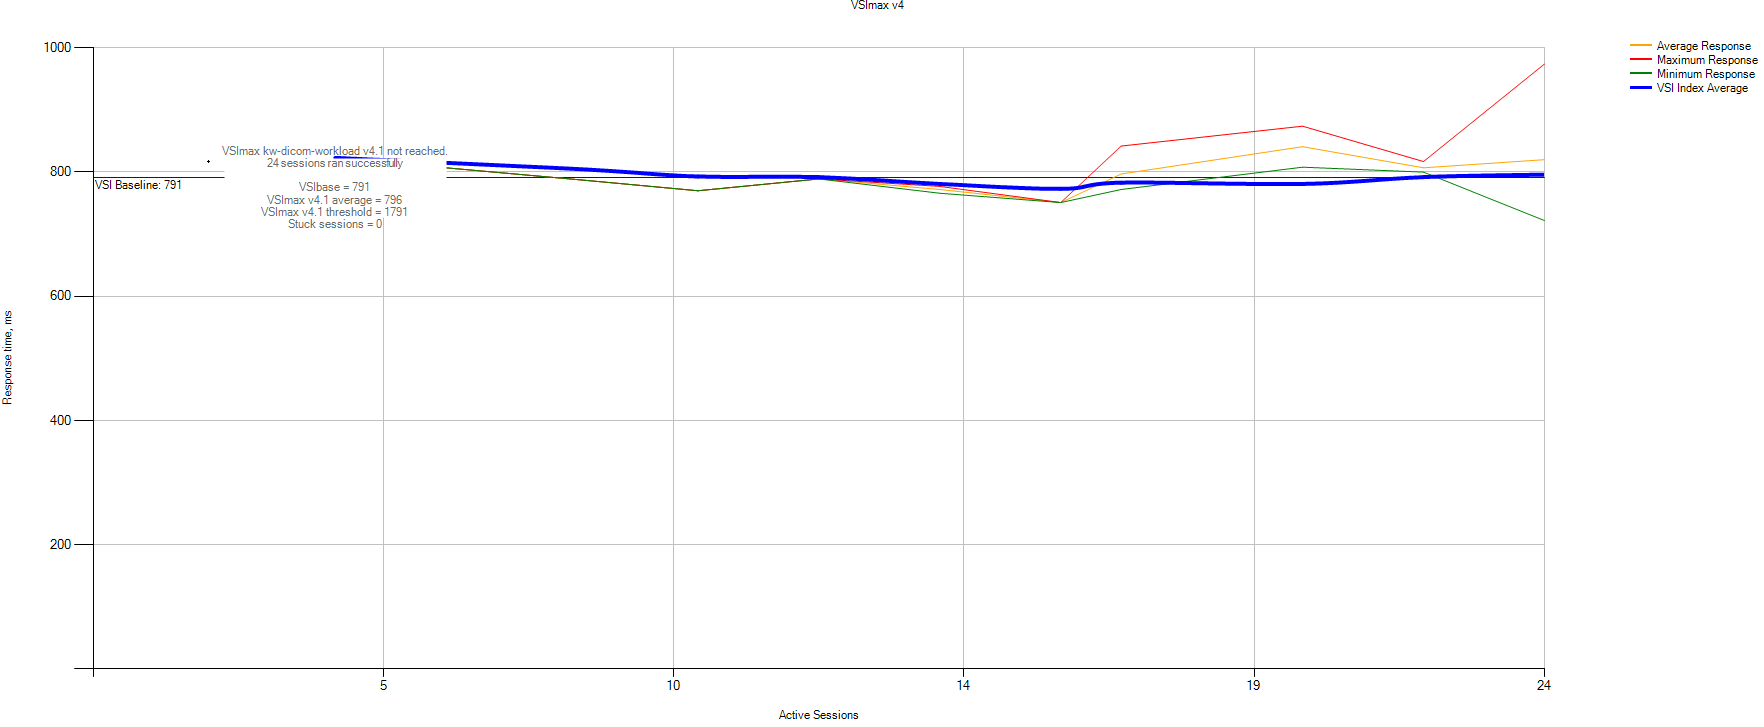
The following figure shows the Login VSI base, average, and maximum user experience response times. The VSI base is at an acceptable score. The VSI index average shows that the system responded appropriately as additional load was added and the system behaved in a predictable manner. The response times are tightly grouped, meaning that there is a consistent user experience across VDI sessions.