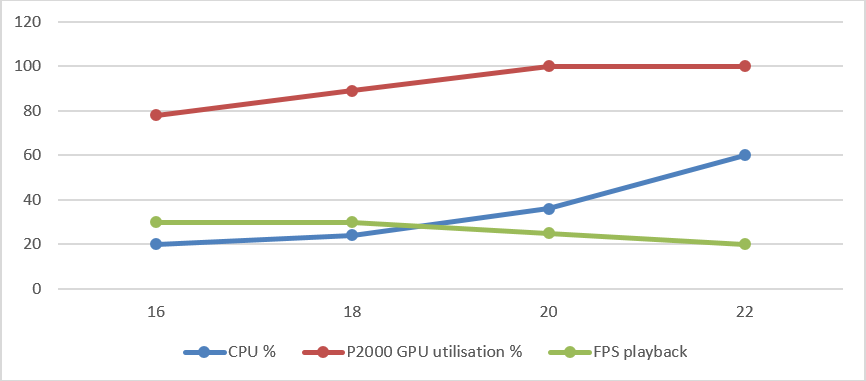
Quadro P2000 - Single Display running 1080p 30FPS Feeds
| No. of feeds | CPU % | GPU Utilization % | FPS playback |
| P2000 | |||
| 16 | 20 | 78 | 30 |
| 18 | 24 | 89 | 30 |
| 20 | 36 | 100 | 25 |
| 22 | 60 | 100 | 20 |
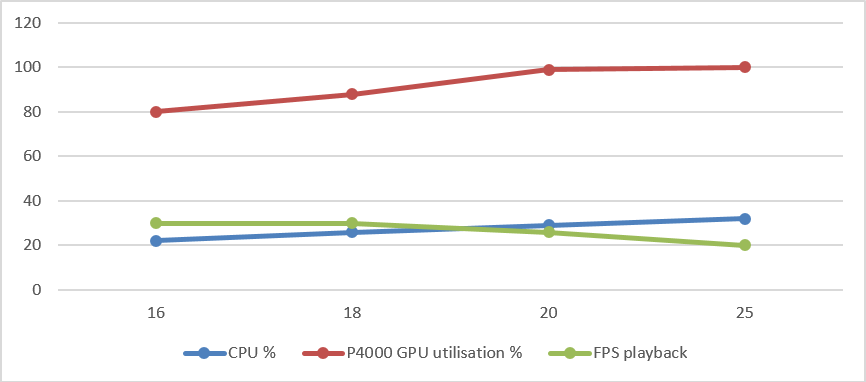
Quadro P4000 - Single Display running 1080p 30FPS Feeds
The P4000 adapter has a similar peak feed performance to the P2000; however it makes less of a demand on the CPU.
| No. of feeds | CPU % | GPU Utilization % | FPS playback |
| P4000 | |||
| 16 | 22 | 80 | 30 |
| 18 | 26 | 88 | 30 |
| 20 | 29 | 99 | 26 |
| 25 | 32 | 100 | 20 |
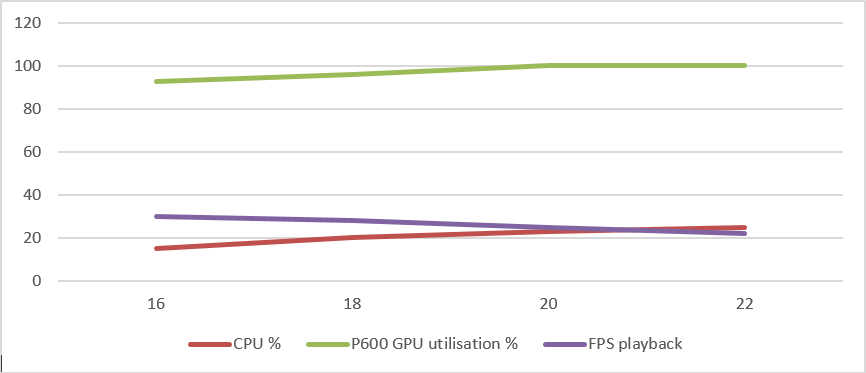
Quadro P600 - Single Display running 1080p 30FPS Feeds
| No. of feeds | CPU % | GPU Utilization % | FPS playback |
| P600 | |||
| 16 | 15 | 93 | 30 |
| 18 | 20 | 96 | 28 |
| 20 | 23 | 100 | 25 |
| 22 | 25 | 100 | 22 |
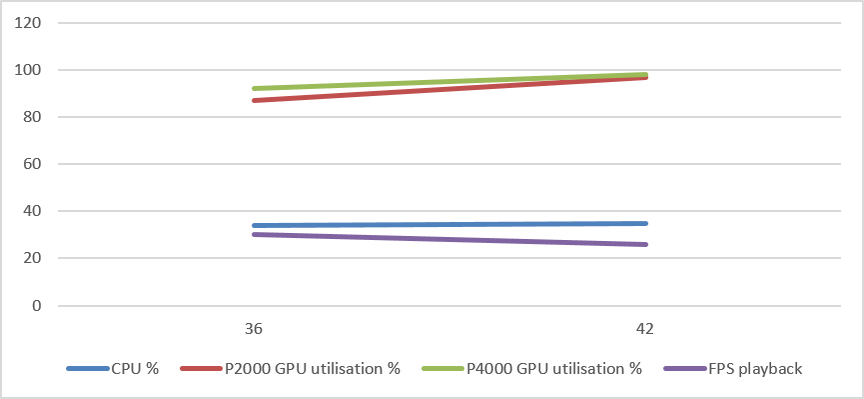
Dual GPU Adapter
Adding additional GPU adapters leverages both in parallel performance, effectively doubling the quantity of feeds being displayed. It also provides additional output ports if required.
Dual GPU performance
| No. of feeds | CPU % | GPU Utilization % | FPS playback | |
| P2000 | P4000 | |||
| 36 | 34 | 87 | 92 | 30 |
| 42 | 35 | 97 | 98 | 26 |
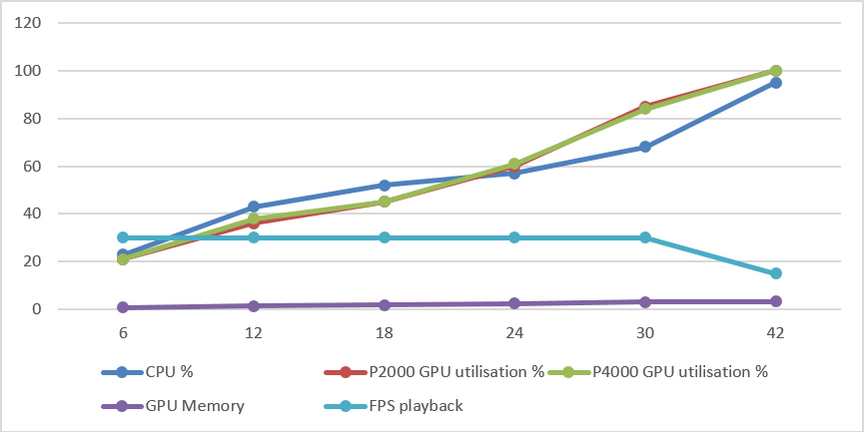
Multiple Monitors, Multiple instances of the client per screen
Additional instances of the Smart Client place a higher demand on the CPU. The overall quantity of feeds being displayed saturates at approximately 20 percent less than if utilizing a single display.
The performance of both GPU's are being leveraged in parallel.
| Instances of Client | No. of displays | No. per screen | No. of feeds | CPU % | GPU Utilization % | GPU Memory | FPS playback | |
| P2000 | P4000 | |||||||
| 1 | 5 | 6 | 6 | 23 | 21 | 21 | 0.7 | 30 |
| 2 | 5 | 6 | 12 | 43 | 36 | 38 | 1.4 | 30 |
| 3 | 5 | 6 | 18 | 52 | 45 | 45 | 1.8 | 30 |
| 4 | 5 | 6 | 24 | 57 | 60 | 61 | 2.5 | 30 |
| 5 | 5 | 6 | 30 | 68 | 85 | 84 | 3.1 | 30 |
| 5 | 5 | 6+(1*12) | 42 | 95 | 100 | 100 | 3.2 | 15 |
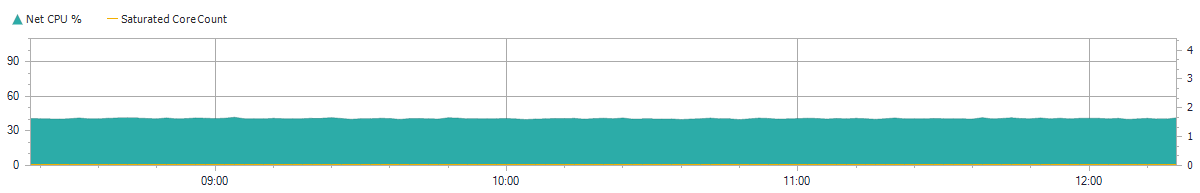
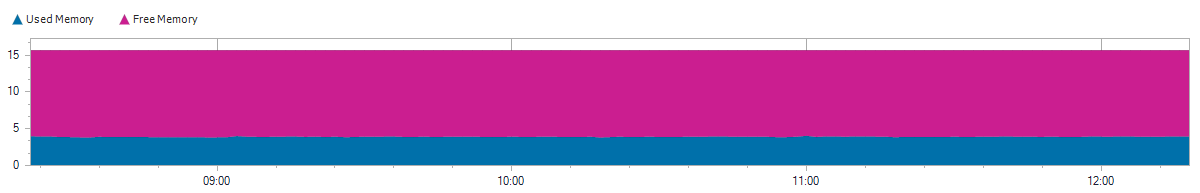
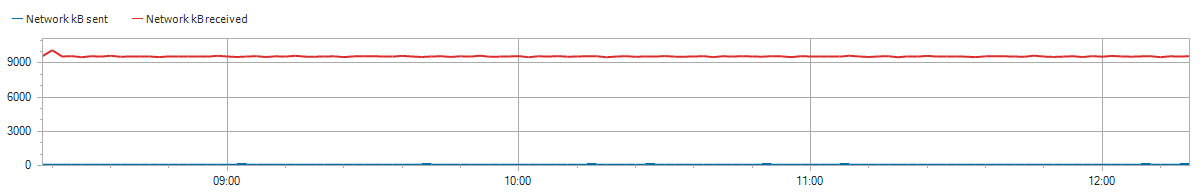
System performance over a 4 hour period at multi-monitor (Data from LiveOptics)