All test results graphs include the performance of the platform during the deletion and re-creation of the instant clone VMs after all users log off when the test run has completed. The different phases of the test cycle are displayed in the test results graphs as ‘Logon’, ‘Steady State’, ‘Logoff’ and ‘Re-create’. The ‘Re-create’ heading indicates the period at the end of the test cycle when the instant clone VMs are being re-created after logoff. All graphs have time displayed on the X axis and the metric displayed on the Y axis.
The following table summarizes the test results for the various workloads and configurations that we tested:
Table 9. Test results
Workload
Density per host
Average CPU
Average consumed memory
Average active memory
Average IOPS per user
Average net Mbps per user
Task Worker
210
85.9%
236 GB
73 GB
2.0
2.29 Mbps
Knowledge Worker
150
86%
532 GB
170 GB
7.78
6.65 Mbps
Custom Knowledge Worker VS/C++
48
70%
433 GB
184 GB
31
16.7 Mbps
Custom Knowledge Worker Eclipse/Java
48
57%
288 GB
116 GB
17.7
11.6 Mbps
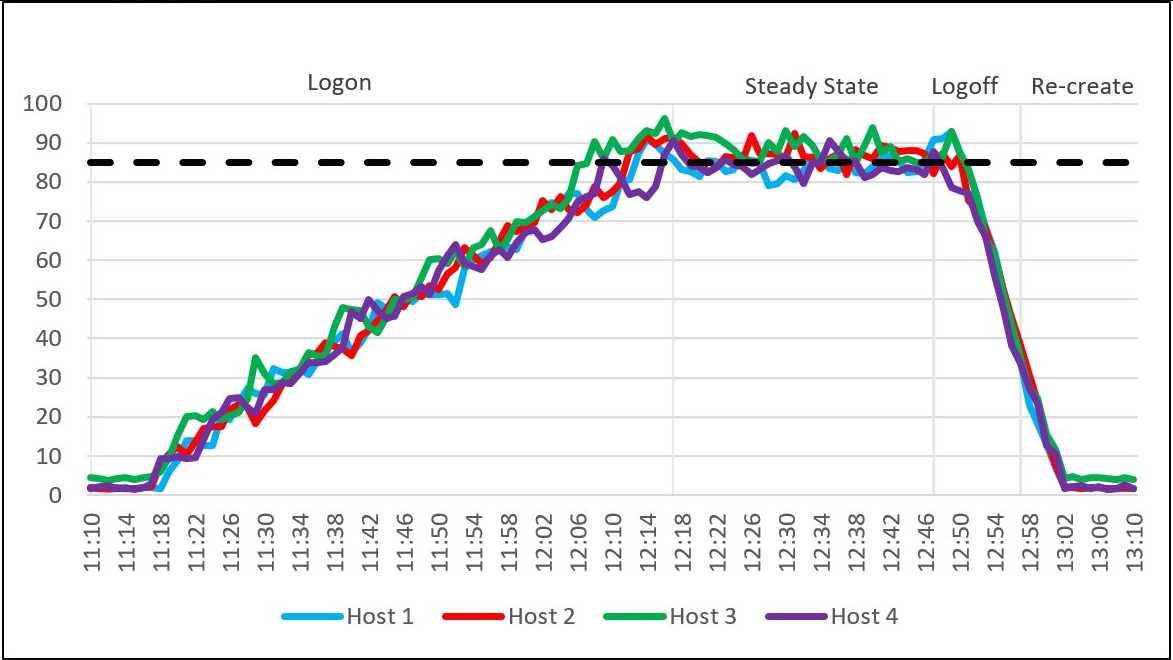
Login VSI 840-user Task Worker workload
CPU usage
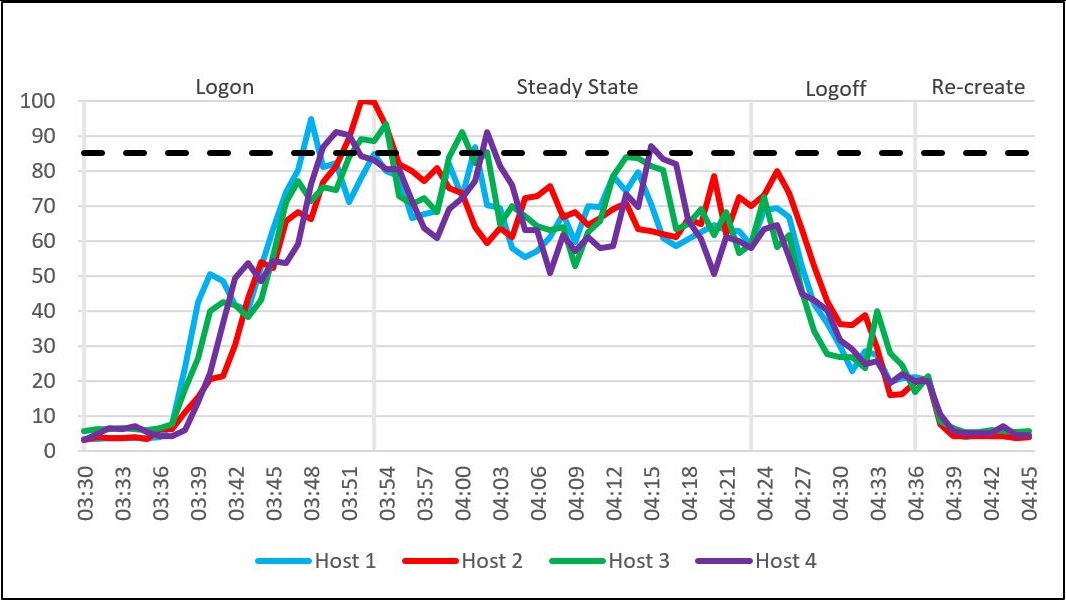
The total user density achieved for this test is 840, with 210 user sessions across each compute host. CPU usage steadily increased during the logon phase and converged at the defined threshold during the steady-state phase of the test. CPU usage during the steady-state phase was 85.9 per cent. The compute nodes only showed slight discrepancies in usage during the logon phase, which appears to be a normal distribution of usage. We did not observe any anomalies during testing.
Figure 9. CPU usage percentage
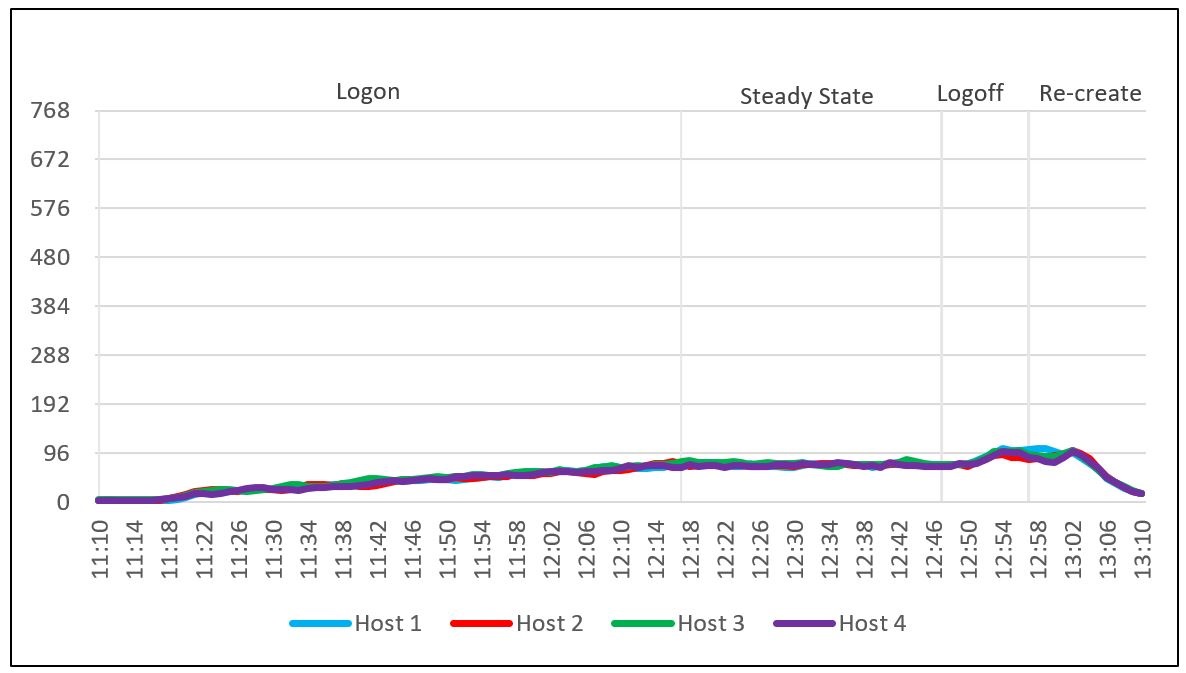
Memory
Active memory remained below the physical capacity installed on each host. Out of a total memory of 768 GB, the active memory usage was 105 GB. We did not observe memory swapping and paging during this test, which indicates that the system was performing as expected. We did not observe any anomalies during testing.
Figure 10. Active memory (GB)
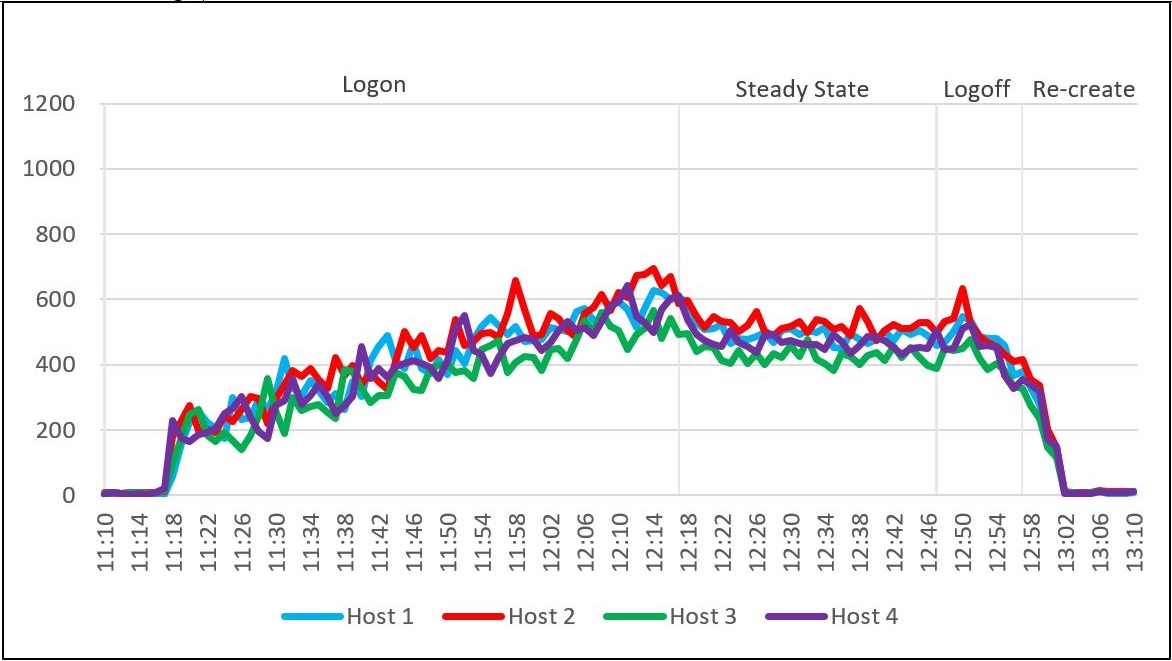
Network
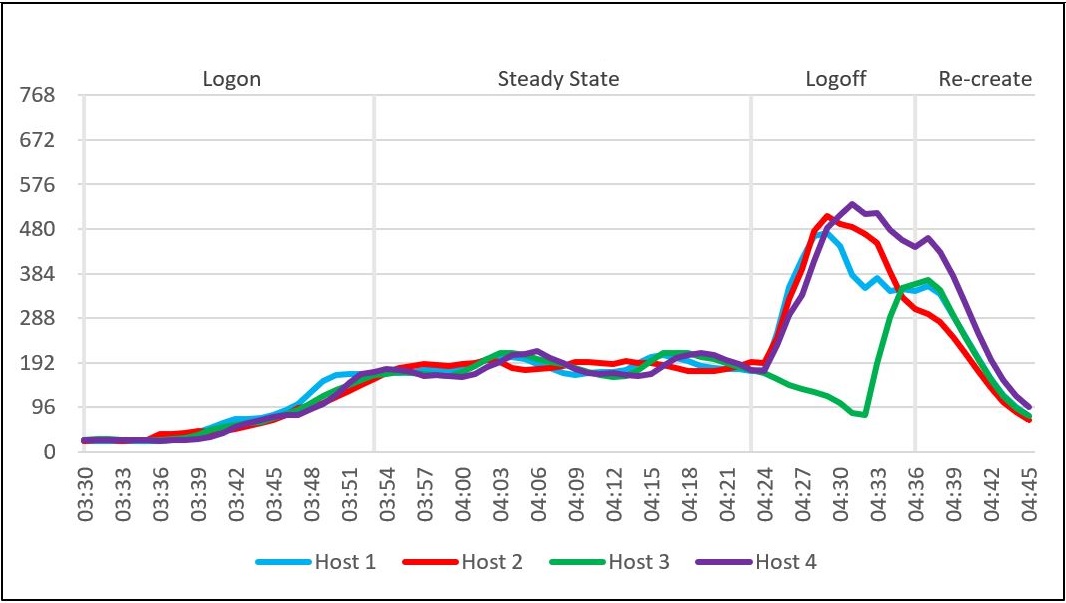
The network utilization on the test was quite low throughout. The steady-state peak was 613 Mbps, the maximum host peak was 694 Mbps, and the steady-state average was 481 Mbps. All hosts had similar network usage patterns with a steady increase during the login phase, a drop once all users were logged on in the steady-state phase, and then a small increase followed by a drop when the users logged off. We did not observe any anomalies during testing.
Figure 11. Network Mbps
Storage performance IOPS and latency
The total IOPS generated were as expected. Read IOPS were extremely low as were write IOPS, which is typical of a small RDSH environment. The small spike during the logoff and re-create clones phases was due to the re-creation of the RDSH clones.
Cluster latency remained at an acceptable level and below the defined threshold. We didn't see any anomalies during testing.
Table 10. Storage performance IOPS and latency
Metric
Value
Maximum disk IOPS
2,046
Steady state peak
2,046
Steady state average
1,669
Maximum read + write latency
2.3 ms
Average steady state latency
2.23 ms
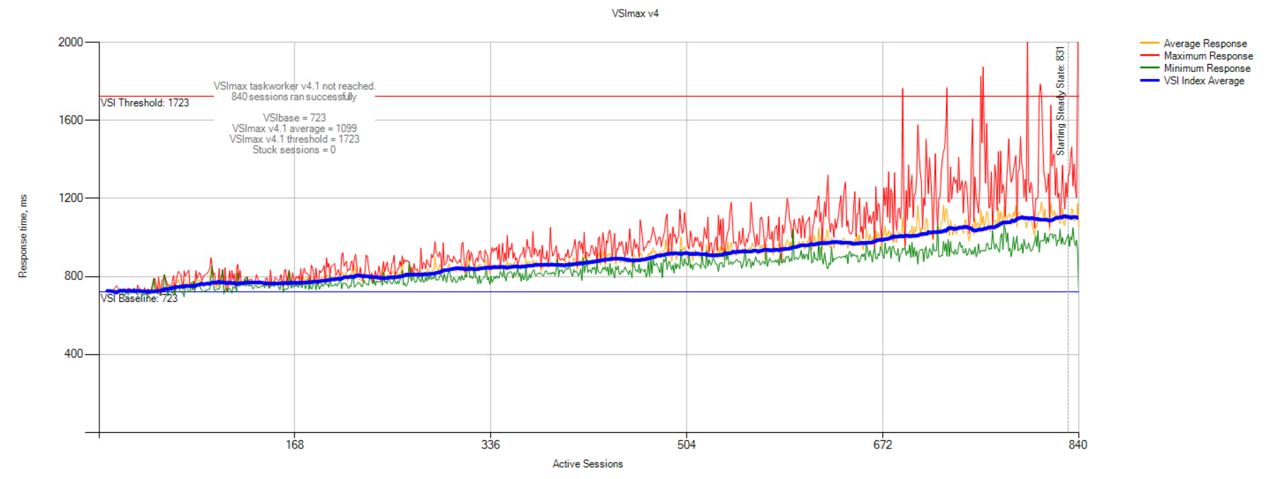
User experience
The VSIbase was at an acceptable score of 723. The average VSImax was 1,099 while the VSImax threshold was 1,723. No stuck sessions occurred. The VSI index average showed that the system responded appropriately as additional load was added and behaved in a predictable manner. The response times were tightly grouped, meaning that there was a consistent user experience across the VDI sessions.
Figure 12. Login VSI user experience
Login VSI 600-user Knowledge Worker workload
The total user density achieved for this test was 600, with 150 users across each compute host.
CPU usage
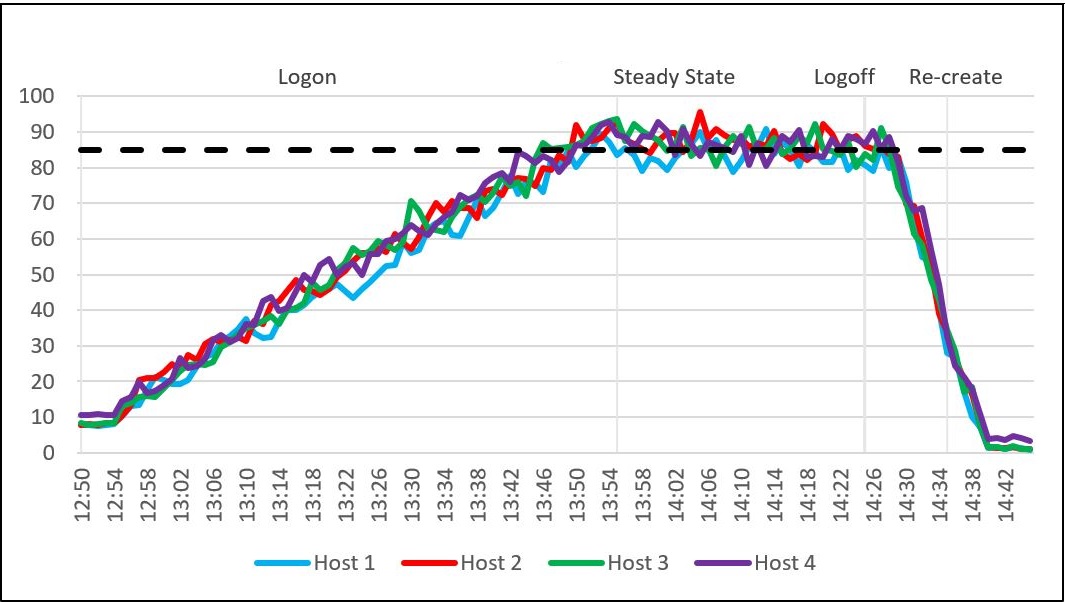
CPU usage steadily increased during the logon phase and converged at the defined threshold during the steady-state phase of the test when it reached 86.1 percent. The compute nodes only showed tiny discrepancies in usage during the logon phase, which appears to be a normal distribution of usage. We did not observe any anomalies during testing.
Figure 13. CPU usage percentage
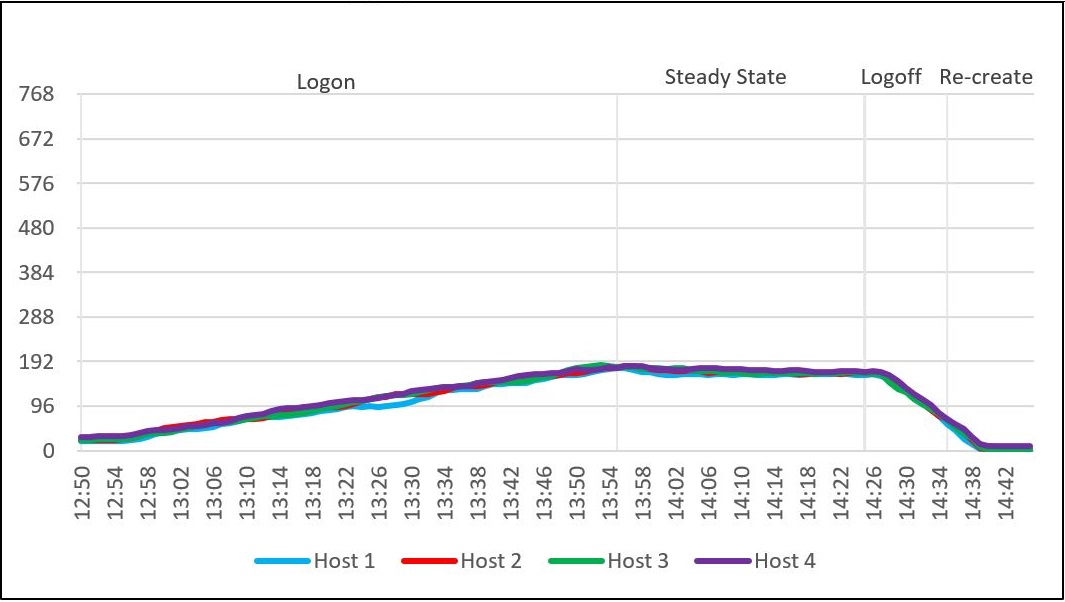
Memory
Active memory remained below the physical capacity installed on each host. Out of a total memory capacity of 768 GB, the maximum active memory usage was 184 GB. We did not observe memory swapping and paging during this test, which indicates that the system was performing as expected. We did not observe any anomalies during testing.
Figure 14. Active memory (GB)
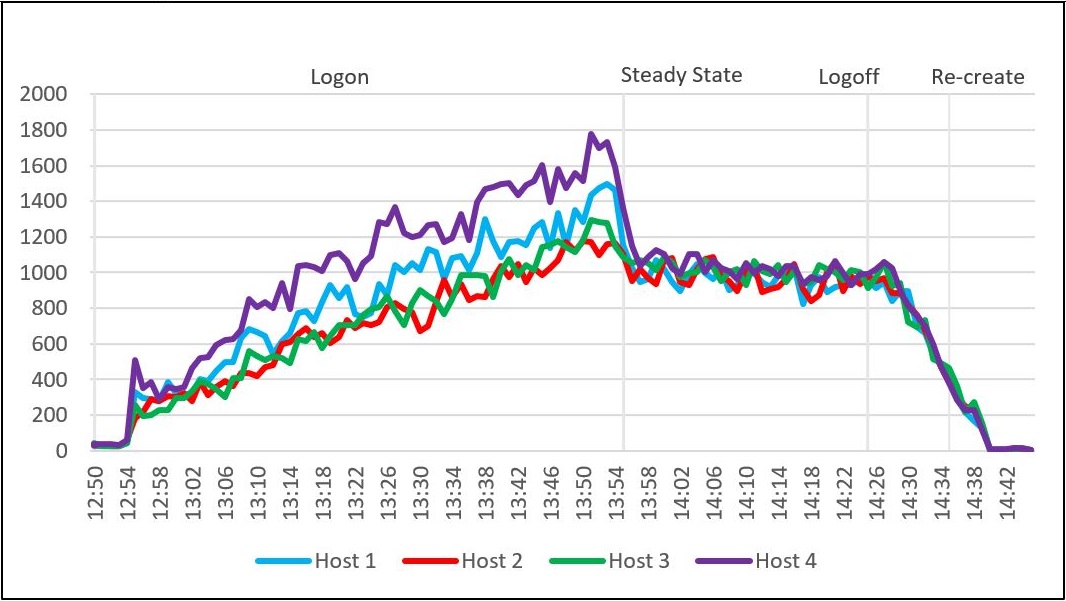
Network usage
The network utilization on the cluster was seen to be more active on one host than on the other three. This can sometimes happen on the host that hosts the VxRail Manager VM. This settled down once all the users had logged on and was consistent across all hosts during the steady-state phase. The steady-state peak was 1,360 Mbps and the maximum host peak was 1,780 Mbps. The steady-state average was 998 Mbps.
Figure 15. Network usage (Mbps)
Storage performance IOPS and latency
The total IOPS generated were as expected. There were more read IOPS than write IOPS as users logged on to their desktops and read their profile data. During the steady-state phase this pattern changed where there were more write IOPS than read IOPS. The spike during the logoff and re-create clones phases was due to the re-creation of instant clones.
Cluster latency remained at an acceptable level and below the defined threshold. We didn't see any anomalies during testing.
Table 11. Storage performance IOPS and latency
Metric
Value
Maximum disk IOPS
9,251
Steady state peak
8,454
Steady state average
4,668
Maximum read + write latency
1.34 ms
Average steady state latency
1.26 ms
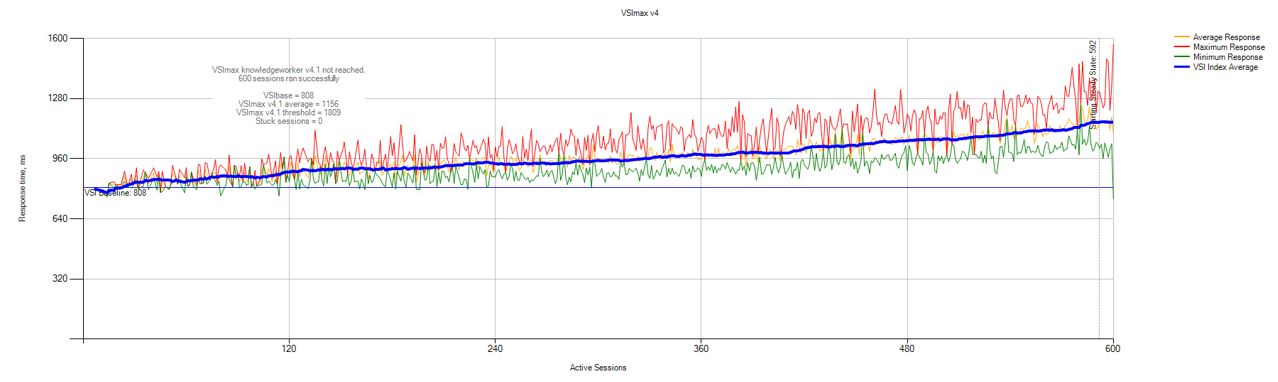
User experience
The VSIbase score was acceptable at 808. The VSImax average was 1,156 and the VSImax threshold was 1,809. There were no stuck sessions. The VSI index average shows that the system responded appropriately as additional load was added and behaved in a predictable manner. The response times were tightly grouped, meaning that there was a consistent user experience across VDI sessions.
Figure 16. Login VSI user experience
Login VSI 192-user custom Knowledge Worker workload – Visual Studio with C++
The total user density achieved for this test is 192 with 48 users across each compute host.
CPU usage
CPU usage rose quite rapidly during the logon phase with a 5-second logon interval for all users. CPU usage during the steady-state phase was not as uniform as in the case of the standard Knowledge Worker workload. Activities such as launching Visual Studio and compiling programs were quite CPU-intensive and contributed to the slightly erratic nature of the steady-state part of the graph.
Figure 17. CPU usage percentage
Memory
Active memory remained below the physical capacity installed on each host. Out a total memory of 768 GB, the maximum active memory usage was 534 GB. We didn't observe memory swapping and paging, which indicates that the system was performing as expected. We did not observe any anomalies during testing.
Figure 18. Active memory (GB)
Network usage
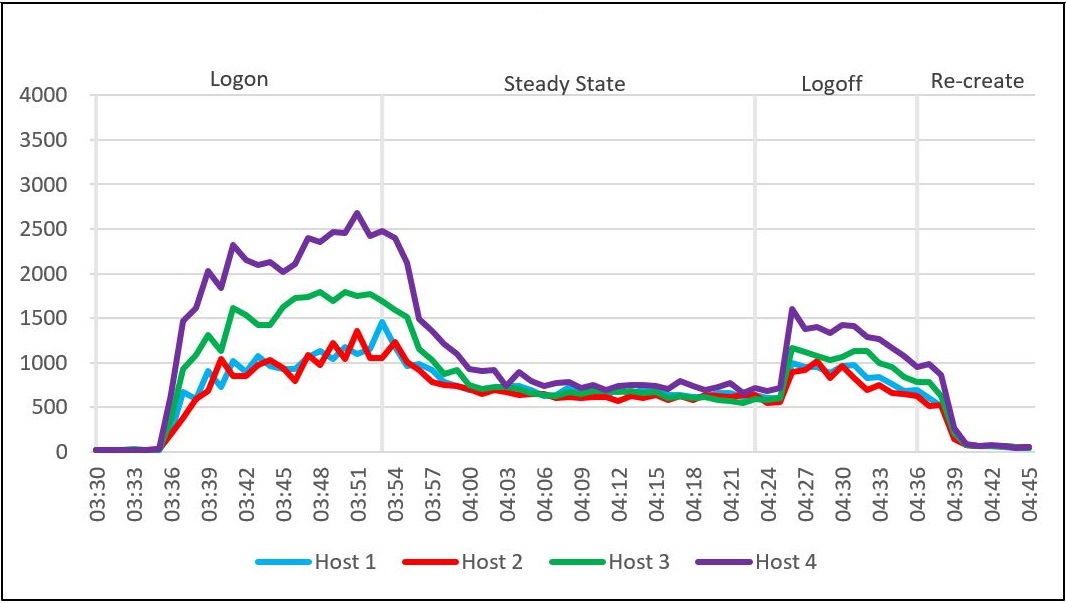
The network utilization on this test was quite low with only 48 users tested, but it still produced quite a high result on one of the hosts. This sometimes happens on the host that hosts the VxRail manager VM. The steady-state average for network usage was 803 Mbps and the steady-state peak was 2,474 Mbps. The maximum host peak was 2,680 Mbps.
Figure 19. Network usage (Mbps)
Storage performance IOPS and latency
IOPS were quite high relative to the number of users tested. Visual Studio was launched as part of the prepare segment of the modified workload, which means it launched very early and at the same time as logins were taking place. There were more read IOPS than write IOPS as users logged on to their desktops and read their profile data. During the steady-state phase this pattern changed where there were more write IOPS than read IOPS.
Cluster latency remained at an acceptable level and below the defined threshold. Write latency was a little high during the steady-state phase and there was one single spike also during the steady-state phase. However, all latency was below the 20 ms threshold.
Note: This stack had only two capacity SSDs per node and should use six per node. This may have led to the higher than usual latency on this test.
Table 12. Storage performance IOPS and latency
Metric
Value
Maximum disk IOPS
18,319
Steady state peak
11,351
Steady state average
6,054
Maximum read + write latency
13.3 ms
Average steady state latency
6.3 ms
User experience
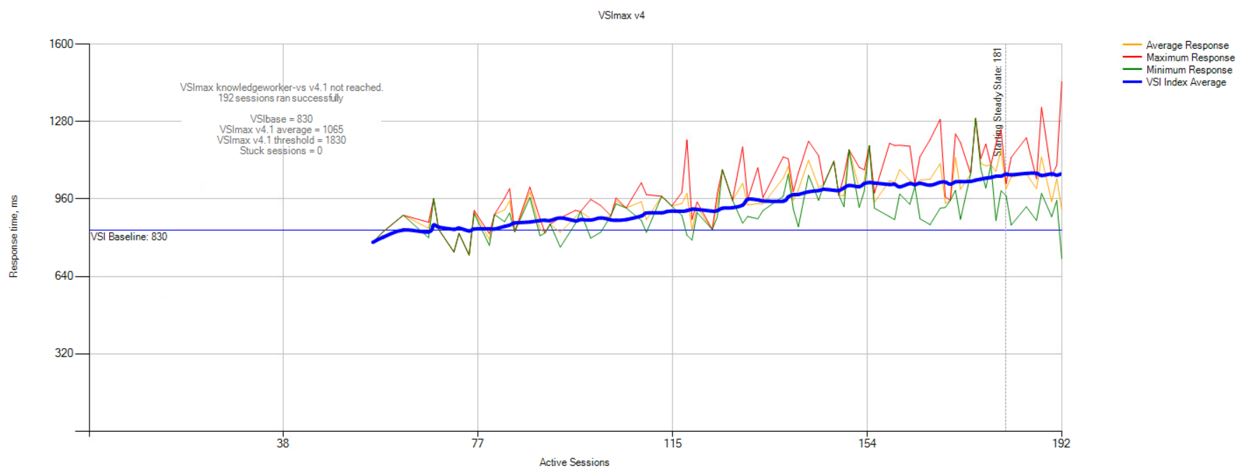
The VSIbase was at an acceptable score. The VSIbase was 830, the VSImax average was 1,065, and the VSImax threshold was 1,830. There were no stuck sessions. The VSI index average shows that the system responded appropriately as additional load was added and behaved in a predictable manner. The response times were tightly grouped, meaning that there was a consistent user experience across VDI sessions.
Figure 20. Login VSI user experience
Login VSI 192-user custom Knowledge Worker workload – Eclipse with Java
The total user density achieved for this test was 192 with 48 users across each compute host.
CPU usage
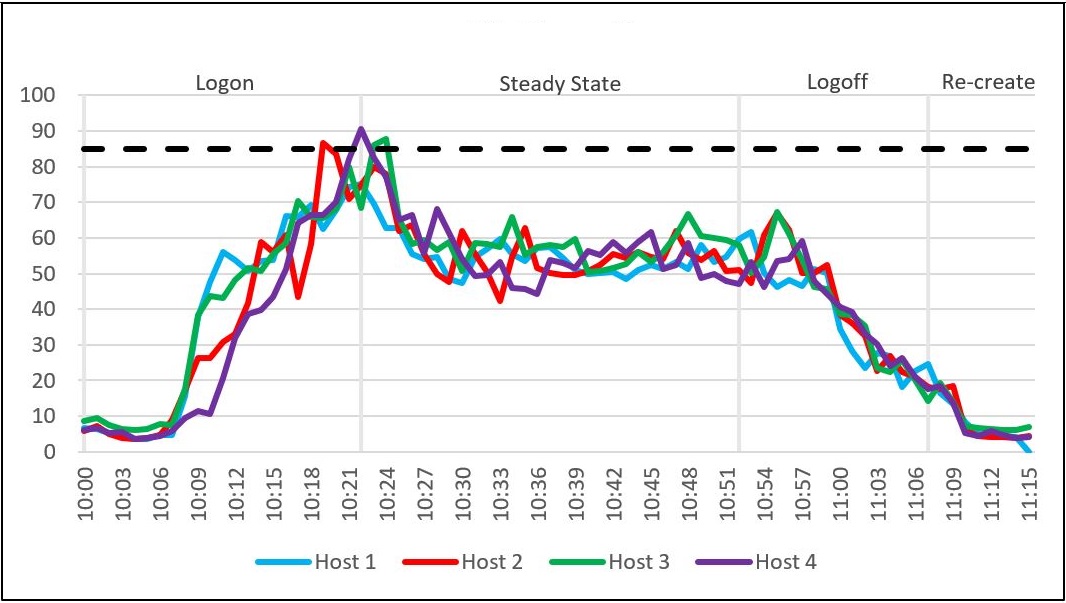
CPU usage rose quickly during the short logon phase. It remained reasonably consistent during the steady-state phase, indicating that Eclipse and the Java program developer activities did not consume as much CPU resources as Visual Studio and C++ did. We did not observe any anomalies during testing.
Figure 21. CPU usage percentage
Memory
Active memory remained below the physical capacity installed on each host. Out a total memory of 768 GB, the maximum active memory usage was 470 GB. We did not observe memory swapping and paging during this test, which indicates that the system was performing as expected. We did not observe any anomalies during testing.
Figure 22. Active memory (GB)
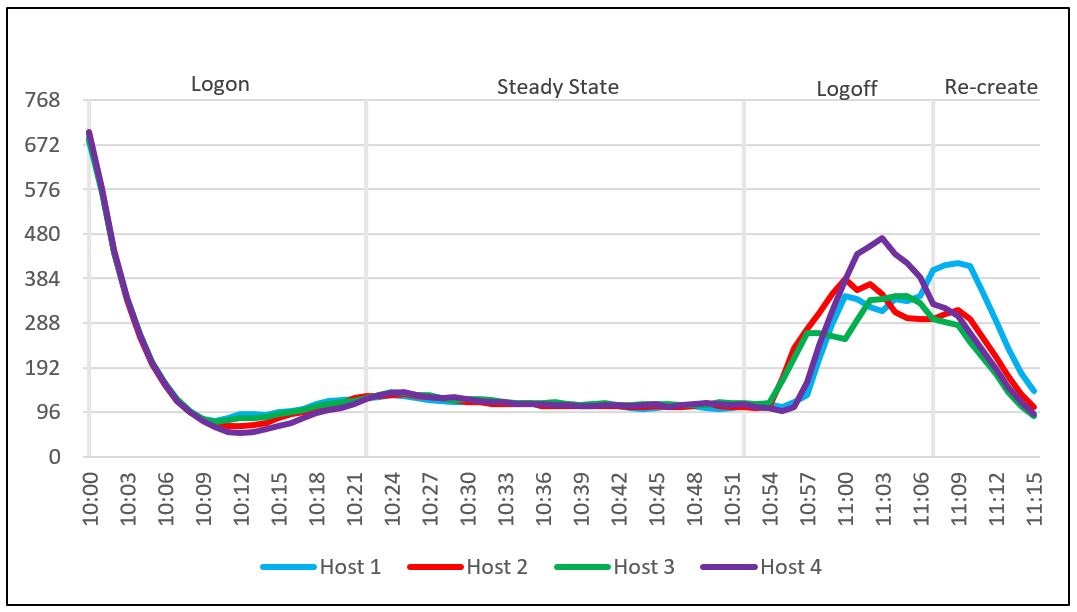
Network usage
The network utilization on this test was quite low with only 48 users tested, but it still produced quite a high result on one of the hosts. This sometimes happens on the host that hosts the VxRail manager VM. The steady-state peak was 3,026 Mbps, the maximum host peak was 3,026 Mbps, and the steady-state average was 559 Mbps.
Figure 23. Network usage Mbps
Storage performance IOPS and latency
IOPS were quite high relative to the number of users tested. Eclipse was launched as part of the prepare segment of the modified workload, which means it launched very early and at the same time as logins were taking place. There were more read IOPS than write IOPS as users logged on to their desktops and read their profile data. During the steady-state phase this pattern changed where there were more write IOPS than read IOPS.
Cluster latency remained at an acceptable level and below the defined threshold. We didn't see any anomalies during testing.
Table 13. Storage performance IOPS and latency
Metric
Value
Maximum disk IOPS
27,592
Steady state peak
7,836
Steady state average
3,407
Maximum read + write latency
1.7 ms
Average steady state latency
1.3 ms
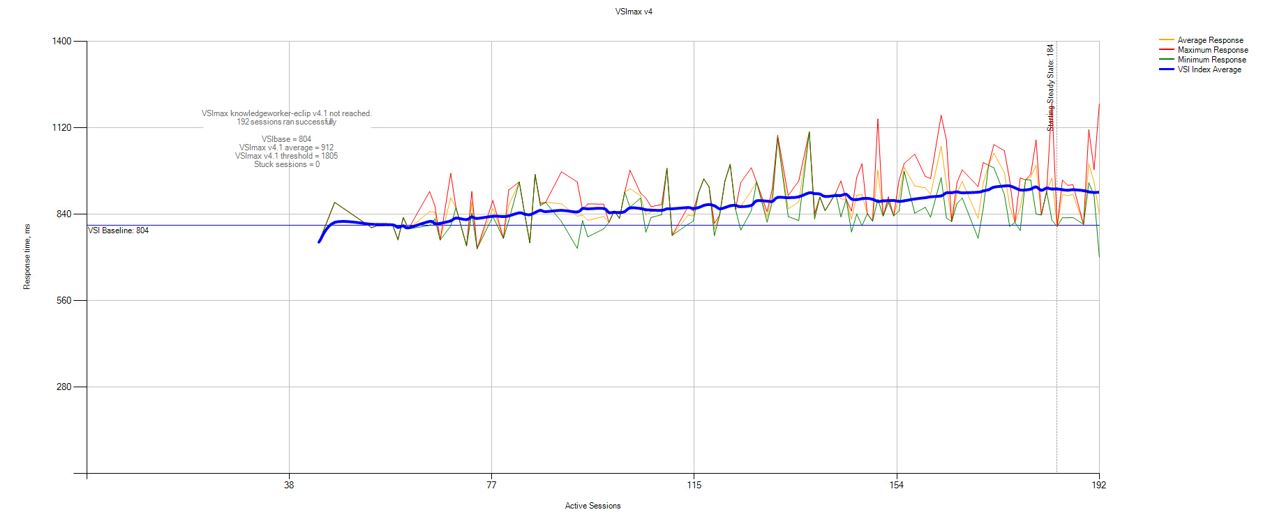
User experience
The VSI base was an acceptable score. The VSIbase was 804, the VSImax average was 912, and the VSImax threshold was 1,805. There were no stuck sessions. The VSI index average shows that the system responded appropriately as additional load was added and the system behaved in a predictable manner. The response times were tightly grouped, meaning that there was a consistent user experience across VDI sessions.