
Measuring user experience
Measuring user experience
-
We ran the NVIDIA nVector Lite tool while testing with the NVIDIA nVector SPECviewperf 13 workload for test case 3 to assess the user experience from the endpoints. We performed the test this way because endpoint monitoring is normally only available with the NVIDIA nVector full suite that contains the default Knowledge Worker workload. For the SPECviewperf 13 workload, we needed the nVector Lite tool and the nVector tool to capture endpoint metrics. The NVIDIA nVector Lite tool measured the following three key metrics from the thin client:
Metric 1: Image Quality–NVIDIA nVector uses a lightweight agent on the VDI desktop and the client to measure image quality. These agents take multiple screens captures on the VDI desktop and on the thin client for later comparison. The structural similarity (SSIM) of the screen capture taken on the client is computed by comparing it to the screen capture taken on the VDI desktop. When the two images are similar, the heatmap reflects more colors above the spectrum shown on the right with an SSIM value closer to 1.0 (see Figure 4). As the images become less similar, the heatmap reflects more colors down the spectrum with a value of less than 1.0. More than a hundred pairs of images across an entire set of user sessions are obtained. The average SSIM index of all pairs of images is computed to provide the overall remote session quality for the entire population of users.
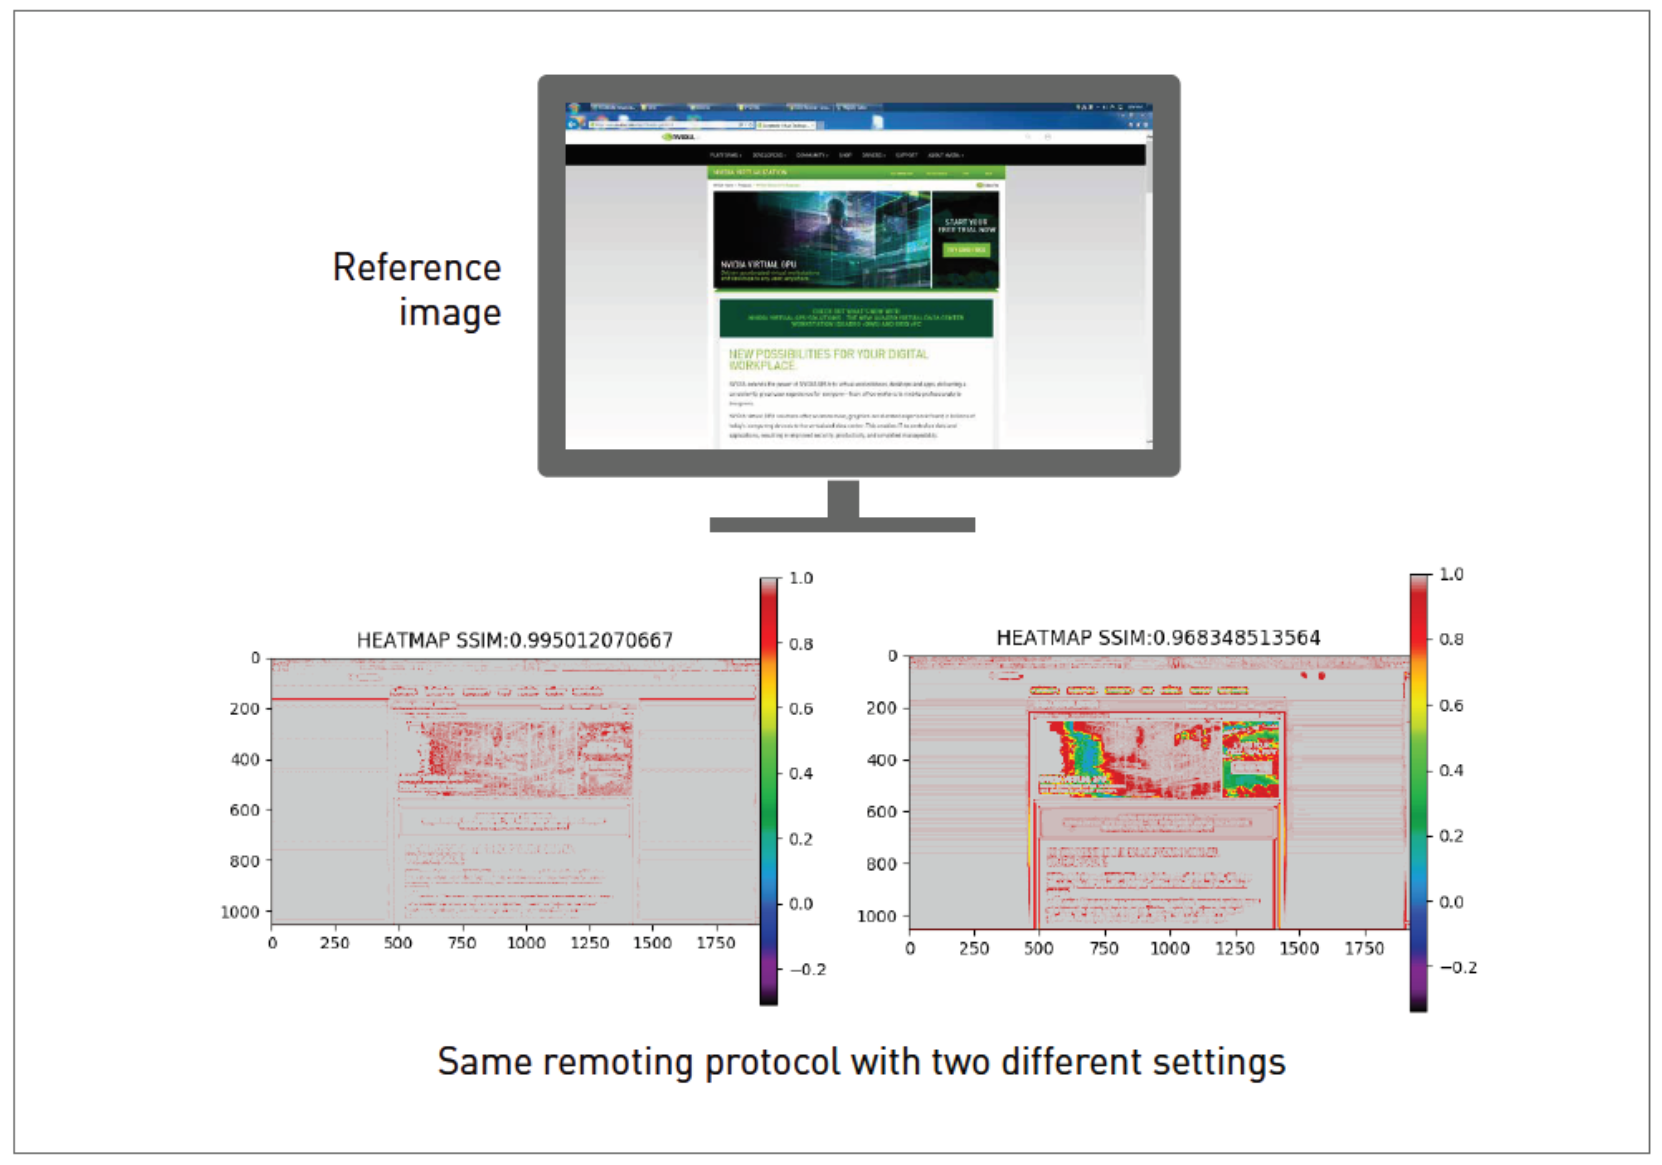
Figure 4. SSIM as a measure of image quality
Metric 2: Frame rate–Frame rate is a common measure of user experience and defines how smooth the experience is. It measures the rate at which frames are delivered on the screen of the endpoint device. For the duration of the workload, NVIDIA nVector collects data on the frames per second (fps) sent to the display device on the end client. This data is collected from thousands of samples and the value of the 90th percentile is taken for reporting. A larger fps indicates a more fluid user experience.
Metric 3: End-user latency–The end-user latency metric defines the level of response of a remote desktop or application. It measures the duration of any lag that an end-user experiences when interacting with a remote desktop or application.