
The test results are based on a model in which the constant-bandwidth safety and security video traffic remained unaffected during a single node maintenance cycle, disk rebuild, SP failure, or non-disruptive upgrade.
The NFSv2 and NFSv3 protocols are stateless, and in almost all cases, perform best with Dynamic Allocation of IP addresses. Our test results are based on a model in which the constant-bandwidth safety and security video traffic remained unaffected during a single node maintenance cycle, disk rebuild, or nondisruptive upgrade.
We performed all tests with a per-camera bandwidth of 5 Mb/s, so a single that handles 37 MB/s can support 60 such cameras.
We performed all tests with node or drive failures in place in the cluster (for example, with Isilon FlexProtect running) to ensure a worst-case scenario for all sizing parameters. Maximum per recorder Bandwidth may vary based on the configuration of the SVR server used.
The following table provides bandwidth-sizing guidelines based on our test results.
| Cluster | version | OneFS version | per node | Bandwidth MB/s (Mb/s) | Drives size tested | |
| Per | Per node | |||||
| A2000 | 1.3.0.2 | 8.2.2 | 1 | 37.5 (300) | 37.5 (300) | 10 TB |
| 2 | 30 (240) | 60 (480) | 10 TB | |||
A minimum 4-node Isilon cluster providing 1440 Mb/s can grow in increments of 2 nodes. Each each increment adds 960 Mb/s. A minimum of 2 physical servers that are configured with multi-role. Each role is configured to handle a maximum of 240 Mb/s. A multi-role server can support 1 to 4 roles.
| Cluster | version | OneFS version | per node | Bandwidth MB/s (Mb/s) | Drives size tested | |
| Per | Per node | |||||
| A2000 | 1.3.0.2 | 8.2.2 | 1 | 62.5 (500) | 62.5 (500) | 10 TB |
| 2 | 30 (240) | 60 (480) | 10 TB | |||
The Isilon A2000 test results are shown in the following graphics.
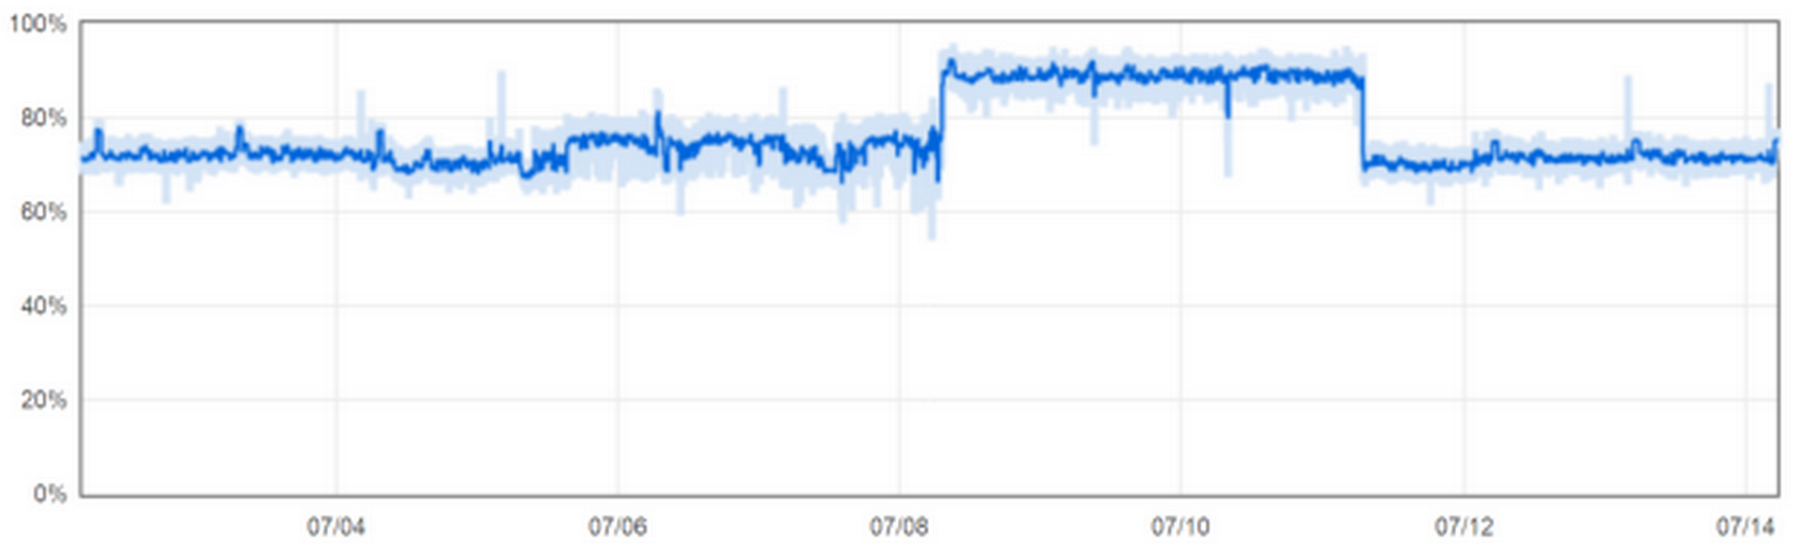
The CPU utilization percentage is between 70 and 90 during failure and recovery scenarios, such as Smartfail and adding the failed node back in.
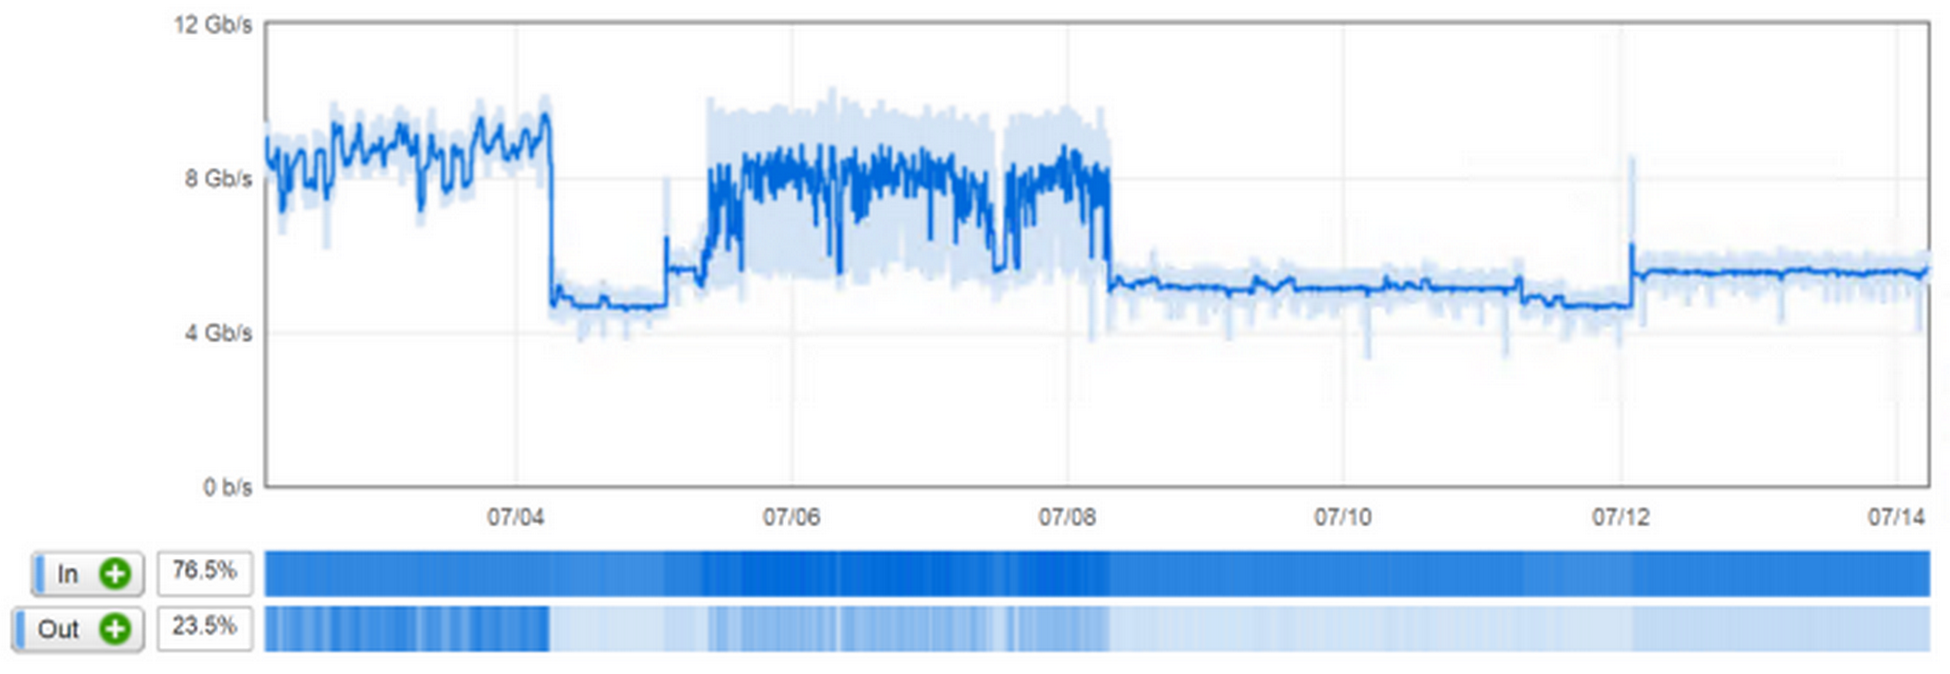
The disk throughput rate displays the total amount of data being read from and written to the disks in the cluster.

The disk operations rate displays the average rate at which the disks in the cluster are servicing data read, write and change requests or transfers.
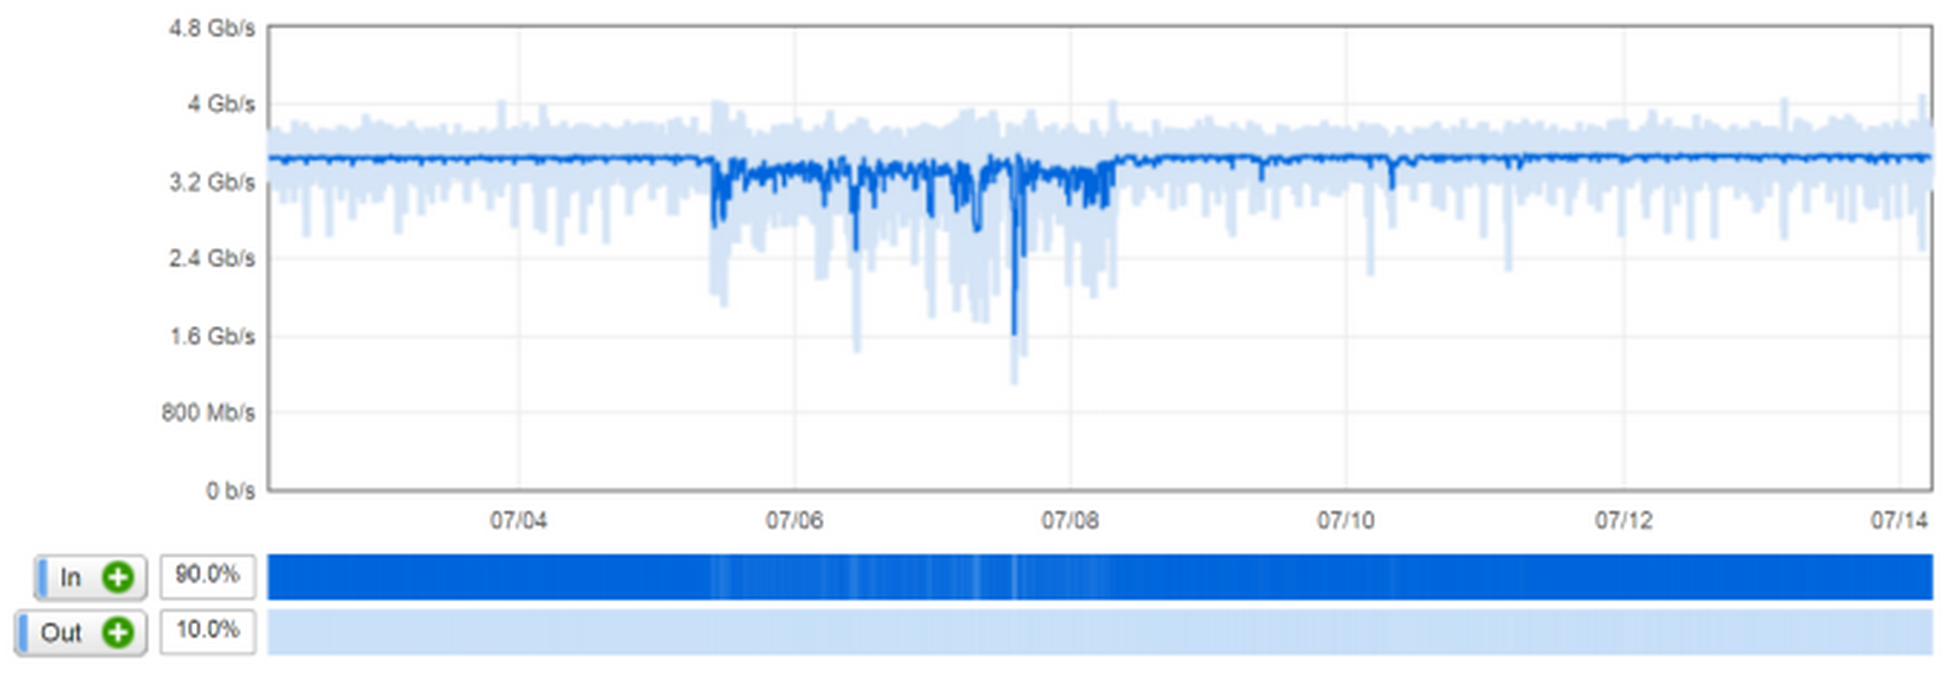
The external network throughput rate displays the total amount of data that passed through the external network interfaces in the monitored cluster.
Configuration details
| Component | Description |
| Server Model | PowerEdge R740 |
| Hypervisor version | ESXi 6.7 |
| Processor Model | Intel(R) Xeon(R) Gold 6212U CPU @ 2.40GHz |
| Number of Processors | 2 |
| Cores per socket | 12 |
| Memory | 128 GB |
| Component | Description |
| Storage | Isilon A2000 |
| OneFS | 8.2.2 |
| Disk Type | NLSAS |
| Disk Pools | 24 |
| Disk count per Pool | 24 |
| Disk capacity | 12 TB |
| RAID | RAID 6 (6+2) |
| Protocol | FC |
| LUN capacity | 12 TB |
| Component | Description |
| Guest OS | Ubuntu OS |
| vCPU | 6 vCPU |
| Memory | 12 GB |
| NIC type | VMXNET3 |
| Video disk size | 20 TB |
| Video Disk block size | N/A |
| Component | Description |
| Camera Type | Virtual Camera |
| Codec | H2.64 |
| Bitrate | 20 Mb/s and 5 Mb/s |
| FPS | 30 fps |
| Resolution | 1080p |