
We performed tests with the continuous archive feature to archive video to Dell PowerScale clusters. Dell recommends scheduling archiving so that not all cameras are archived simultaneously.
To maximize performance for safety and security workloads, the Dell Technologies Safety & Security Lab recommends that the cluster utilization does not exceed 80 percent capacity.
Sizing guidelines are based on a combination of storage capacity and per node bandwidth. When sizing a cluster, make sure to evaluate the number of servers that write and read from nodes in addition to overall storage capacity.
We used aggregated 10GbE interfaces per node for maximum resiliency. Each 10GbE interface is connected to a different switch in a Dell OS10 VLTi domain.
We performed all tests with drive failures in the cluster (for example, with PowerScale FlexProtect running) to ensure a worst-case scenario for all sizing parameters.
The following table shows details of Archive DB performance with PowerScale clusters during lab testing:
| Array | Milestone version | OneFS | Recorders per node | LIve DB (Block) Bandwidth (MB/s) | Archive DB Bandwidth (MB/s) | Disk type | ||
| Write per recorder | Total write | Per recorder | Per node | |||||
PowerScale A3000 | 2023 | 9.5.0.2 | 1:1 | 55 | 55 | 55 | 55 | 12 TB |
| 1:2 | 55 | 110 | 55 | 110 | ||||
| 2022 | 9.2.1 | 1:1 | 62.5 | 62.5 | 62.5 | 62.5 | 12 TB | |
| 2:1 | 62.5 | 125 | 62.5 | 125 | ||||
Configuration
| Component | 2023 | 2022 |
| Storage | PowerScale A3000 | PowerScale A3000 |
| OneFS | 9.5.0.2 | 9.2.1 |
| Disk type | SATA | SATA |
| Protection scheme | + 2d:1n | + 2d:1n |
| Protocol | SMB | SMB |
| Single node capacity | 260 TB | 200 TB |
| Component | 2023 | 2022 |
| Guest OS | Windows Server 2019 Standard | Windows Server 2019 Standard |
| vCPU | 12 | 16 |
| Memory | 20 GB | 14GB |
| NIC type | VMXNET3 | VMXNET3 |
| Video disk size | 3 TB | 50 TB |
| Component | 2023 | 2022 |
| Camera type | Virtual camera | Virtual camera |
| Codec | H.264 | H.264 |
| Bitrate | 4 mbps | 4 mbps |
| FPS | 30 | 30 |
| Resolution | 1920x1080 | 720p |
Milestone 2023 A3000 graphs
The A3000 results are shown in the following graphics.
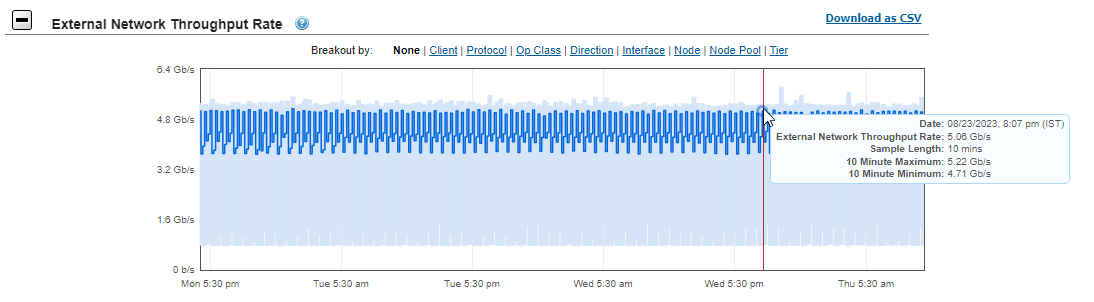
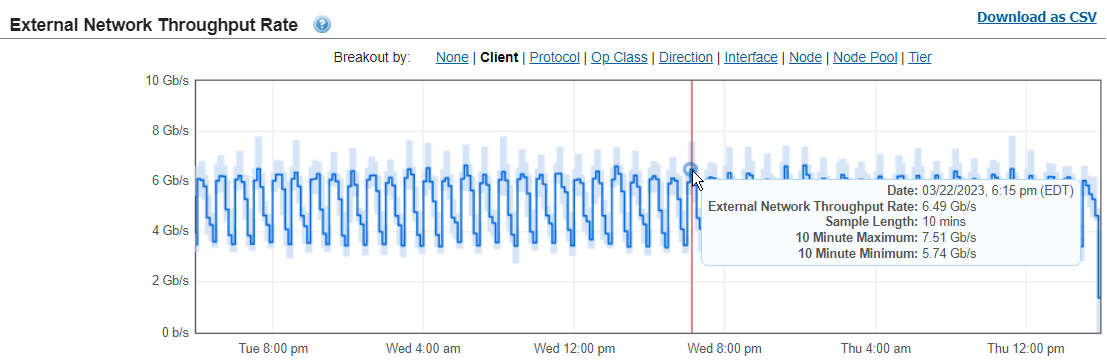
The external network throughput rate displays the total amount of data that passed through the external network interfaces in the monitored cluster.
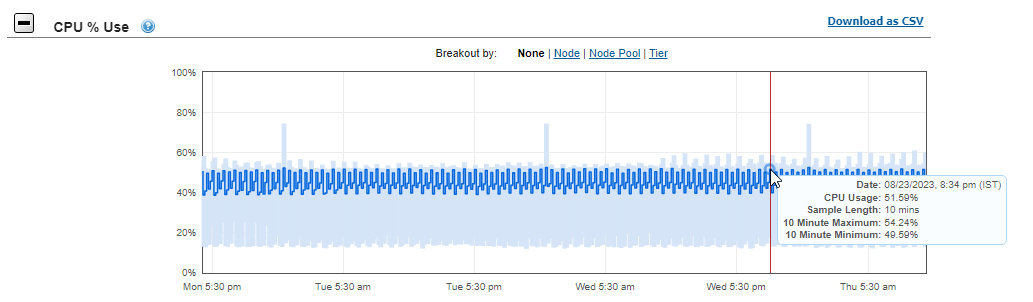
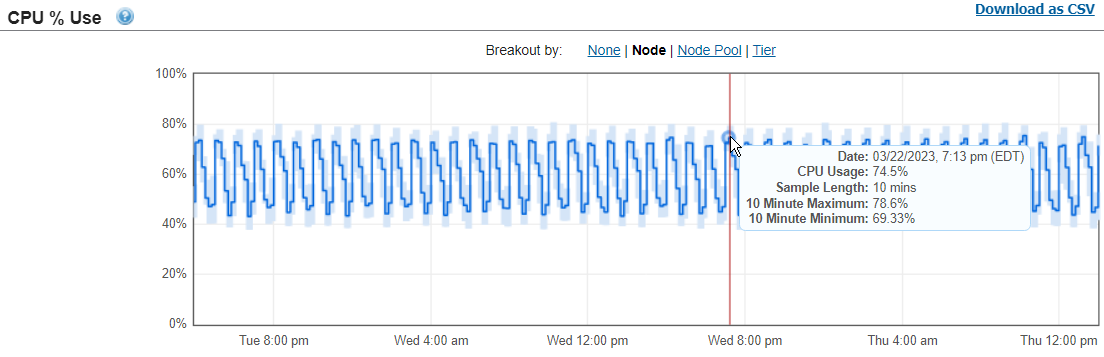
The CPU utilization percentage averages 60 percent during failure and recovery scenarios, such as Smartfail and adding the failed node back in.
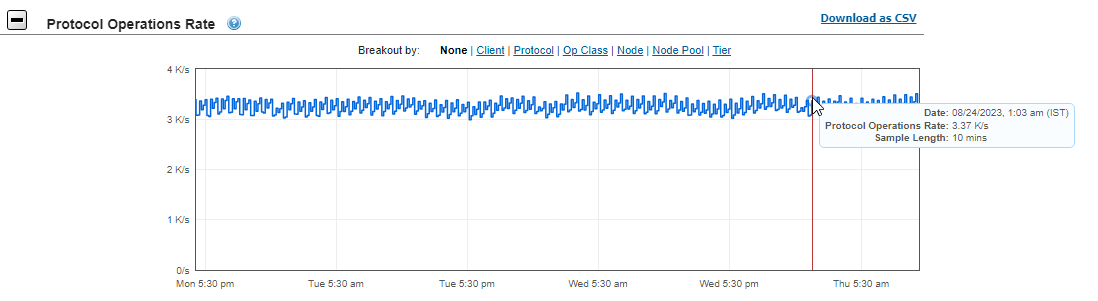
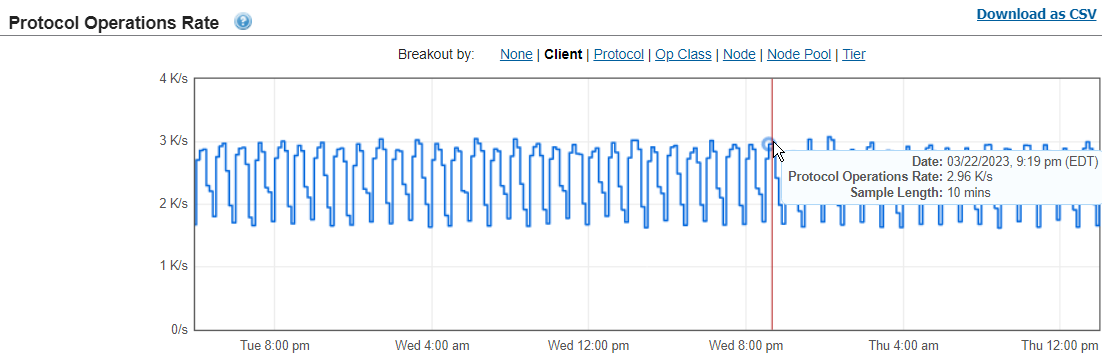
The protocol operations rate displays the average rate at which the disks in the cluster are servicing data read, write and change requests or transfers.
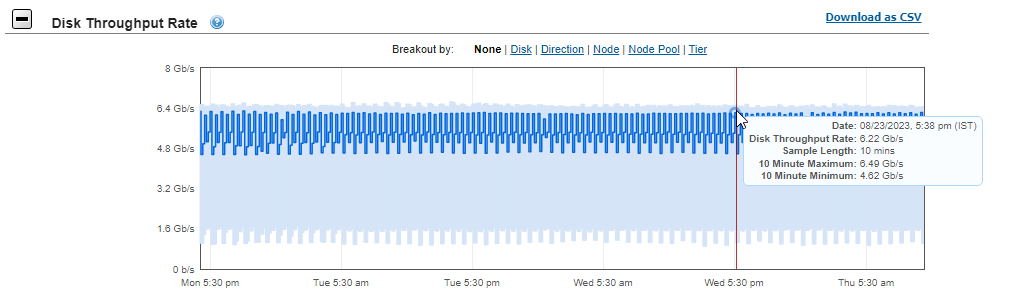
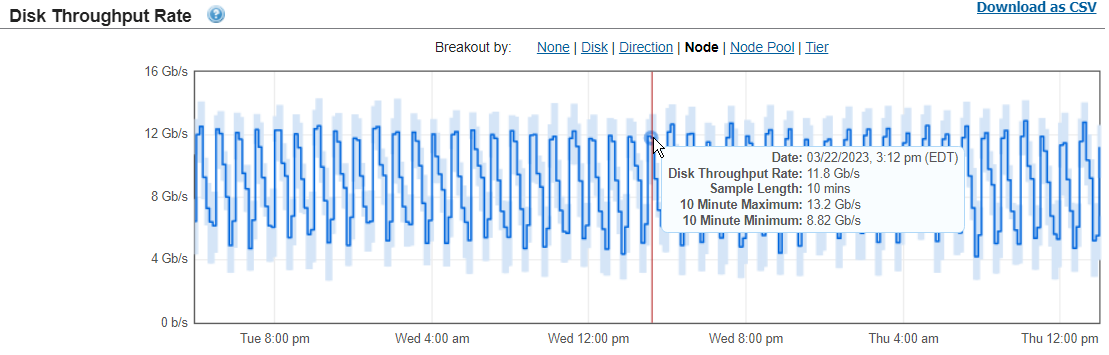
The disk throughput rate displays the total amount of data being read from and written to the disks in the cluster.
Milestone 2022 A3000 graphs
The A3000 results are shown in the following graphics.
The external network throughput rate displays the total amount of data that passed through the external network interfaces in the monitored cluster.
The CPU utilization percentage averages 60 percent during failure and recovery scenarios, such as Smartfail and adding the failed node back in.
The protocol operations rate displays the average rate at which the disks in the cluster are servicing data read, write and change requests or transfers.
The disk throughput rate displays the total amount of data being read from and written to the disks in the cluster.