
The test results are based on a model in which the constant-bandwidth safety and security video traffic remained unaffected during a single node maintenance cycle, disk rebuild, or node failure.
We performed all tests as follows:
- With NIC failures to ensure a worst-case scenario for all sizing parameters.
- With drive failures in place in the H7000 cluster to ensure a worst-case scenario for all sizing parameters.
- With a per-camera bandwidth of 1 Mb/s and 5 Mb/s.
The following table provides bandwidth-sizing guidelines based on our test results.
Configuration
| Component | Details |
| VMS | Genetec Security Center |
| Version | 5.11 |
| Component | Bandwidth MB/s (Mb/s) |
| Baseline per Cluster bandwidth | 2500 (20000) |
| Baseline per Node bandwidth | 625 (5000) |
| Baseline per Archiver bandwidth | 62.5 (500) |
| Disk Smartfail per Cluster bandwidth | 1250 (10000) |
| Disk Smartfail per Node bandwidth | 312 (2500) |
| Disk Smartfail per Archiver bandwidth | 62.5 (500) |
| Maximum supported cameras | 6000 |
| Maximum supported bandwidth | 1250 (10000) |
| Number of Archivers per Node | 5 |
| Number of Archivers per cluster | 20 |
| Disk rebuild -Tier 1 | 3 days 15 hours |
| Component | Details |
| Server Model | PowerEdge R660 |
| Hypervisor version | VMware ESXi, 8.0.2, 22380479 |
| Processor Model | Intel(R) Xeon(R) Gold 6430 @ 2.1 GHz |
| Number of Processors | 2 |
| Cores per socket | 32 |
| Logical Processors | 128 |
| Memory | 256 GB |
| Disk controller | PERC H965i Front (Embedded) |
| VMS Storage Tier | 1 |
| Component | Details |
| Compute platform | Raid5-SSD-Local Storage |
| Total No. of VMs per ESXi host | 4 |
| Guest OS | Windows Server 2022 Standard |
| vCPU | 12 |
| vMemory | 16 GB |
| vNIC type | VMXNET3 |
| Video disk size | 8 TB |
| Component | Details |
| Storage | PowerScale H7000 |
| Nodes per cluster | 4 |
| OneFS | 9.5.0.2 |
| Disk type | SATA HDD |
| Protection scheme | + 2d:1n |
| Disks per node | 20+2 |
| Disk capacity | 20 TB |
| Protocol | SMB |
| CA enabled | Yes |
| VMS Storage Tier | 1 |
| Component | Details |
| Camera type | Virtual Camera |
| Number of cameras | 300 and 100 |
| Bitrate | 1 and 5 Mbps |
| Codec | H264 |
| FPS | 30 |
| Resolution | 1280*720 |
| Component | Details | |
| ESXi host (%) | Max. CPU utilization | 34.5 |
| Avg. CPU utilization | 27 | |
| Max memory utilization | 101 GiB | |
| Per VM (%) | Max. CPU utilization | 38 |
| Avg. CPU utilization | 32 | |
| Max. memory utilization | 11 GiB | |
| Windows (%) | Max. CPU utilization | 35 |
| Avg. CPU utilization | 26 | |
| Max. memory utilization | 35 | |
| Average IO size | 49 | |
| Total IOPS | 73 | |
| Disk IOPS | 50 | |
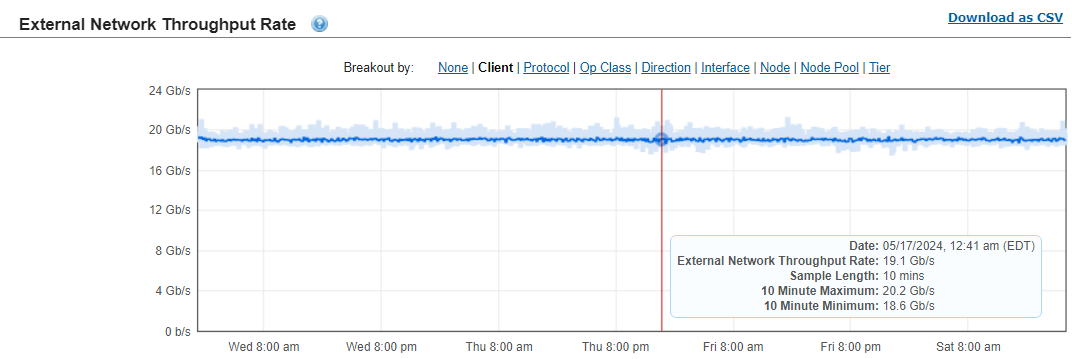
Baseline LiveDB graphs
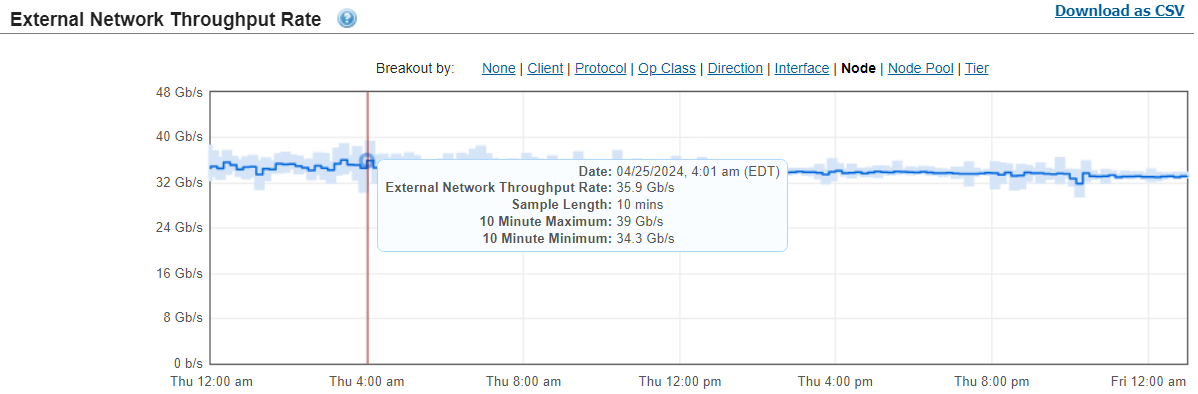
The external network throughput rate displays the total amount of data that passes through the external network interfaces in the monitored cluster.
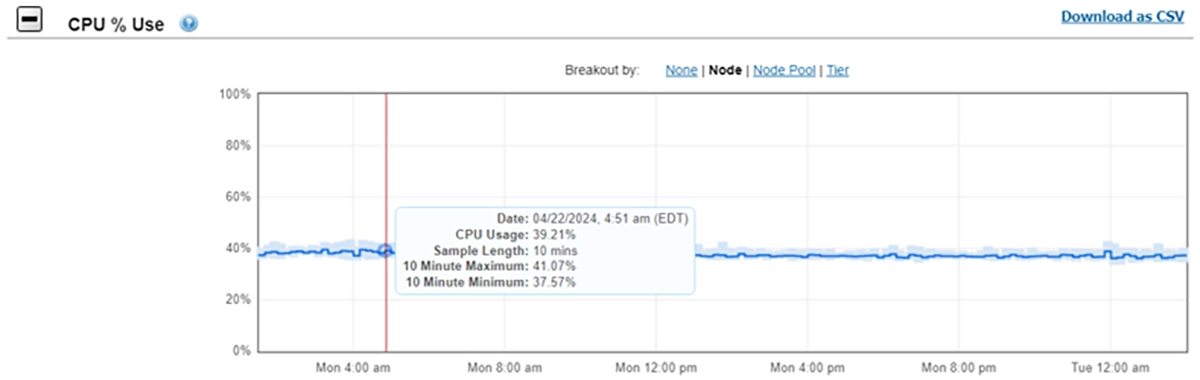
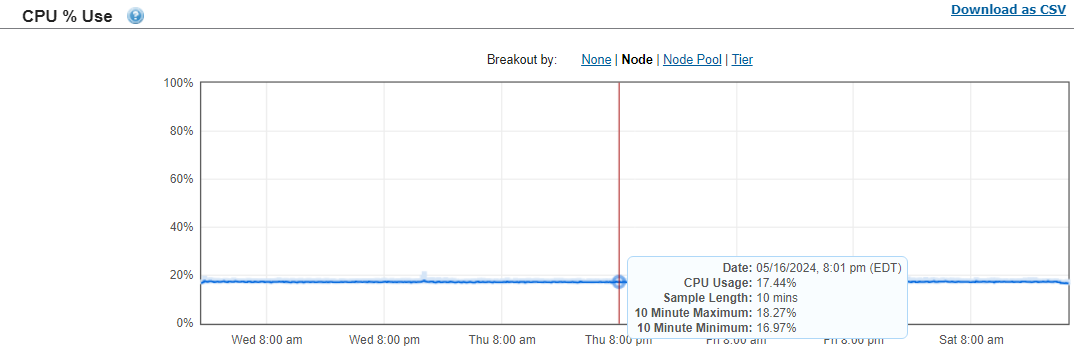
The CPU utilization percentage averages 41 percent during failure and recovery scenarios, such as Smartfail and adding the failed node back in.
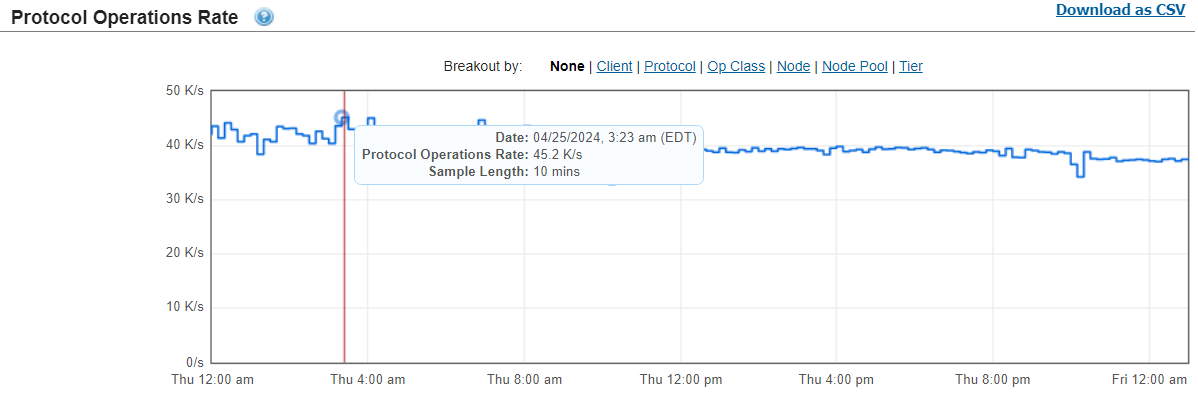
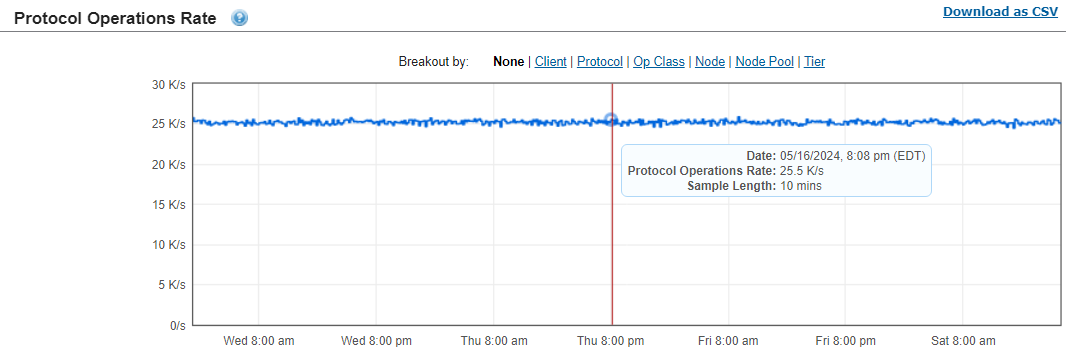
The protocol operations rate displays the average rate at which the disks in the cluster are servicing data read, write, and change requests or transfers.
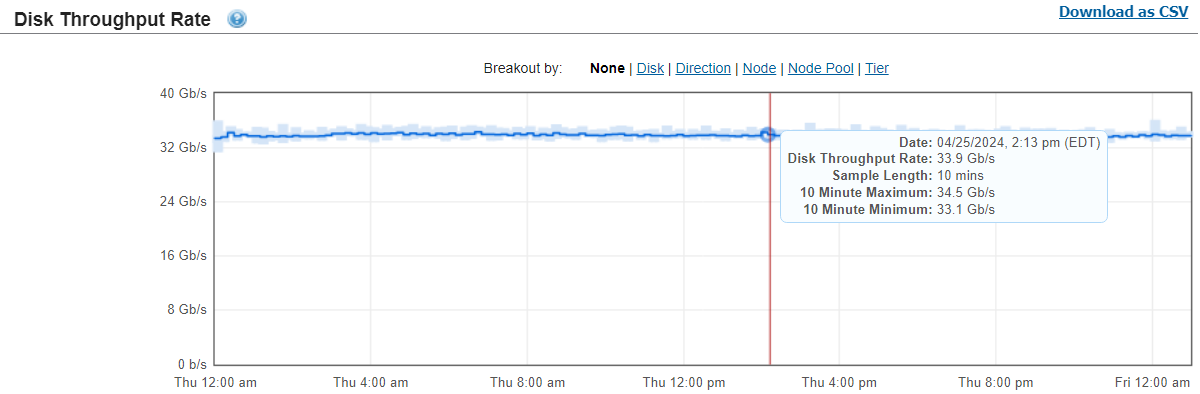
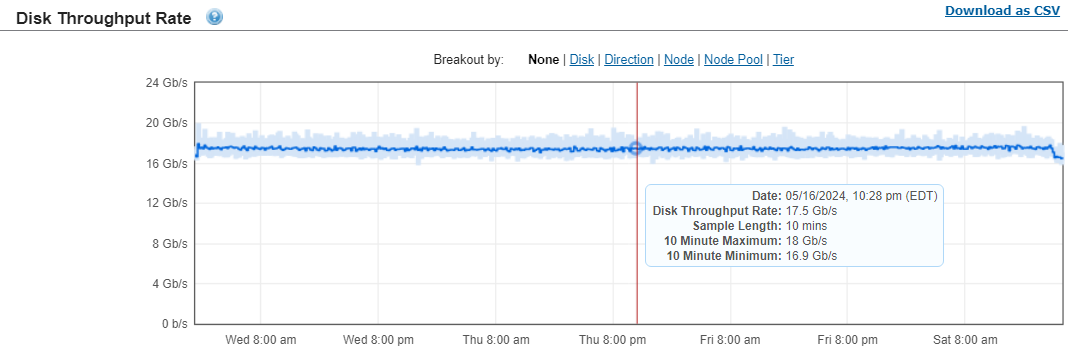
The disk throughput rate displays the total amount of data being read from and written to the disks in the cluster.
Failure mode LiveDB graphs
The external network throughput rate displays the total amount of data that passes through the external network interfaces in the monitored cluster.
The CPU utilization percentage averages 41 percent during failure and recovery scenarios, such as Smartfail and adding the failed node back in.
The protocol operations rate displays the average rate at which the disks in the cluster are servicing data read, write, and change requests or transfers.
The disk throughput rate displays the total amount of data being read from and written to the disks in the cluster.