
The test results are based on a model in which the constant-bandwidth safety and security video traffic remained unaffected during a single node maintenance cycle, disk rebuild, or node failure.
We performed all tests as follows:
- With NIC failures to ensure a worst-case scenario for all sizing parameters.
- With drive failures in place in the A3000 cluster to ensure a worst-case scenario for all sizing parameters.
The following table provides bandwidth-sizing guidelines based on our test results.
Configuration
| Component | Details |
| VMS | Avigilon Control Center Software |
| Version | 7.14.22.2 |
| Component | Bandwidth MB/s (Mb/s) |
| Per Cluster Bandwidth | 465 (3720) |
| Per Node Bandwidth | 116.25 (930) |
| Per Cluster Bandwidth (mission critical) | 330 (2640) |
| Per Node Bandwidth (mission critical) | 82.5 (660) |
| Per Recorder | 27.5 |
| Number of Archivers per Node | 3 |
| Number of Recorders per cluster | 12 |
| Component | Details |
| Server Model | PowerEdge R740xd |
| Hypervisor version | VMware ESXi, 7.0.2, 17630552 |
| Processor Model | Intel(R) Xeon(R) Gold 6126 CPU @ 2.60GHz |
| Number of Processors | 2 |
| Cores per socket | 12 |
| Logical Processors | 48 |
| Memory | 190GB |
| Disk controller | PERC R740p |
| VMS Storage Tier | N/A |
| Component | Details |
| Compute platform | vSAN AllFlash Storage |
| Total No. of VMs per ESXi host | 3 |
| Guest OS | Windows Server 2019 Standard |
| vCPU | 8 |
| vMemory | 16 GB |
| vNIC type | VMXNET3 |
| Video disk size | 40 TB |
| Component | Details |
| Storage | PowerScale A3000 |
| Nodes per cluster | 4 |
| OneFS | 9.5.0.0 |
| Disk type | HDD SATA |
| Protection scheme | + 2d:1n |
| Disks per node | 40 |
| Disk capacity | 12 TB |
| Protocol | SMB |
| CA enabled | Yes |
| VMS Storage Tier | 1 |
| Component | Details |
| Camera type | Virtual Camera |
| Number of cameras | 600 |
| Codec | H264 |
| Bitrate | 5 Mbps |
| FPS | 30 |
| Resolution | 1280x720 |
| Component | Category | Details |
| ESXi host (%) | Max. CPU utilization | 14.70% |
| Avg. CPU utilization | 14% | |
| Max memory utilization | 42% | |
| Per VM (%) | Max. CPU utilization | 32.68% |
| Avg. CPU utilization | 13.22% | |
| Max. memory utilization | 32.95% | |
| Windows (%) | Max. CPU utilization | 32.68% |
| Avg. CPU utilization | 13.22% | |
| Max. memory utilization | 32.95% | |
| Read IOPS | 31.496 | |
| Write IOPS | 45.141 | |
| Disk Rebuild | Tier 1 | N/A |
Mission critical graphs
The disk throughput rate displays the total amount of data being read from and written to the disks in the cluster.
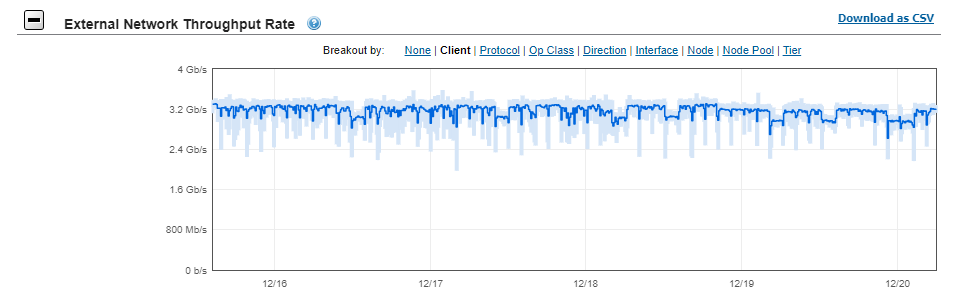
The external network throughput rate displays the total amount of data that passes through the external network interfaces in the monitored cluster.
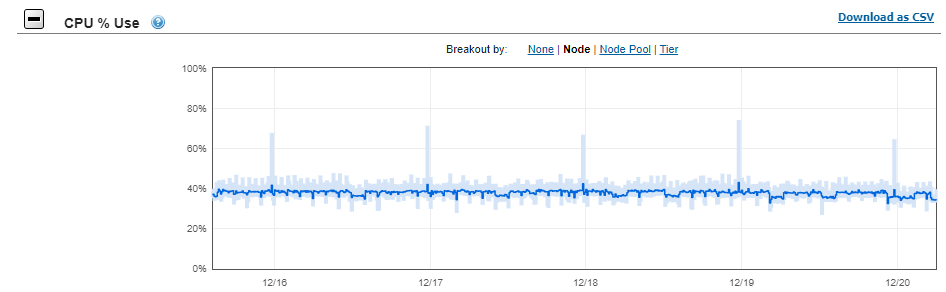
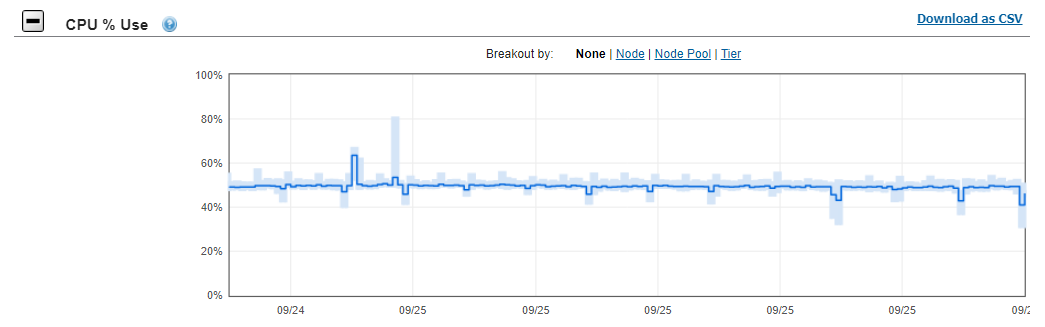
The CPU utilization percentage averages 41 percent during failure and recovery scenarios, such as Smartfail and adding the failed node back in.
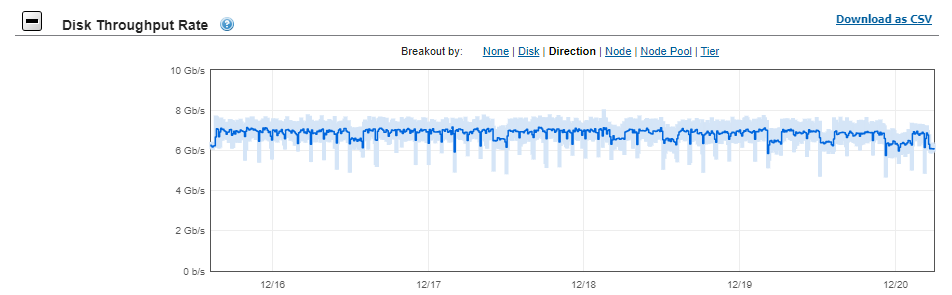
The disk throughput rate displays the total amount of data being read from and written to the disks in the cluster.
Cluster baseline graphs
The disk throughput rate displays the total amount of data being read from and written to the disks in the cluster.
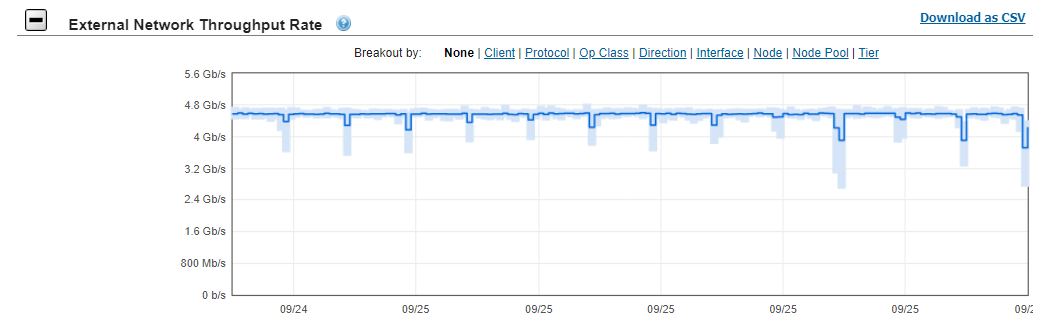
The external network throughput rate displays the total amount of data that passes through the external network interfaces in the monitored cluster.
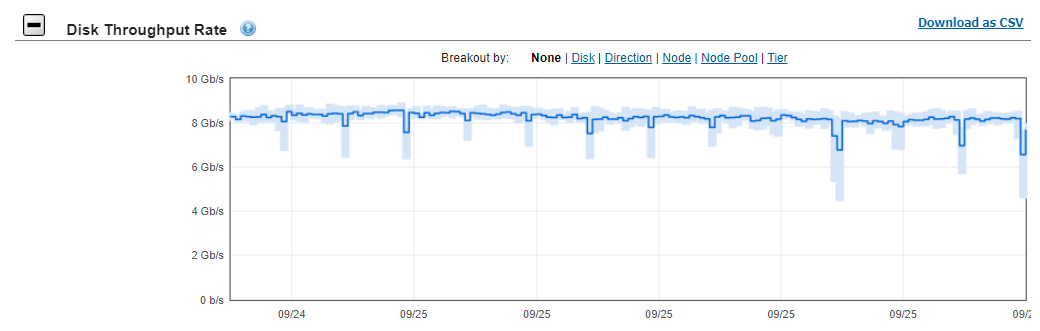
The disk throughput rate displays the total amount of data being read from and written to the disks in the cluster.