Image model training
Image model training
-
Model types can have a major impact on storage performance, as shown in the previous exercise. The goal of this validation was to understand how the storage performance changes when training a dataset of images.
Table 5. ResNet training system information
Configurations
ADD HEADER
ADD HEADER
Configuration 1
2x 8-way servers (16xH100 GPUs)
4-node PowerScale F600P cluster
Configuration 2
2x 8-way servers (16xH100 GPUs)
8-node PowerScale F600P cluster
The following list provides the details of our validation setup:
- Storage Impact – Measure the Dell PowerScale file system impact during training operations. Add PowerScale nodes and examine the change in file system performance.
- Training performance – Examine the training performance when scaling the PowerScale cluster with additional nodes.
Model architecture
ResNet-50 is a real-world image classification dataset that has become the standard benchmark to characterize the performance of a deep learning training workflow on storage and GPU compute platforms. This benchmark performs training of an image classification convolutional neural network (CNN) on labeled images using MXNet. Essentially, the system learns whether an image contains a cat, dog, car, train, and so on. The well-known ILSVRC2012 image dataset—often referred to as ImageNet—was used. This dataset contains 1,281,167 training images in 144.8 GB1. All images are grouped into 1000 categories or classes.
The individual JPEG images in the ImageNet dataset were converted to RecordIO format. The dataset was not resized nor normalized and no preprocessing was performed on the raw ImageNet JPEG images. It maintains the image compression offered by the JPEG format, and the total size of the dataset remained roughly the same (148 GB). The average image size was 115 KB.
Storage performance
The following table summarizes the findings during the testing. When the PowerScale cluster scales from 4 to 8 nodes, there is a 41% reduction in CPU cycles and 50% reduction in NFS ops across the cluster nodes. The training performance remains consistent for both images/sec per GPU and GPU utilization.
Table 6. Results summary of PowerScale cluster performance.
PowerScale Cluster size
CPU
NFS Ops
Images/sec/GPU
GPU %
4 Nodes
13.6%
2.5G/node
5370
99%
8 Nodes
8.1%
1.2G/node
5366
99%
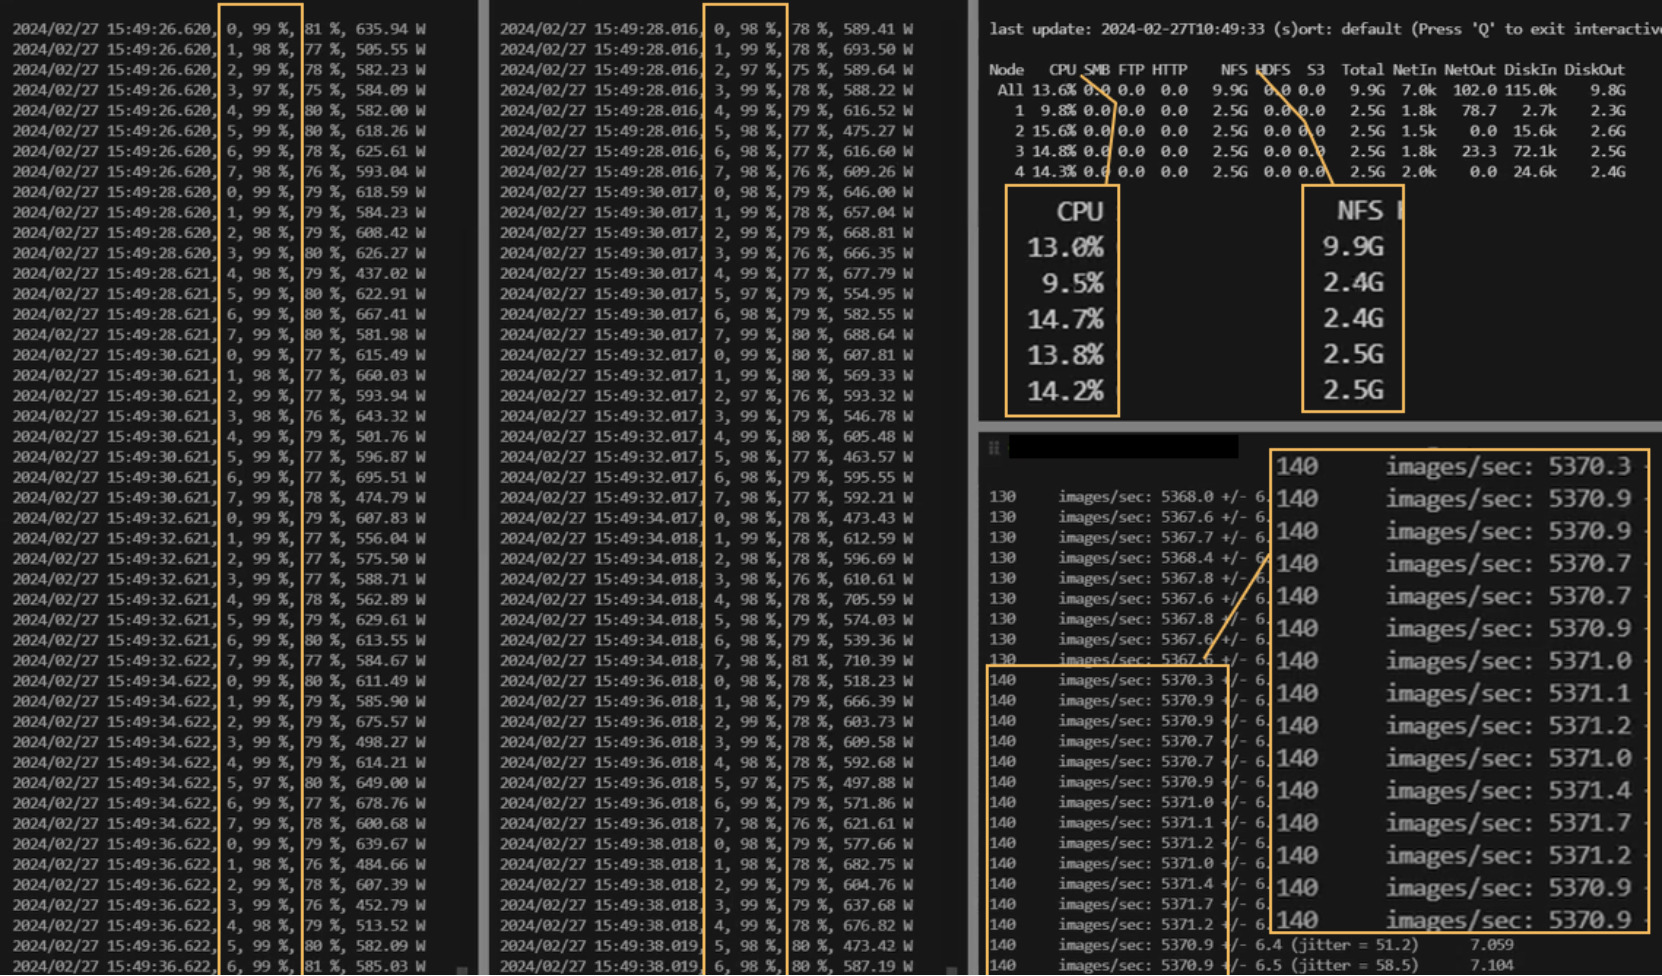
The following figure shows the performance of the PowerScale 4 node cluster through isi statistics, NVIDIA SMI, and the ResNet training logs. The cluster performance in the upper right corner shows the CPU and NFS statistics while the left shows the GPU utilization as reported by the compute nodes. The bottom-right display shows the images per second per GPU that the system is processing.
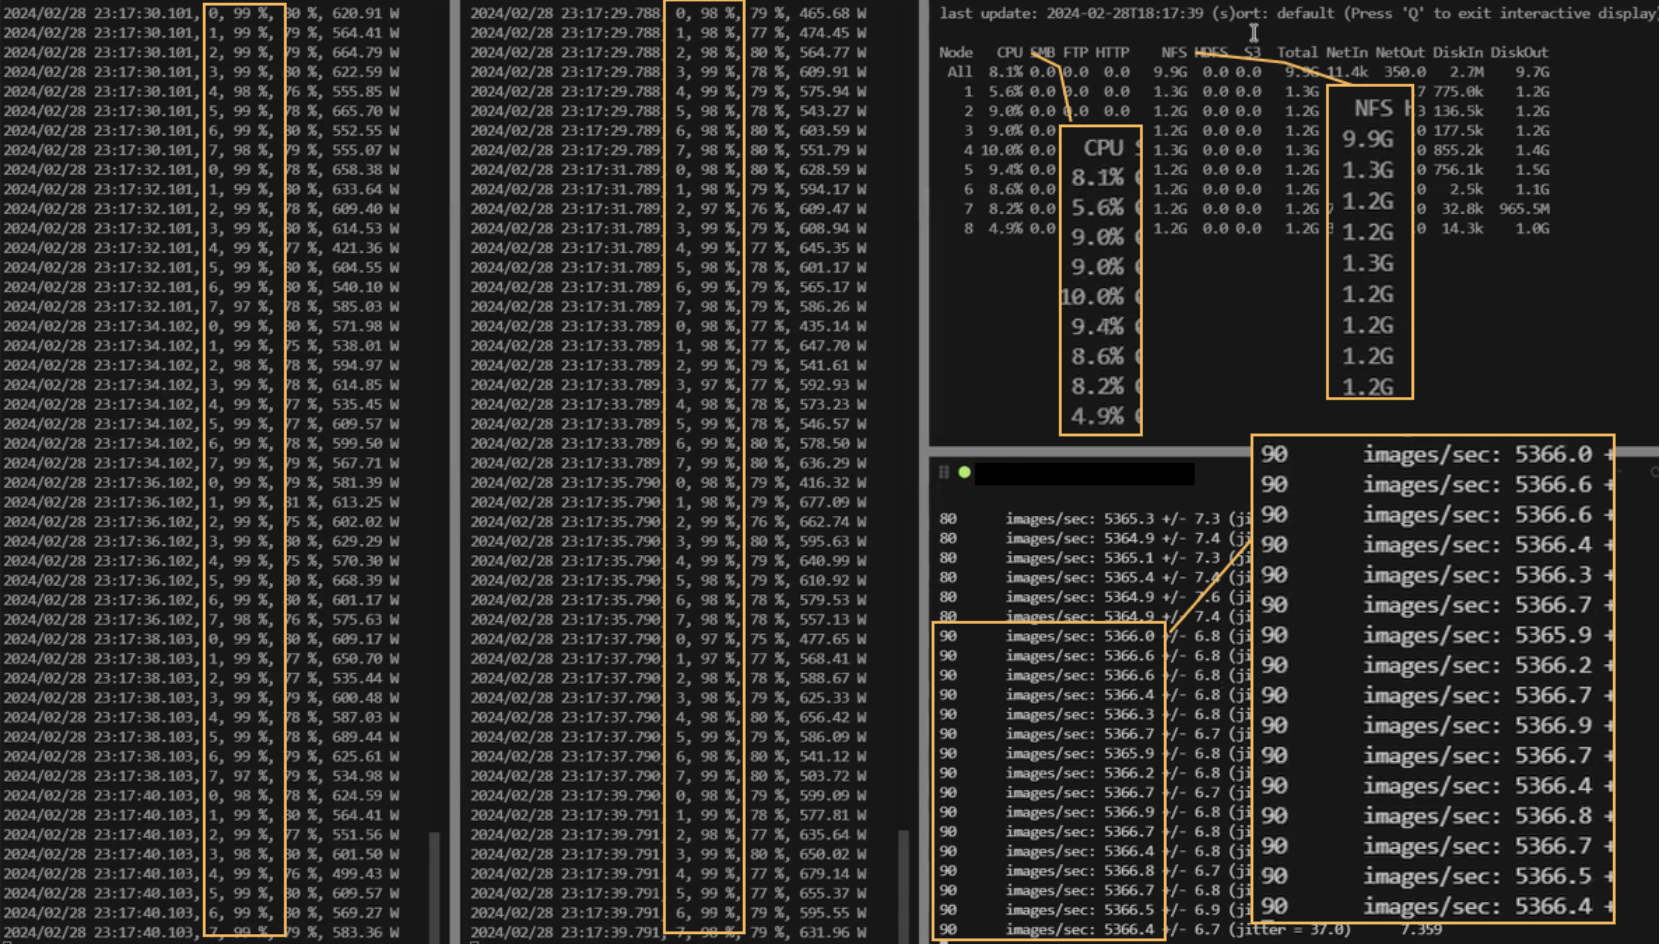
This following image shows the performance of the PowerScale cluster after adding 4 additional nodes. Here, we see the reduction in cluster CPU and NFS ops across the 8 PowerScale nodes while the GPU % remains at 99%, and images per second per GPU remains consistent with the 4 node training performance. In both instances, the GPUs were 99% active and therefore fully utilized for the duration of the training exercises.