
Storage latency
Storage latency
-
For OLTP workloads, physical reads from storage are generally random small-block I/O. Database and application performance depend on how quickly data can be read from storage. Thus, the lower the read latency the faster the application users can access critical data. SQL Server commonly performs thousands or millions of reads per hour depending on the business load.
Windows latency
The following figure shows the average storage latency for the Windows Server VMs. The blue bars indicate the average read latency for accessing data. The high-water mark for physical reads is near 450 microseconds (0.45 ms) in WIN-VM1 and the low is 350 microseconds (0.35 ms) in WIN-VM5, with an average of 382 microseconds across all eight databases. The findings for physical reads demonstrate that the XtremIO X2 array consistently delivered low latencies for accessing database data.
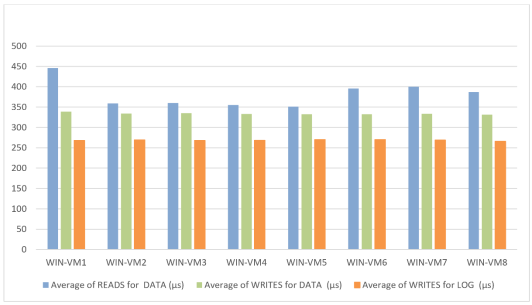
Figure 10. Windows average storage latency in microseconds (µs)
Write latency is critically important because it supports the durability aspect of Atomicity, Consistency, Isolation, Durability (ACID)-compliant databases. In terms of writes, our findings are separated into writes to the data LUNs and writes to the log LUNs. In Figure 10, the green bars indicate physical data write latency to the XtremIO X2 array. Physical writes ranged from a high of 339 microseconds for WIN-VM1 to a low of 331 microseconds for WIN-VM8, with an average 334 microseconds (0.33 ms) across all eight databases. The XtremIO X2 array showed highly consistent physical write performance with low latencies.
By default, beginning with SQL Server 2016, the database issues a checkpoint every minute. A checkpoint is a process in which all in-memory modified pages are saved to storage and the active portion of the transaction log is updated for persistence. Slow checkpoints can affect database performance because the database engine waits for acknowledgement that the checkpoint has been completed. Because of the importance of the checkpoints, our test data collection included capturing writes to the database log files. The orange bars in Figure 10 show average write times for the log files. Physical log writes ranged from a high of 270 microseconds to a low of 266 microseconds, with an average of 269 microseconds across all eight databases.
Finally, this overview excludes physical log read data because reads from the log files are minimal during normal SQL Server database operations. For example, our test data for physical log reads did not exceed an average of 15 microseconds. Thus, the log files contained no substantial read load.
Linux latency
The following figure shows the average storage latency for the Linux VMs. The blue bars indicate the average read latency for accessing data. The high-water mark for physical reads is near 463 microseconds (0.46 ms) in RHEL-VM2 and the low is 341 microseconds (0.35 ms) in RHEL-VM8, with an average of 377 microseconds across all eight databases. The findings for physical reads demonstrate that the XtremIO X2 array consistently delivered low latencies for accessing database data.
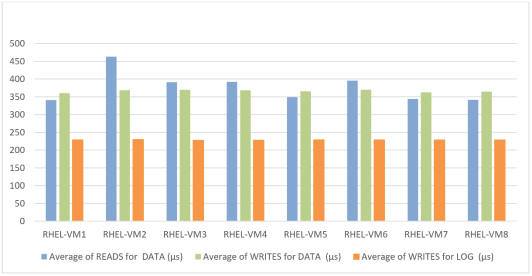
Figure 11. Linux average storage latency in microseconds (µs)
The green bars in Figure 11 indicate physical data write latency to the XtremIO X2 array. Physical writes ranged from a high of 370 microseconds for RHEL-VM6 to a low of 361 microseconds for RHEL-VM1, with an average 366 microseconds (0.36 ms) across all eight databases. The XtremIO X2 array showed highly consistent physical write performance with low latencies.
The orange bars in Figure 11 show average write times for the log files. Physical log writes ranged from a high of 230 microseconds to a low of 229 microseconds, with an average of 229 microseconds across all eight databases. Consistently low latency for physical writes to log files accelerate database checkpoints.