
Implementation guidance
Implementation guidance
-
Event and monitoring telemetry data is available across the components in the solution. It is recommended to leverage this data to understand the utilization of hardware resources and to drive changes to increase efficiencies.
Within Red Hat OpenShift, The NVIDIA GPU operator exposes GPU telemetry for Prometheus by using the NVIDIA DCGM Exporter. These metrics can be visualized using a monitoring dashboard in Grafana.
Red Hat OpenShift AI distributed workloads metrics can be easily viewed and monitored within the OpenShift AI web UI. The Ray cluster dashboard can be used to monitor the status and progress of training jobs within the environment and TensorBoard (TensorFlow dashboard) can show model experiment metrics such as loss and accuracy to help with evaluation.
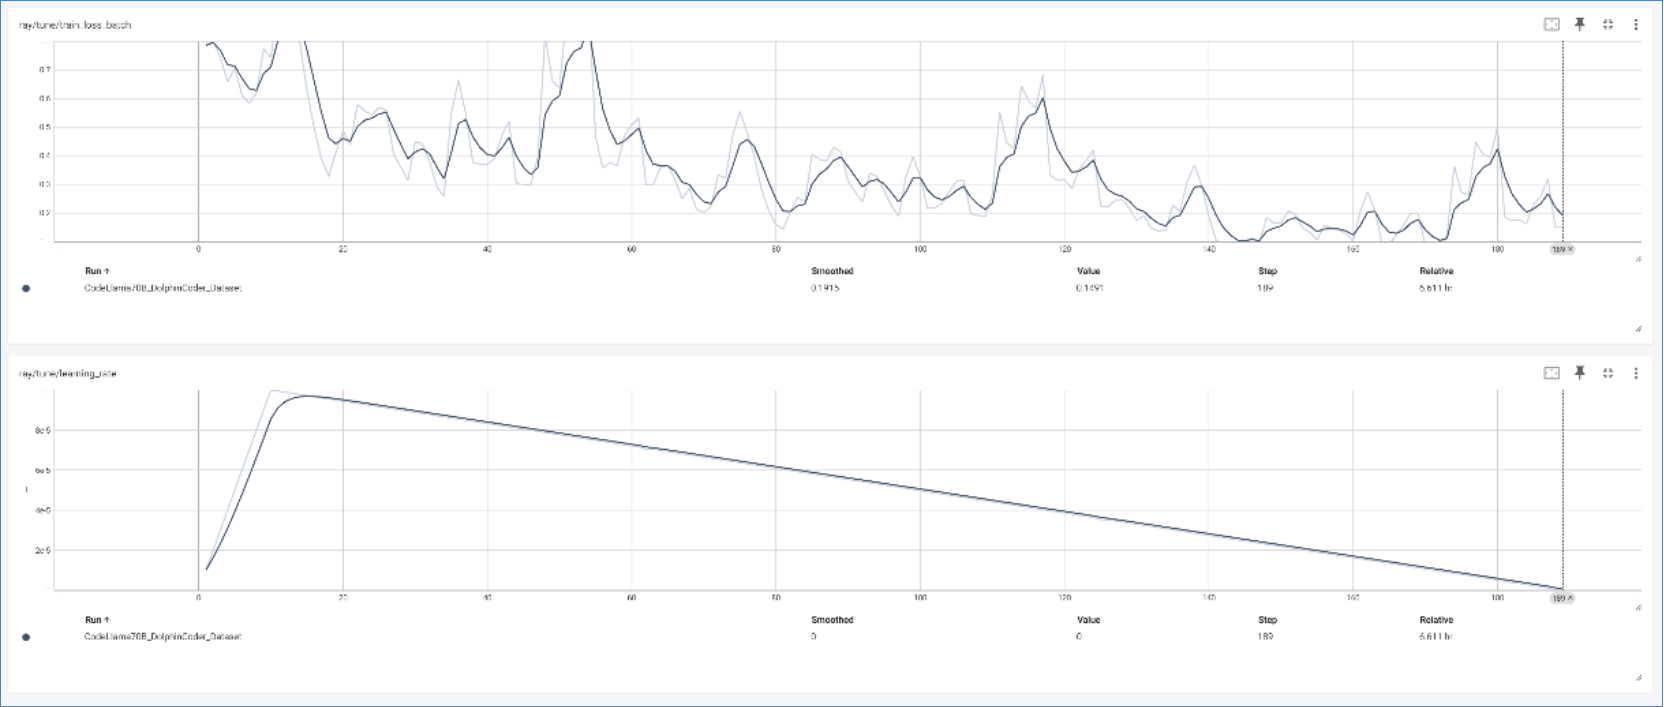
Figure 3. TensorBoard showing training loss and learning rate
When using large models and datasets, storage capacity and performance are other factors that should be monitored and considered in the environment. Efforts can be made to use model caching or local storage to decrease the time spent copying model files across network endpoints.