
Findings
Findings
-
Overview
The Dell VDI Solutions team used the Login Enterprise load-generation tool to conduct PAAC on this solution. Login Enterprise is an industry-standard tool for benchmarking VDI workloads. It uses a carefully designed, holistic methodology that monitors both hardware resource utilization parameters and EUE during load testing.
Login Enterprise Knowledge Worker
The Dell VDI Solutions team used Login Enterprise Knowledge Worker workload on a 3-node R760 vSAN Ready Node cluster to perform this test. The desktop VMs were created using VMware Horizon instant clone technology. The team also used VMware Horizon Blast Extreme display protocol and populated the compute hosts with 135 desktop VMs each.
CPU usage
The following graphs show the CPU utilization across the three hosts during the testing. CPU usage with all VMs powered on was approximately 3.65 percent before the test started.

Figure 4. CPU usage percentage
During the steady-state phase, an average CPU utilization of 84 percent was recorded. This value is close to the pass/fail threshold that was set for average CPU utilization (see Table 3. To maintain good EUE, do not exceed this threshold. You can load more user sessions while exceeding this threshold for CPU, but you might experience a degradation in user experience.
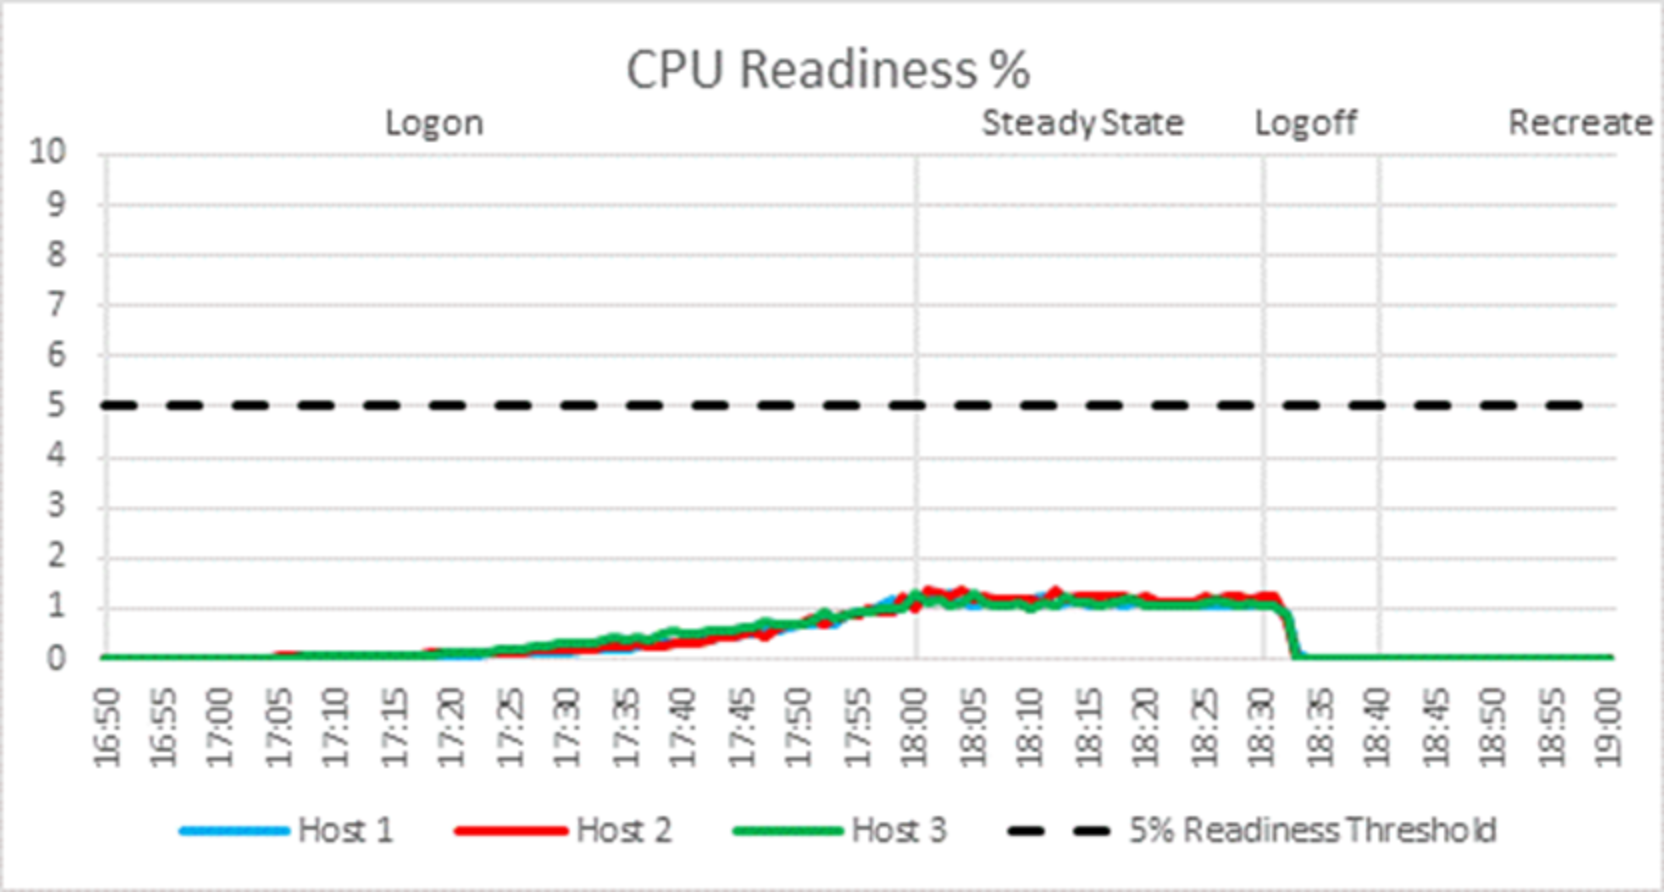
Figure 5. CPU readiness percentage
The average steady-state CPU core utilization across the three hosts was 60 percent, as shown in the following figure:
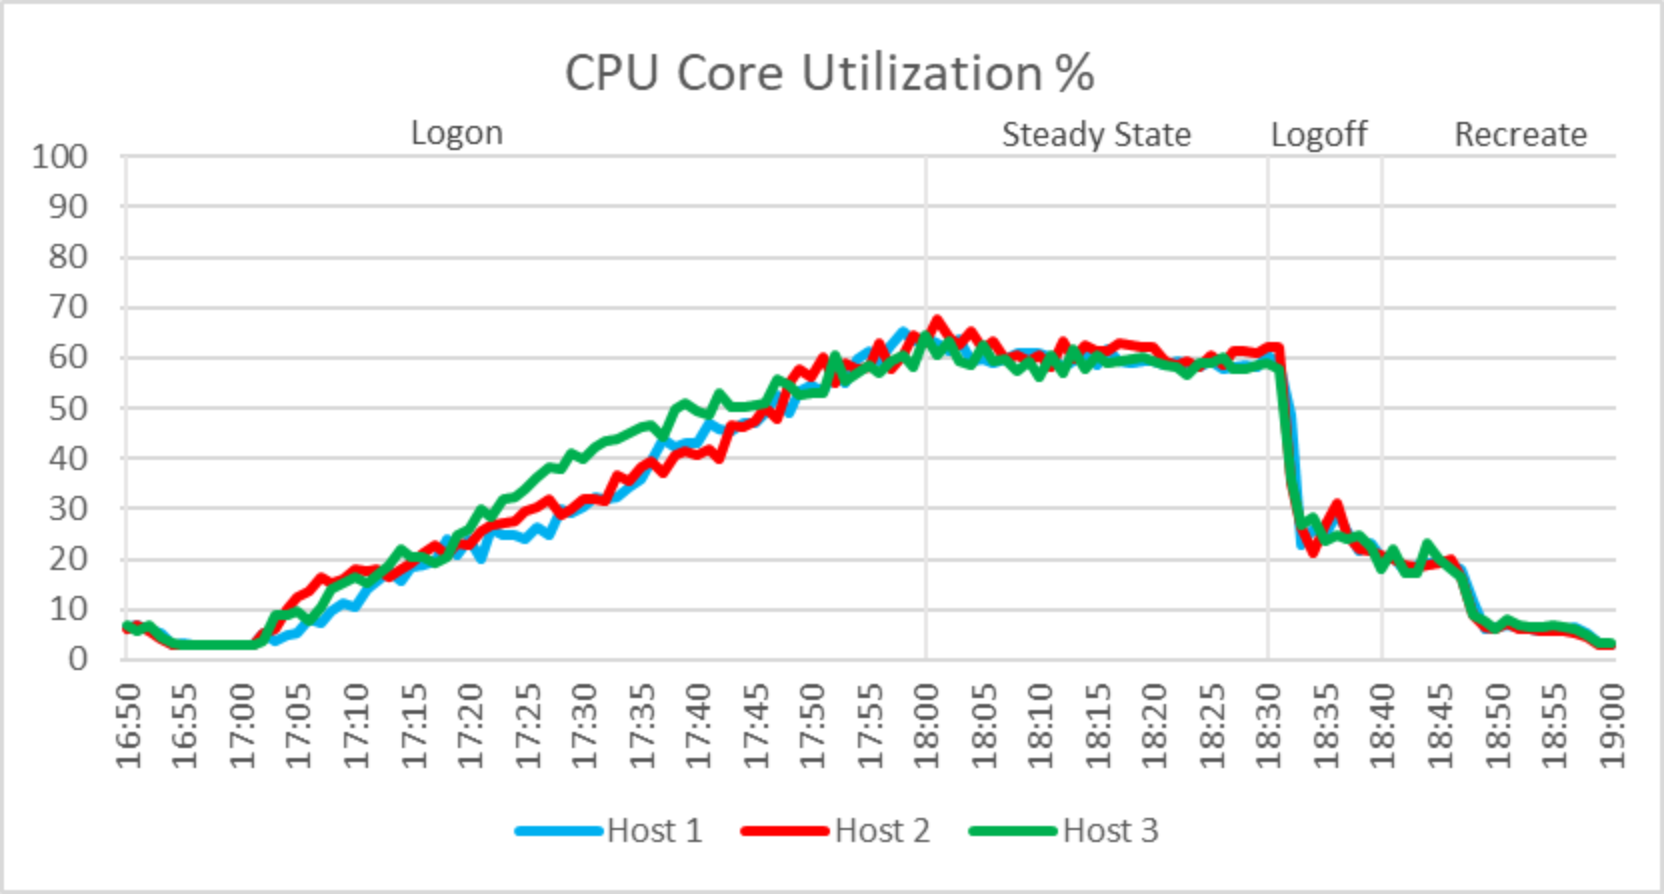
Figure 6. CPU core utilization percentage
Memory
The team observed no memory constraints during the testing on the compute hosts. Out of 768 GB of available memory per node, the compute host reached a maximum consumed memory of 734 GB and a steady-state average of 711 GB. Active memory usage reached a maximum active memory of 541 GB and recorded a steady-state average memory of 291 GB. There was no memory ballooning or swapping on the hosts.
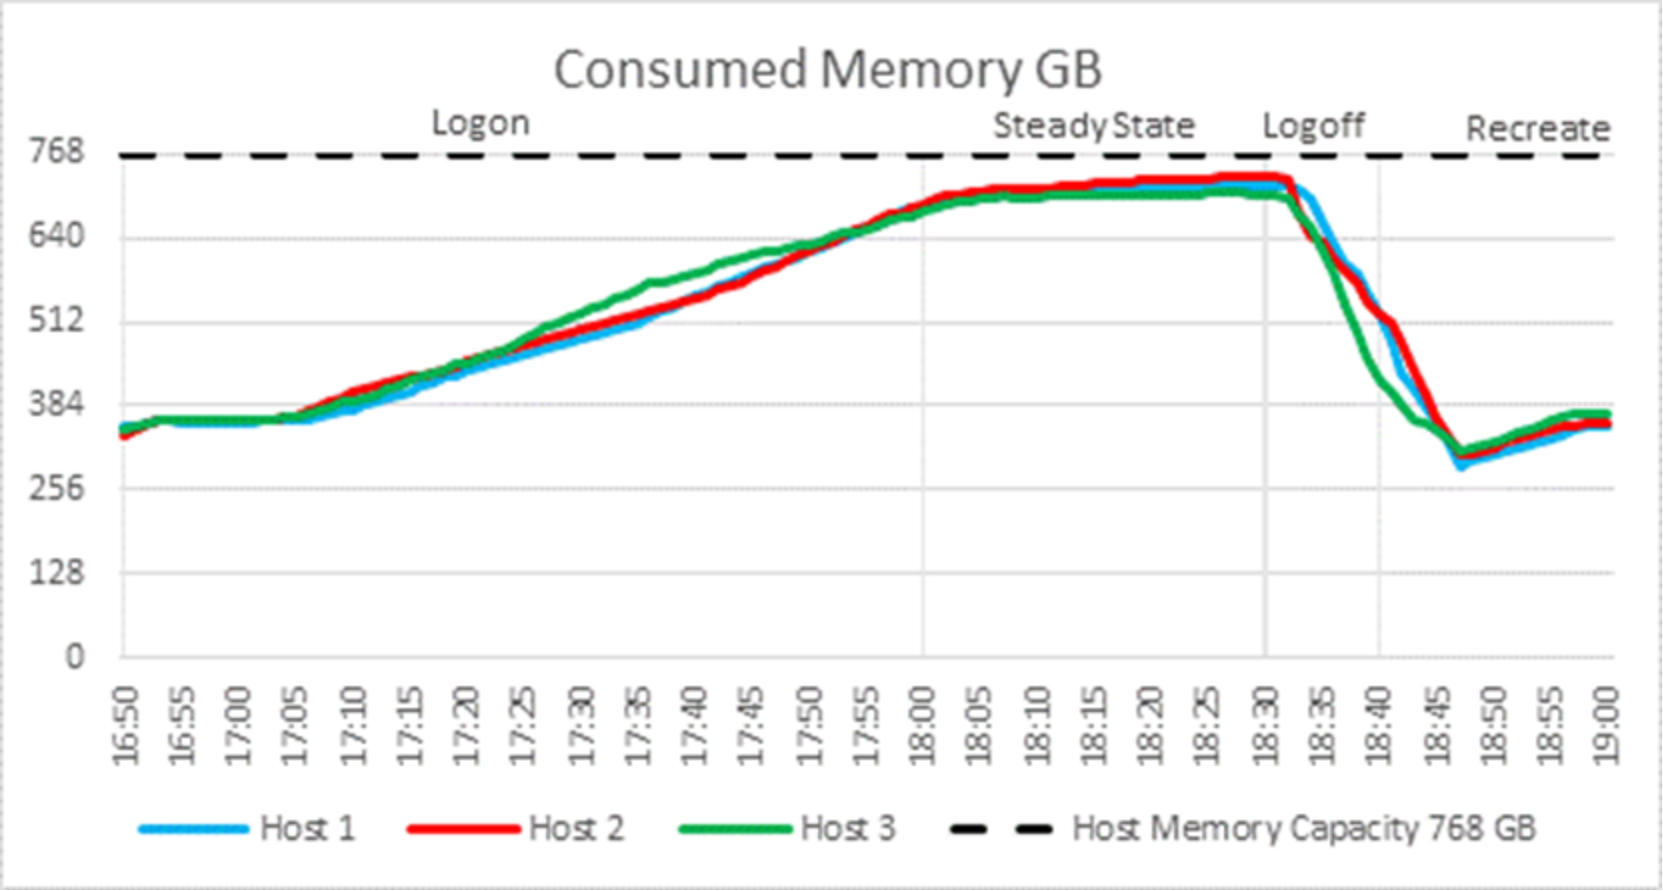
Figure 7. Consumed memory
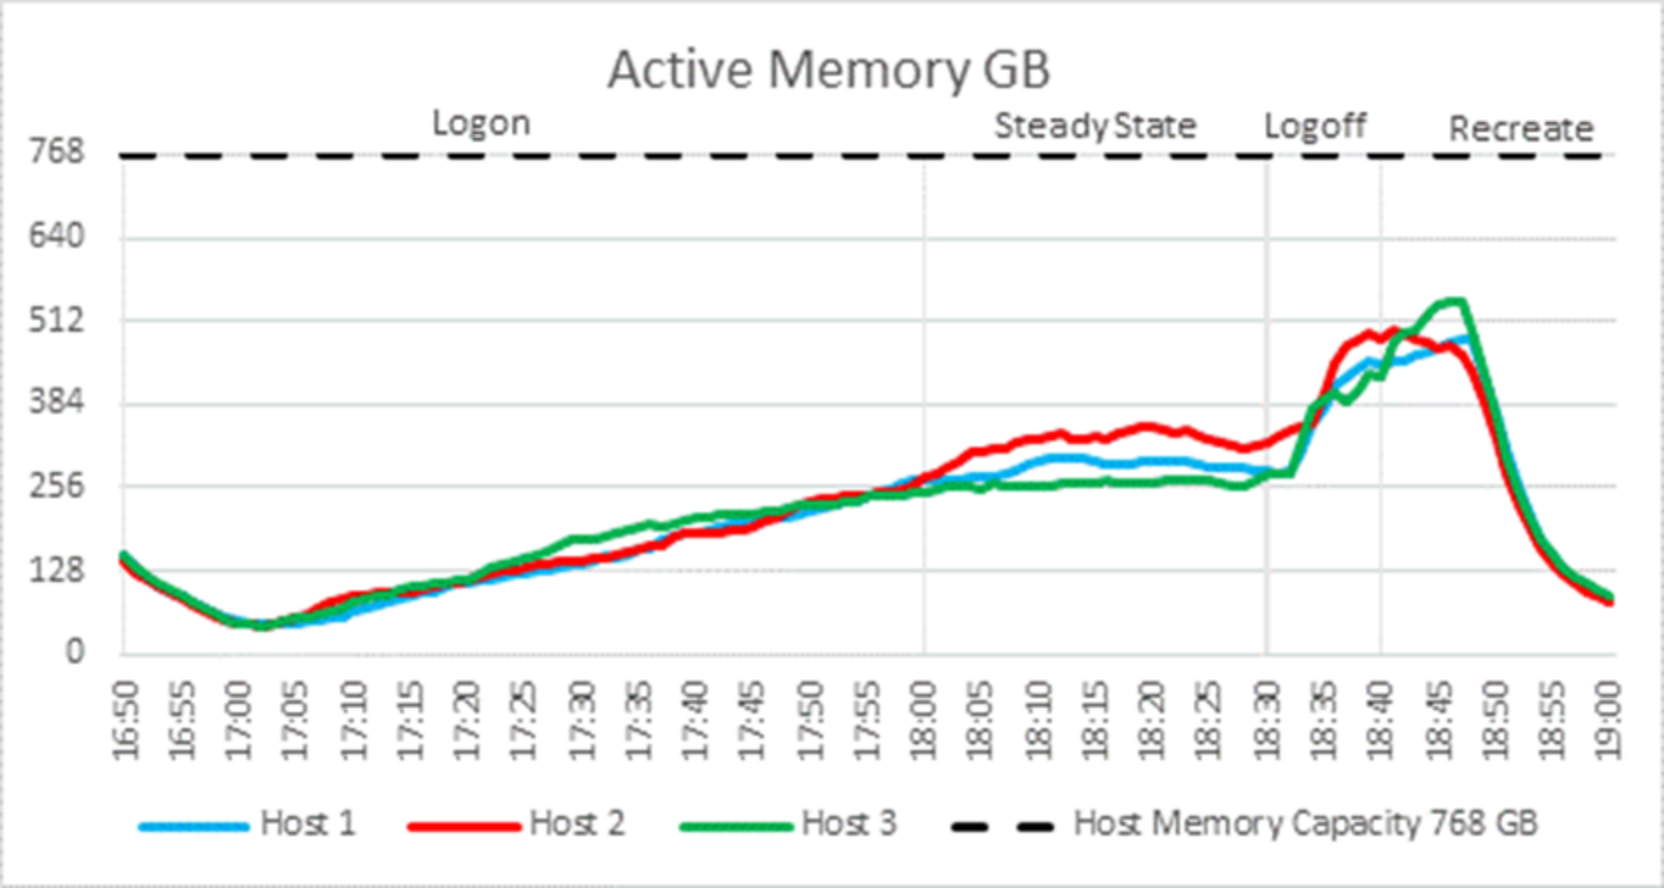
Figure 8. Active memory
Network usage
Network bandwidth was not an issue during the testing. The network usage recorded a steady state average of 686 Mbps. The busiest period for network traffic was during the re-create phase when a peak value of 2067 Mbps was recorded.
The following figure shows the network usage:
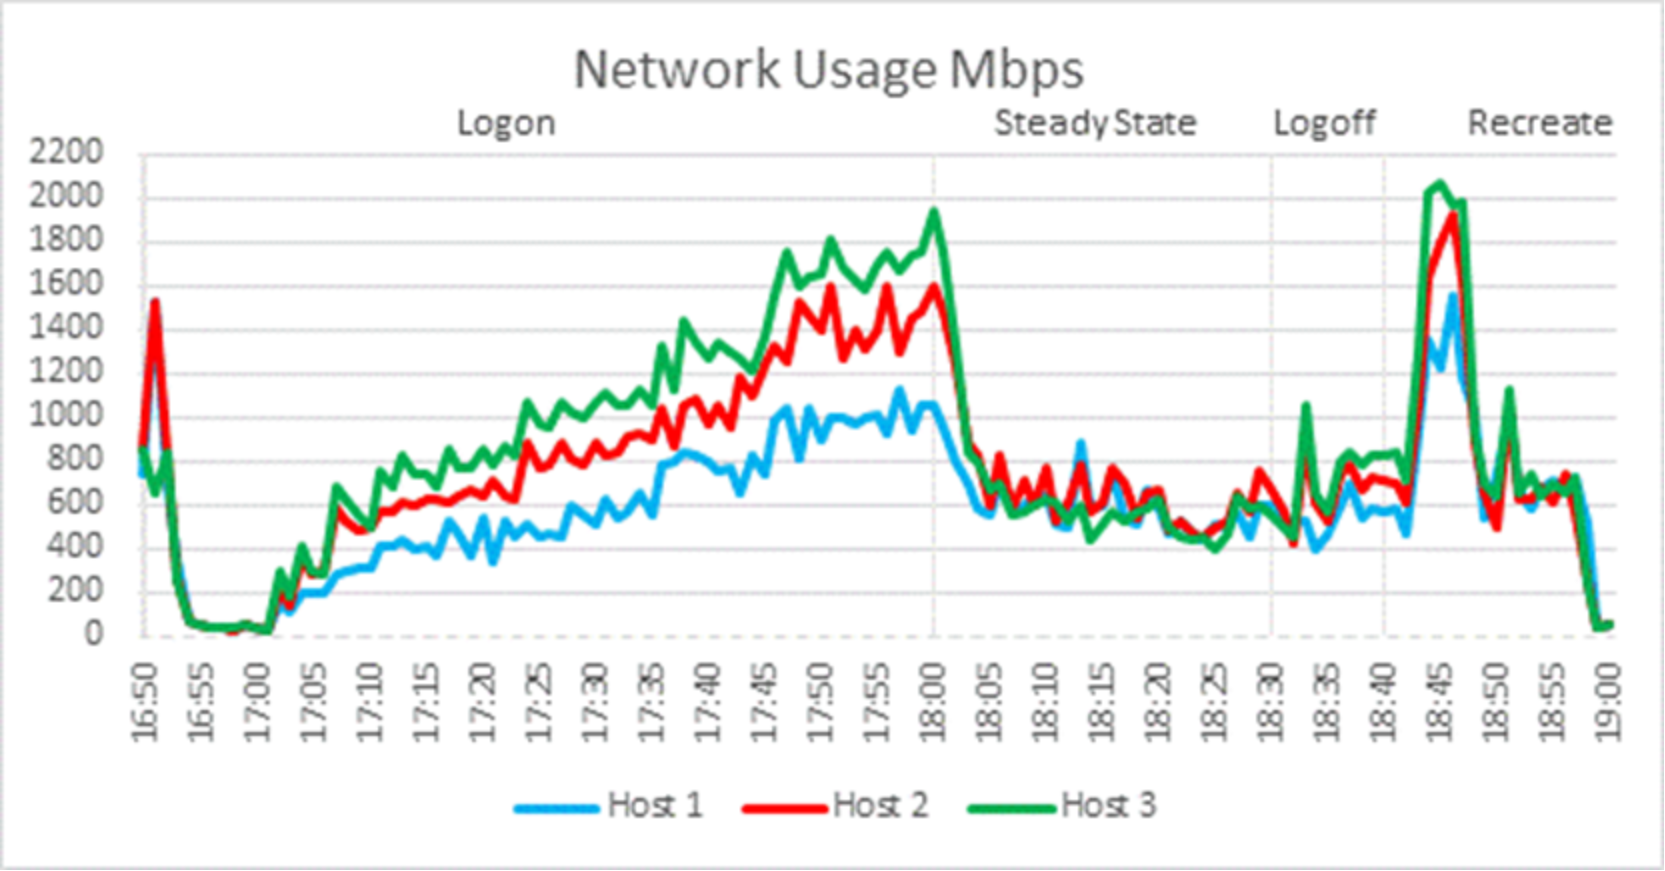
Figure 9. Network usage bandwidth
Cluster IOPs
Cluster IOPS reached a maximum value of 4745 for read IOPS and 2978 for write IOPS during the steady-state phase. The average steady-state IOPS metric was 1968.
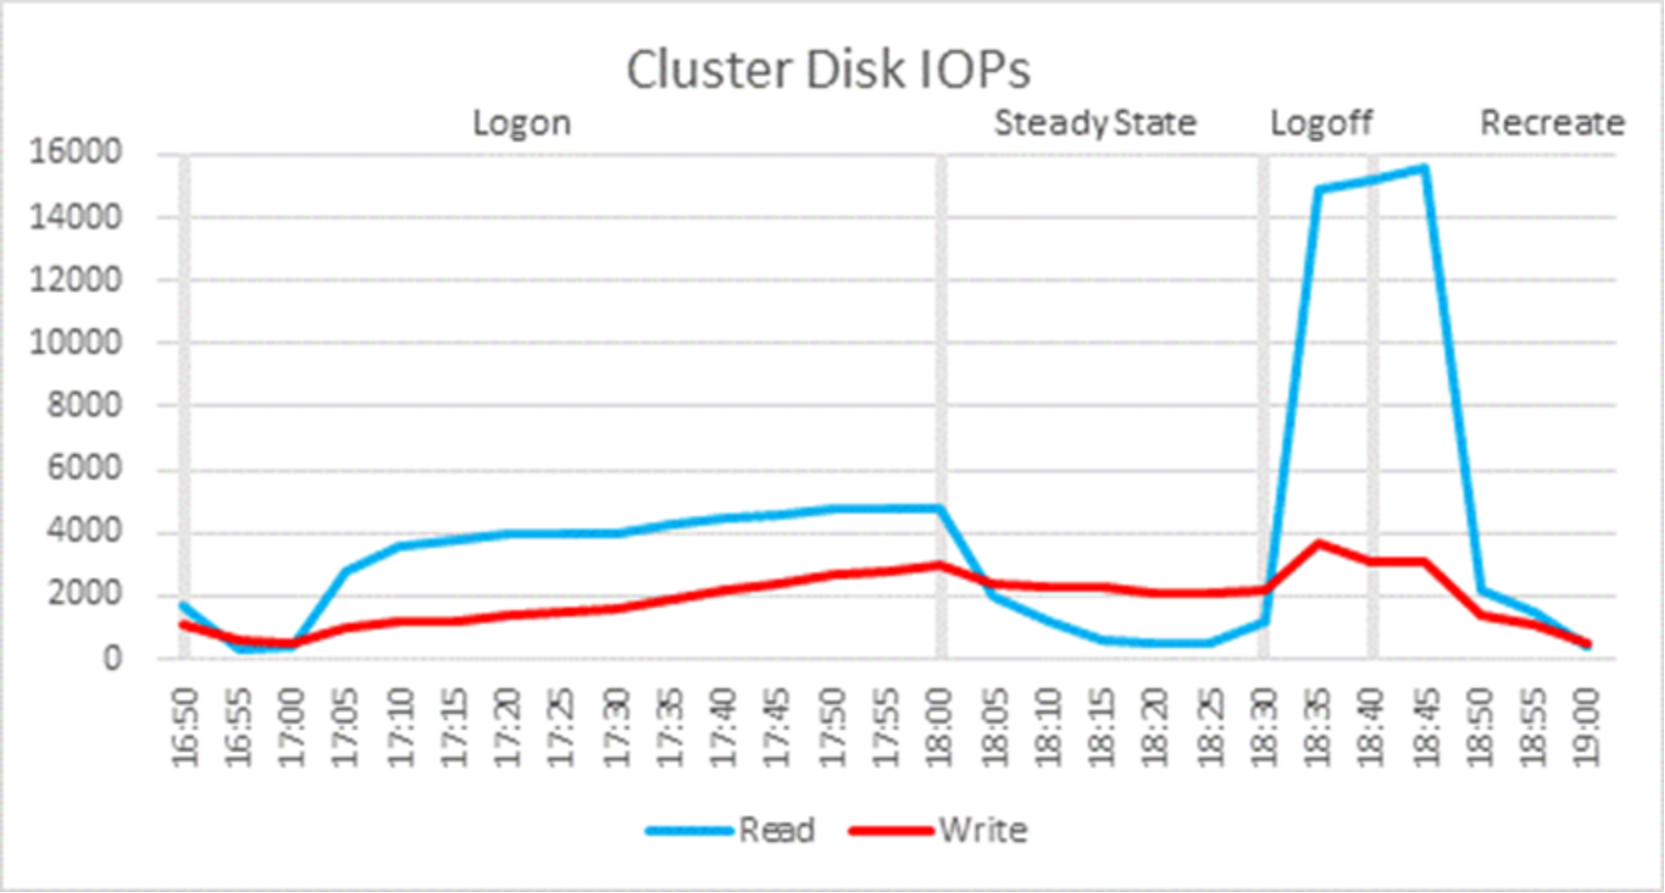
Figure 10. Cluster disk IOPs
Disk I/O latency
Cluster disk latency reached a maximum read latency of 0.356 milliseconds and a maximum write latency of 0.513 milliseconds during the steady-state phase. The average steady-state latency was 0.37 milliseconds.
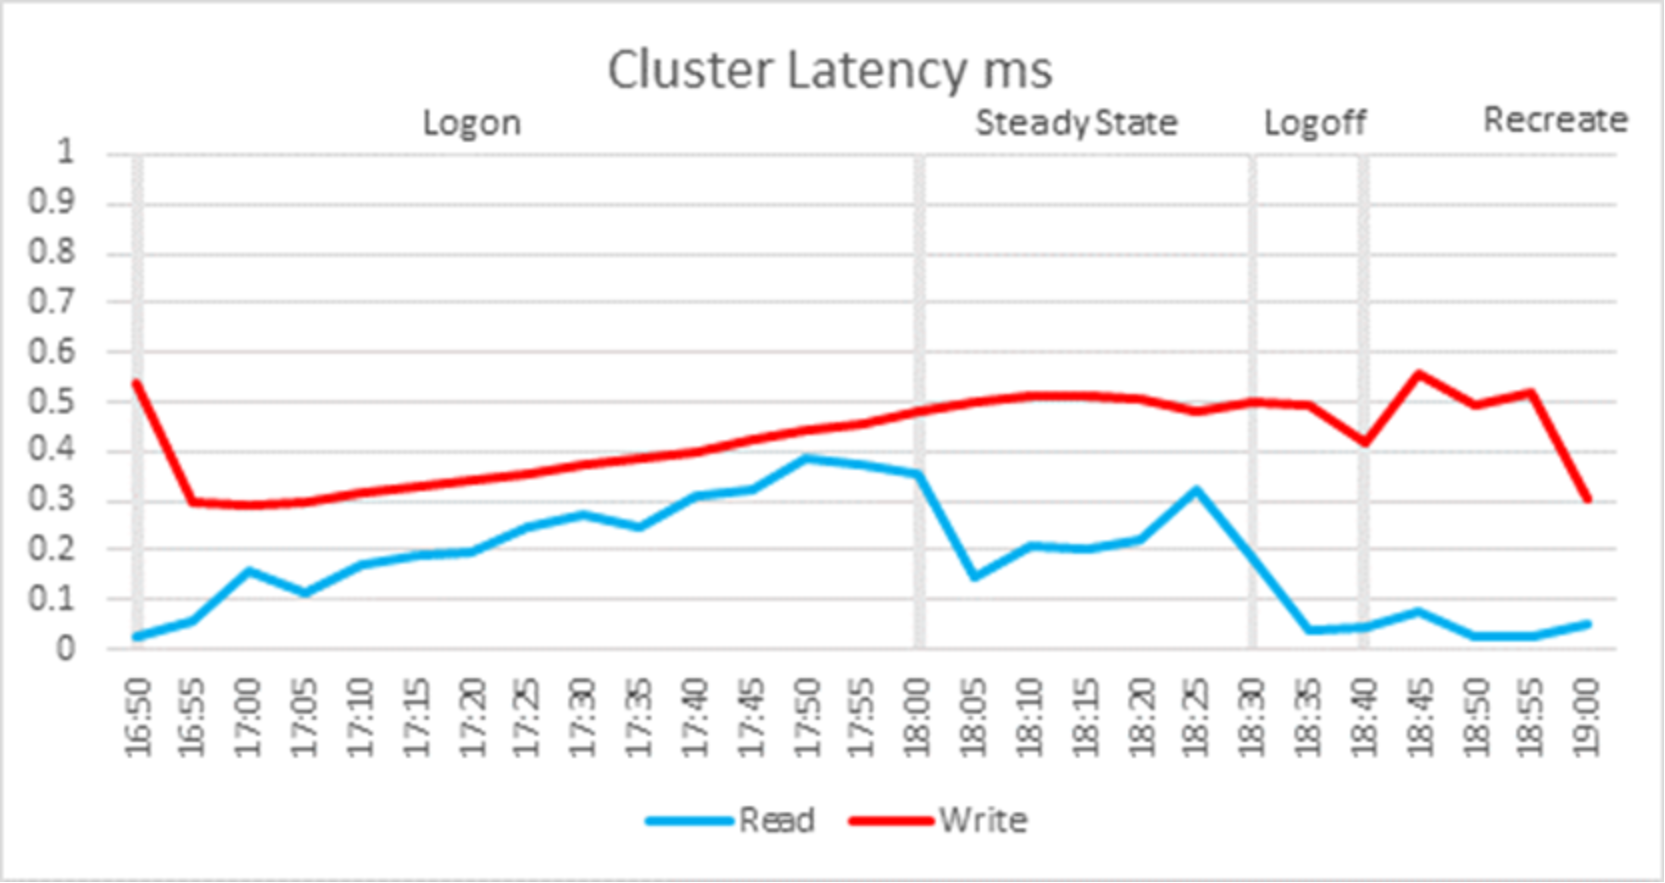
Figure 11. Cluster disk I/O latency
User experience
The Login Enterprise End User Experience (EUX) score was 8.2/10 and the VSImax was >401, which means that VSImax was not reached during this test and that it would be possible to run more sessions with this configuration. For more information about Login Enterprise EUX Scores, see this Login Enterprise EUX Score – Login VSI article.
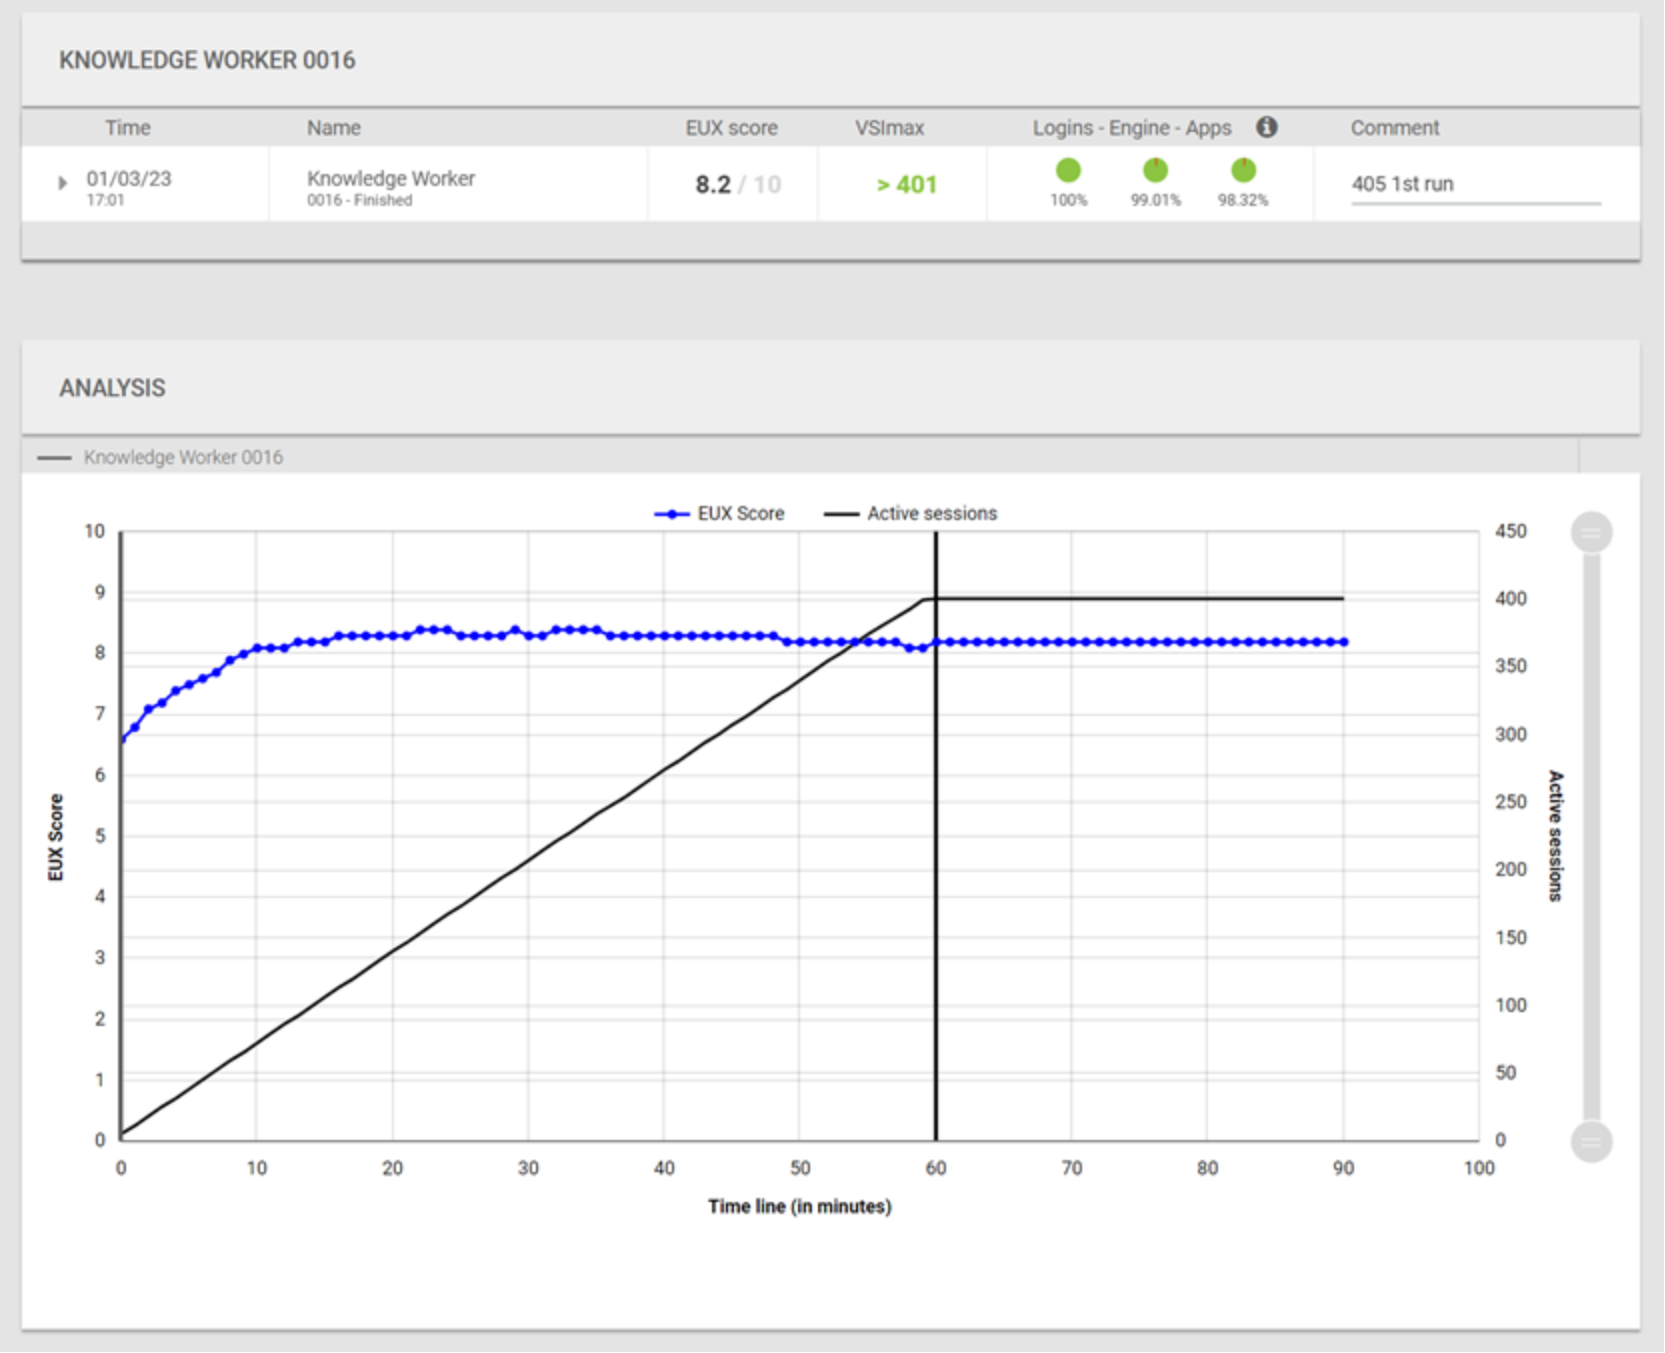
Figure 12. Login Enterprise EUX score