
Single-server performance
Single-server performance
-
The following figure shows the measured performance of selected Abaqus/Standard benchmarks on a single server with version 2022HF2. The performance for each benchmark is measured using the solver wallclock time reported at the end of the .msg file.

Figure 1. Abaqus/Standard processor relative performance
The results are plotted relative to the performance of a single server configured with AMD EPYC 7532 processors. Larger values indicate better overall performance. The benchmark models were run using 64 cores with four threads per rank. The results using eight or 16 threads per rank were mixed, with some benchmark cases performing better using more threads and some performing worse. For best simulation performance, test various thread counts for the specific model and HPC system in use.
The following figure shows the measured performance of various Abaqus/Explicit benchmarks on a single server using Abaqus version 2022HF2. The performance for each benchmark is measured using the solver wallclock time, obtained from the output at the end of the .sta file.
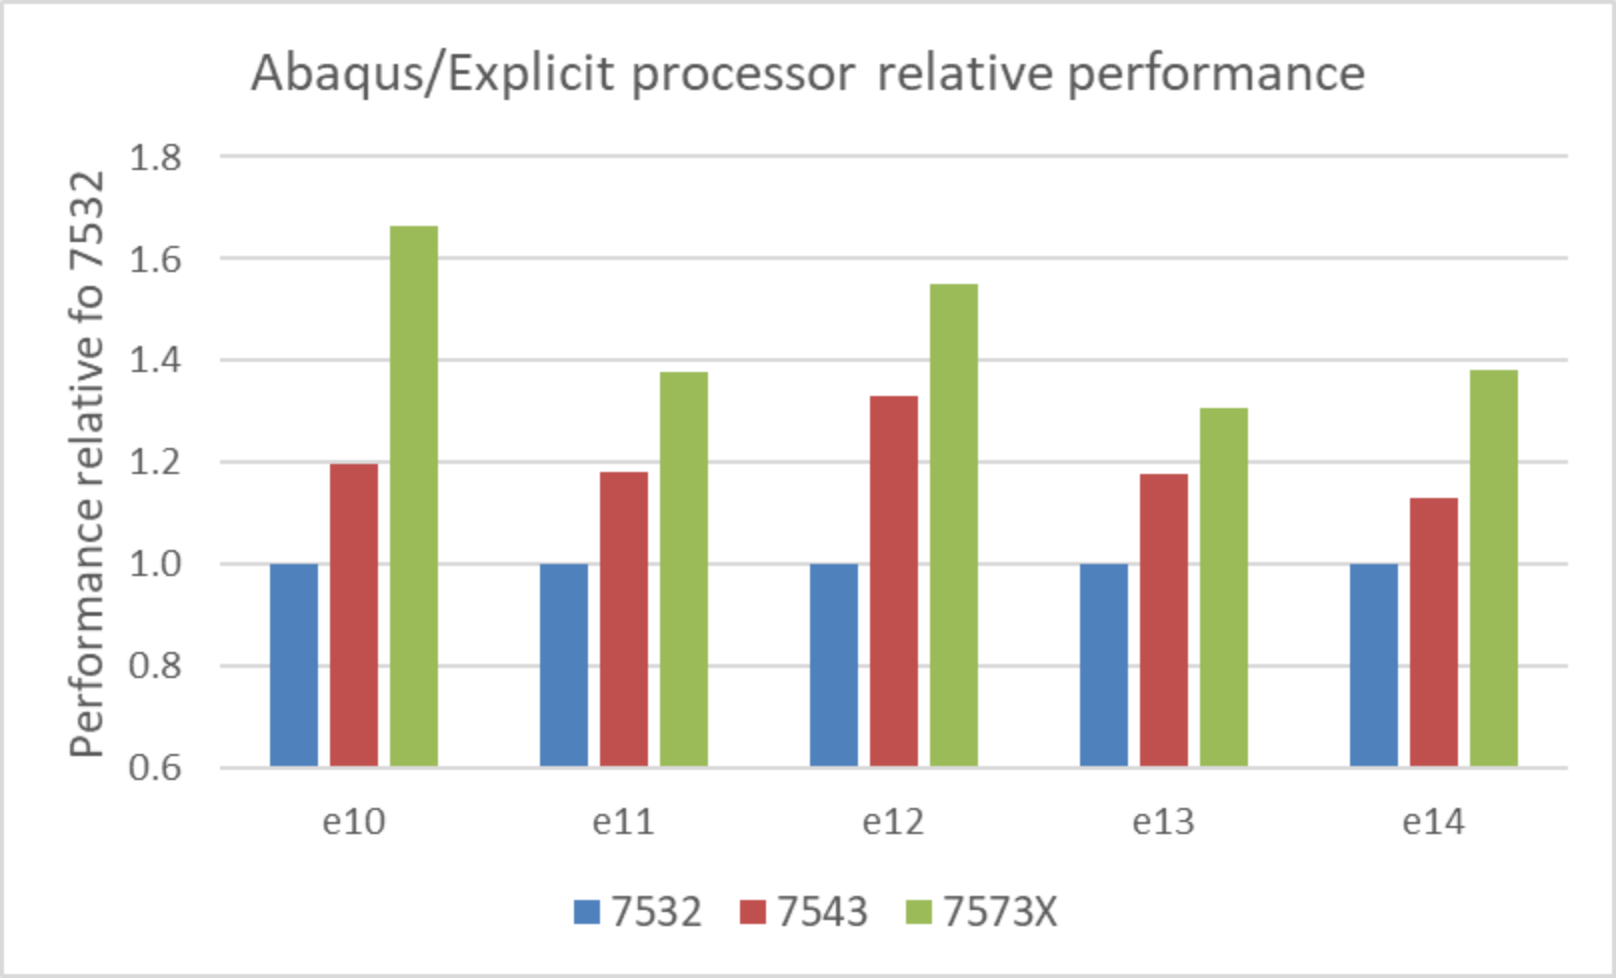
Figure 2. Abaqus/Explicit processor relative performance
The results are plotted relative to the performance of a single server configured with AMD EPYC 7532 processors to better indicate generational performance improvements. Larger values indicate better overall performance. These results are similar to the standard benchmarks shown in Figure 1, showing a substantial improvement in the performance with AMD EPYC 7003 series processors.