OLTP read-miss tests
OLTP read-miss tests
-
In the first set of tests, an OLTP read-miss workload is used. A read-miss workload means that PowerMax cache does not satisfy most of the read I/Os requested by the database, and instead need to be read from the storage media.
Such a workload is not typical with PowerMax because its cache algorithms are efficient and the nature of OLTP databases is that only recent data is highly active. As a result, the PowerMax cache tends to service a large portion of the read I/O requests. This test purpose is to demonstrate an unlikely scenario in which the active dataset has no locality or is so much larger than the PowerMax cache, that it cannot benefit from it.
To generate an OLTP workload, UPDATE_PCT is set to 25 percent in SLOB.conf. The SLOB scale is set to 20 GB and 64 users are created for a total database capacity of 1,280 GB (20 GB x 64 user schemas). SCAN_TABLE_SZ is set to 1 MB as it does not take part in the OLTP tests. Oracle database buffer cache is limited to 500 MB to force significant I/O activity. The test is first run with one Oracle RAC node and one SLOB thread per user. Then, two RAC nodes and two SLOB threads per user. Finally, three RAC nodes and three SLOB threads per user. To allow for read-miss workload, SLOB hot-spot feature that creates data locality is not used. As a result, Unisphere shows about 10 percent read-hit ratio for the datafiles storage group (SG).
Each test case is run for 30 minutes and is monitored for steady state behavior. The test performance results are collected from an Oracle AWR produced for each test run, where the database IOPS are taken from the AWR section IOStat by File Type under I/Os/s. The datafile-read latency is taken from the AWR section Top Timed Events, under db file sequential read Avg Wait. This number is the read latency for Oracle datafile data requests from the storage, provided in microseconds (usec) units. The redo log write latency is taken from the AWR section Foreground Wait Events (Global), under log file sync. Log file sync metric is not an accurate measurement for redo log I/O write latency, as it includes CPU overhead. However, it provides an indication that can be compared with the storage metrics collected from Unisphere for REDO write latency.
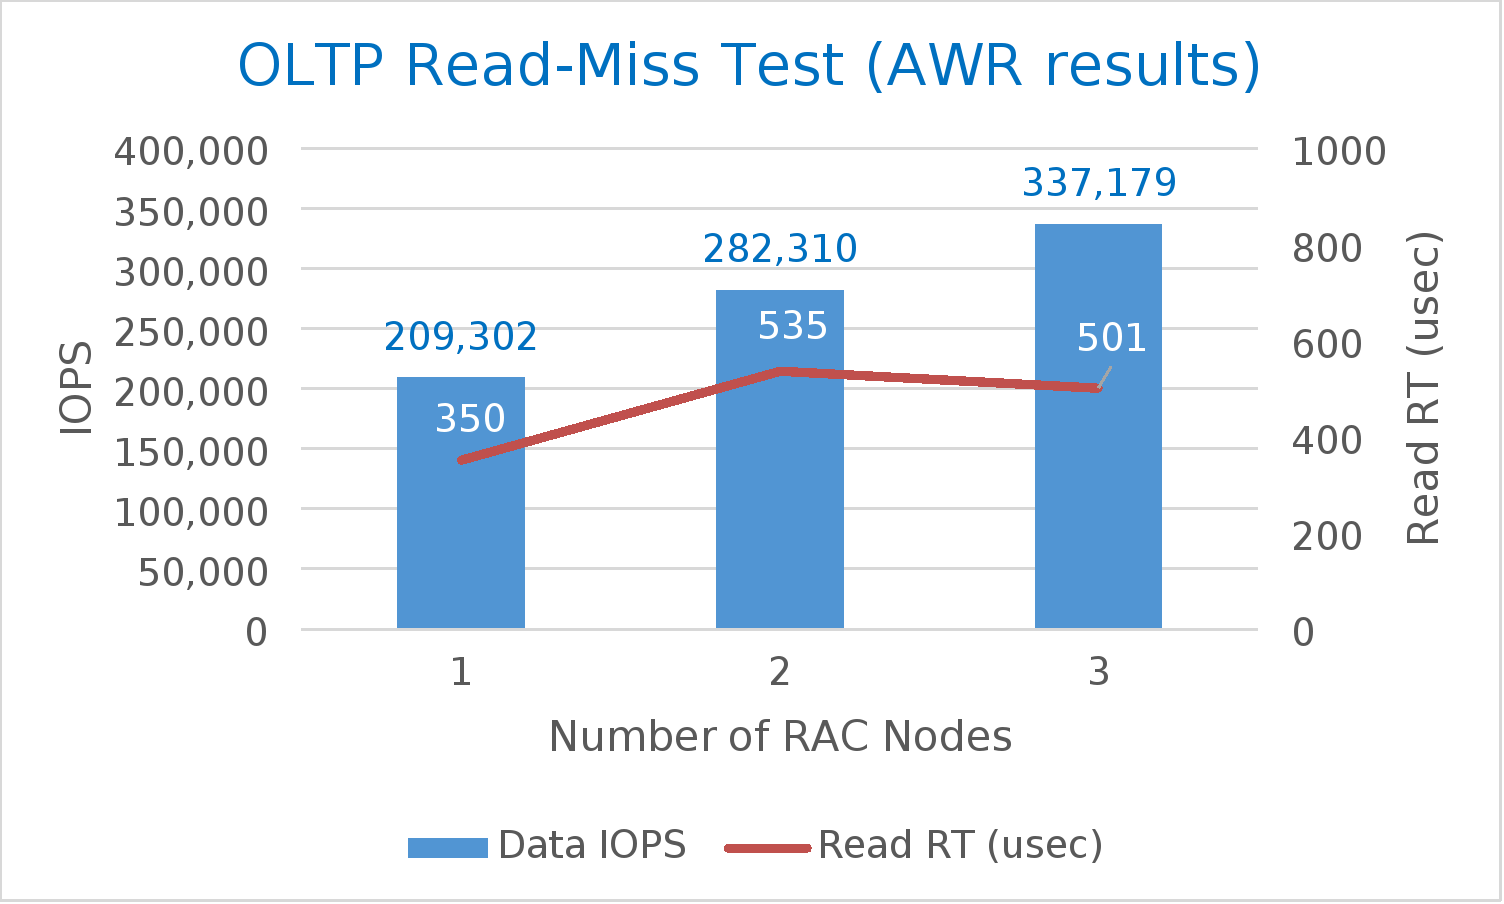
A summary of the test results is shown in Table 6. As the number of cluster nodes increased from one to three, and the workload increased accordingly (higher number of SLOB threads per user), the storage performance increased from ~210K IOPS to 340K. At the same time, datafile-read latency remained well under 1 millisecond. Also, both AWR and Unisphere storage group (SG) performance numbers are relatively close to each other. If there is a high discrepancy, it could point to a bottleneck at the host or SAN.
Table 6. Summary of OLTP read-miss results
SLOB configuration
AWR
Unisphere
Number of nodes
Number of users
Number of threads
Datafile IOPS
Datafile read latency (usec)
Log file sync (usec)
Data SG IOPS
Data SG read/write latency (usec)
Redo SG write latency (usec)
1
64
1
209,302
350
460
213,780
319/183
305
2
64
2
282,310
535
648
285,682
529/407
429
3
64
3
337,179
501
676
341,118
686/494
537
Figure 7 shows the AWR data in a chart to emphasize how despite the increased workload the I/O latency remains low, demonstrating a combination of high IOPS at low latencies.
These tests show that even when the PowerMax cache is not benefiting the workload, the database performance remains high and I/O response time remains low.