OLTP read-hit tests
OLTP read-hit tests
-
In the next set of tests, an OLTP moderate read-hit workload is used. A moderate read-hit workload means that a significant number of read I/Os requested by the database are satisfied by the PowerMax cache. As a result, read I/O response time is lower (as the data does not need to be fetched from the storage media) and IOPS are higher.
A moderate read-hit workload is typical to PowerMax because its cache algorithms are efficient. In addition, the nature of OLTP databases is that only recent data is highly active. As a result, the PowerMax cache tends to service a large portion of the read I/O requests. While each customer workload is different, a read-hit ratio of 60 percent for the datafiles SG was used in these tests.
To generate an OLTP workload, UPDATE_PCT is set to 25 percent in SLOB.conf. The SLOB scale is set to 20 GB and 64 users are created, for a total database capacity of 1,280 GB (20 GB x 64 user schemas). SCAN_TABLE_SZ is set to 1 MB as it does not take part in the OLTP tests. Oracle database buffer cache is limited to 500 MB to force significant I/O activity. The test is first run with one Oracle RAC node and using one SLOB thread per user. Then, two RAC nodes and two threads per user. Finally, three RAC nodes and three threads per user. To allow for read-hit workload, the SLOB hot-spot feature that creates data locality is used and set to a size that creates the appropriate read-hit ratio consistently during the test. As a result, Unisphere shows 60 percent read-hit ratio for the datafiles storage group (SG).
Each test case is run for 30 minutes and is monitored for steady state behavior. The test performance results are collected from Oracle AWR and produced similarly to the previous test case.
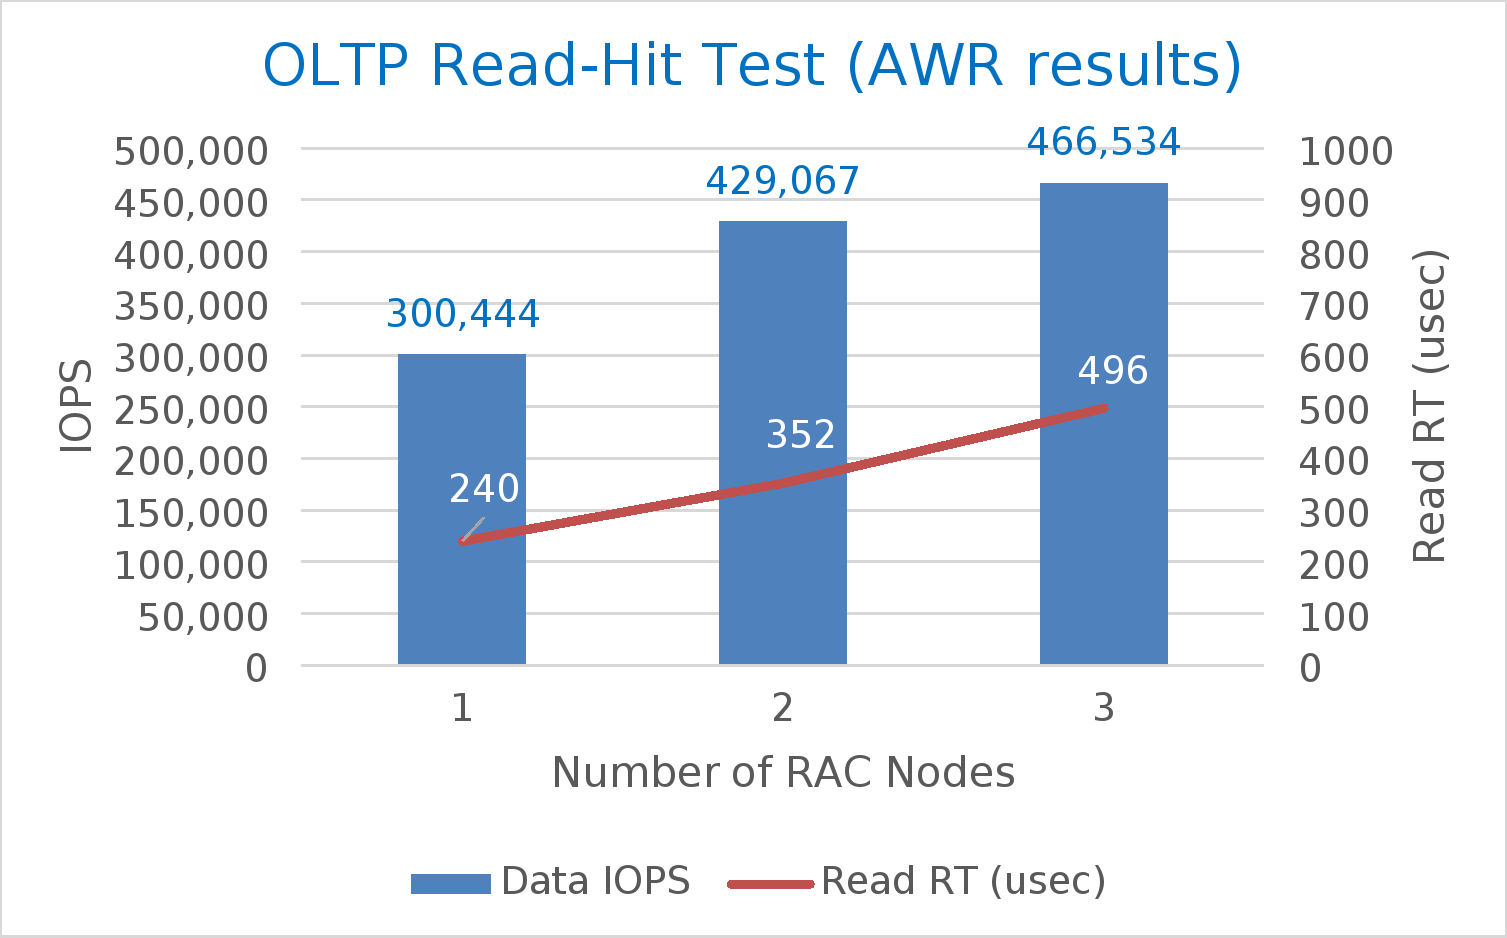
A summary of the test results is shown in Table 7. As the number of cluster nodes increased from one to three, and the workload increased accordingly (higher number of SLOB threads per user), the storage performance increased from 300 K IOPS to around 470 K. At the same time, datafile read latency remained well under one millisecond. The table also shows that both AWR data and log files, and Unisphere storage group (SG) performance numbers, are relatively close to each other. A high discrepancy could point to a bottleneck at the host or SAN.
Table 7. Summary of OLTP read-hit results
SLOB configuration
AWR
Unisphere
Number of nodes
Number of users
Number of threads
Datafile IOPS
Datafile read latency (usec)
Log file sync (usec)
Data SG IOPS
Data SG read/write latency (usec)
Redo SG write latency (usec)
1
64
1
300,444
240
432
301,800
206/192
260
2
64
2
429,067
352
943
431,514
343/403
478
3
64
3
466,534
496
819
467,140
506/590
658
Figure 8 shows the AWR data in a chart to emphasize how despite the increased workload, the I/O latency remains low, demonstrating a combination of high IOPS at low latencies.
These tests show that even in a small test environment, with a single node pair PowerMax 8500, near half a million IOPS can be reached while keeping a low database I/O response time.