
DSS tests
DSS tests
-
In the next set of tests, a DSS (decision support) workload is used. A DSS workload means that the database exercise large sequential reads as it scans the data row by row. This workload is typical for business analytics reports and data warehousing.
When Oracle performs sequential reads, the PGA section of the database cache is used instead of SGA; unlike SGA, PGA memory is not shared between sessions or queries. As a result, each query requires the data to be read from storage in large read I/O operations. The size of each I/O is controlled by the init.ora parameter, db_file_multiblock_read_count, which signifies how many database blocks each I/O operation can request. As a best practice, this parameter is set to 16, so the I/O size is limited to 128 KB (16 blocks x 8 KB Oracle block size). Although the maximum and default value is 128, or 1 MB I/O size, 128 KB matches PowerMax cache and storage track size. This provides the efficiency of large I/O while keeping latencies low. In general, the larger the I/O, the longer it takes to service it; therefore, a 1 MB I/O can have latency eight times higher than 128 KB I/O.
To generate a DSS workload, UPDATE_PCT is set to 0 percent in SLOB.conf. The SLOB scale is set to 30 GB and SCAN_TABLE_SZ is set to 29 GB to consume most of the space of each user schema. Sixty-four users are created, for a total database capacity of 1,920 GB (30 GB x 64 user schemas). Oracle PGA is set to 50 GB to allow the sequential data enough space when each query is run. In addition, the database is set with 200 parallel servers to service the queries. The test is first run with one Oracle RAC node, then two, and finally three RAC nodes.
Each test case is run for 30 minutes and is monitored for steady state behavior. The test performance results are collected from Oracle AWR produced for each test run, where the database throughput is taken from the AWR section IOStat by File Type under I/O MB/s. The datafile read latency is taken from the AWR section Top Timed Events, under direct path read and Avg Wait. This number is the read latency for Oracle datafile data requests from the storage, provided in microseconds (usec) units.
A summary of the test results is shown in Table 8. As the number of cluster nodes increases from one to three, and the workload increases accordingly (higher number of SLOB threads per user), the storage performance increases from approximately 12 GB per second to 30 GB per second. At the same time, datafile read latency remains well under 1 millisecond.
Table 8. Summary of OLTP read-hit results
SLOB configuration
AWR
Unisphere
Number of nodes
Number of users
Number of threads
Datafile IOPS
Datafile read latency (usec)
Log file sync (usec)
Data SG IOPS
Data SG read/write latency (usec)
Redo SG write latency (usec)
1
64
1
300,444
240
432
301,800
206/192
260
2
64
2
429,067
352
943
431,514
343/403
478
3
64
3
466,534
496
819
467,140
506/590
658
Figure 9 shows the AWR data in a chart to demonstrate how despite the increased workload, the I/O latency remains low, demonstrating a combination of high throughput at low latencies.
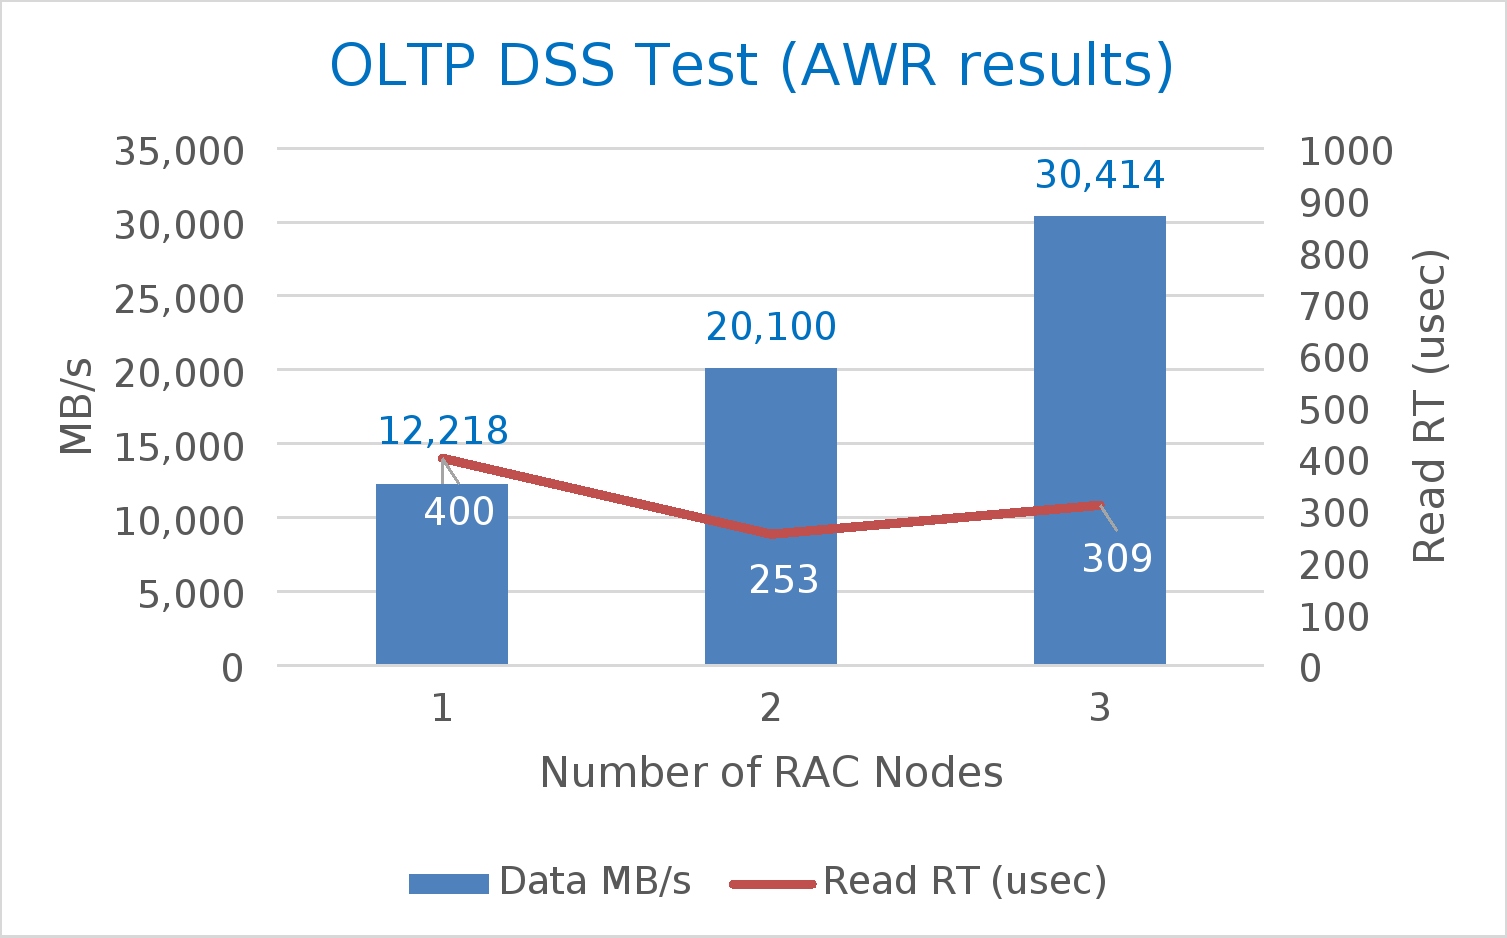
Figure 9. OLTP DSS test results (based on AWR)
These tests show that PowerMax can support high database throughput while maintaining low I/O latencies. In order to achieve these results, there should be enough cluster nodes and connectivity to support such high performance.