
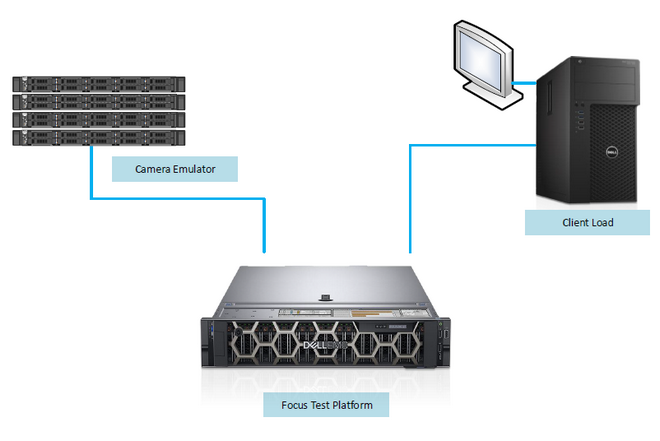
The test environment comprises two separate networks, one to emulate camera feeds, and the other to emulate client loading. Both emulation environments can be calibrated to induce precise scaling to the focus test platform. They are controlled by Milestone test automation tools, which can increase the loading while monitoring the key resources of the test platform. In this case, the video streams are calibrated to provide a 4.4 Mbit/s throughput that comprises a H.264, 1080p, feed at 30 FPS.
To represent a realistic use case both writing (recording) and reading (playback) are performed on the disk with the aim of having 10 percent playback of the write throughput. Milestone Server-side video motion detection is enabled for all cameras.
When the optimum level is reached, the Dell LiveOptics tool gathers the system performance information over a 24 hour period. LiveOptics is a vendor, hardware, and platform agnostic standard for IT professionals to record and communicate their achieved benchmarks, workloads, or support concerns to others to accelerate decision time and reduce risk. Furthermore, Milestone Performance and Microsoft Performance (perfmon) Resource Monitor tools monitor performance and frame loss.
We used the NVIDIA_SMI.exe and Microsoft PerfMon to monitor the GPU performance.
Drive configurations
We Installed the operating system and application to the BOSS adapter, using RAID 1, and M.2 SSDs for performance. As a dedicated VMS server, the IOPS to the operating system drive is high, which is why Dell EMC recommends fast disks for the OS/application drive.
- RAID
- We implemented a RAID 6 on the database drive, to maximize the available space, while providing two points of failure on the RAID configuration.
- Virtual disk/volume
- The PERC H740P virtual disk was configured with a stripe size of 1 MB. Formatting of the volume was with a 64K allocation unit.
- SSC
- Using SSD disks as a stepping stone, running the Live Database on it, and archiving to the higher density disks provides the increased performance required during the archive process.
- Live Database size
- Estimate the Live Database size to be ~ 50 percent of the total size of the SSD available space.
- Writes per day
- Be aware of the number of writes per day. SSD disks have a performance metric of Drive Writes Per Day (DWPD). In the previous example, there is an available space of 4 TB, and an average of 11.28 TB daily writes, therefore mixed use 4DWPD disks are ideally suited to this application.
Test criteria
The following criteria were used in testing:
- Video images—1080p, 30 FPS, H.264 codec, 4.4 Mbit/s
- Video motion detect—On for all streams
- Read playback—Playback from recorded images at 20 percent of the write throughput
- System database—Disk space running at 80 percent full disk capacity, ensuring first in first out rotation
- The criteria for stopping the testing were:
- Sustained media lost on input feeds
- Sustained CPU performance is more than 70 percent
- Sustained GPU utilization is more than 90 percent
Data points gathered
Data points were gathered for Microsoft Resource Monitor, application diagnostics, and GPU.
- Microsoft Resource Monitor
-
- 24 hour LiveOptics analysis, at maximum performance
- CPU percentage utilization
- Memory usage
- Network throughput on both the camera load interface and the client interface
- Disk throughput
- IOPS
- Read/write ratio
- Application diagnostics measuring
-
- Performance monitor, media lost in pipeline, across all cameras
- System performance
- Storage capacity usage
- GPU data points
-
- Live monitoring, using the following command
- nvidia-smi dmon -i 0 -s u - Perfmon—NVIDIA utilization
- Live monitoring, using the following command