We followed best practices for normal situations that might arise in a standard production environment.
The server was loaded to represent a real world operating platform, running from a full database, using 80 percent of the total disk space. Motion detect was enabled across all streams, while also running a 20 percent client playback.
After calibration, we introduced multiple hard failures to the environment to monitor the impact on the performance of the application through the failure, and the recovery times to active recording and operation.
The camera emulator used is proprietary to Milestone, generating controlled feeds from a remote location to target platform. It ensures consistent, repeatable bandwidth in a controlled test environment.
| R740xd - SATA | R740xd SAS | R740xd | ||||
| Single CPU | Dual CPU | Dual CPU | Single GPU | Dual GPU | ||
| Camera emulator feed | StableFPS 1920x1080_Shopping_Mall_4Mbit_30FPS | |||||
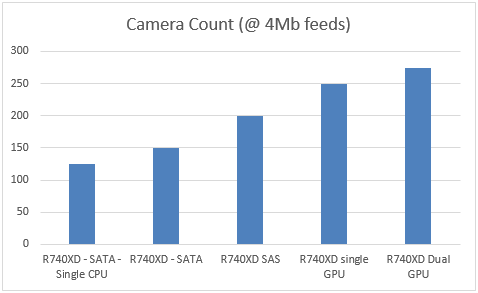
| Quantity | 125 | 150 | 200 | 250 | 275 | |
| Motion detection | Enabled | Enabled | Enabled | Enabled | Enabled | |
| Live DB size | 48 TB | 48 TB | 117 TB | 2 TB | 2 TB | |
| Archive DB size | NA | NA | NA | 40 TB | 40 TB | |
| Database full (80% of total disc size) | Yes | Yes | Yes | Yes | Yes | |
| Observation period | 24 hours | 24 hours | 12 hours | 12 hours | 12 hours | |
| Database | Live only | Live only | Live only | Live and Archive | Live and Archive | |
| Platform | ||||||
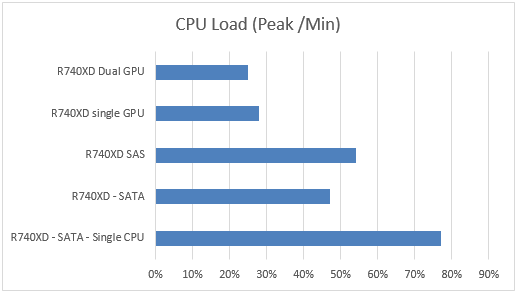
| CPU load (Peak/Min) | 77% | 47% | 54% | 28% | 25% / 28% | |
| Memory load sustained | 9.98 GB | 13.3 GB | 15.1 GB | 20 GB | 21 GB | |
| Peak memory | 12 GB | 20.43 GB | 19.21 GB | 29.77 GB | 21.41 GB | |
| GPU Decoder load (ave) | NA | NA | NA | 90% + | 70% + & 70% + | |
| GPU Decoder memory load | NA | NA | NA | ~10% | ~10% | |
| Performance | ||||||
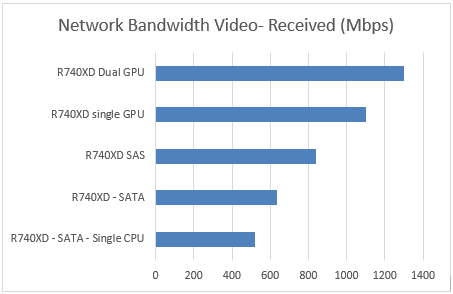
| Network BW (video-received) | 522 Mb/s | 637.18 Mb/s | 841 Mb/s | 1.1 Gb/s | 1.3 Gb/s | |
| Network BW (playback-sent) | 105 Mb/s | 103.44 Mb/s | 55 Mb/s | 100 Mb/s | 100 Mb/s | |
| OS disks | ||||||
| OS drive IOPS @95% | 3139 | 3690 | 5270 | 2500 | 833 | |
| Live DB disks | ||||||
| Live DB drive read/write ratio (IOPS) | 54% / 46% | 42% / 58% | 55% / 45% | 90% / 10% | 92% / 9% | |
| Live DB size | 48.95 TB (full) 84% | 48 TB (full) | 117 TB (full) | 1.96 TB (full) 54% disk | 1.96 TB (full) 54% disk | |
| Live DB drive disk throughput | 80 MB/s | 95 MB/s | 113 MB/s | 278 MB/s | 354 MB/s | |
| Live DB average daily writes | 5.9 TB | 6.07 TB | 8.01 TB | 10.4 TB | 11.28 TB | |
| Live DB drive IOPS @95% | 131 | 145 | 107 | 1463 | 2675 | |
| Archive DB disks | ||||||
| Archive R/W ratio | NA | NA | NA | 20% / 80% | 23% / 77% | |
| Archive DB size | NA | NA | NA | 39.16 TB (full DB) 75% disk | 38.13 TB (full DB) 71.3% disk | |
| Archive DB drive disk throughput | NA | NA | NA | 150 MB/s | 223.8 MB/s | |
| Archive DB average daily writes | NA | NA | NA | 10.4 TB | 11.28 TB | |
| Archive DB drive IOPS @95% | NA | NA | NA | 120 | 210 | |
| Disruptive application | ||||||
| Drive rebuild affect (RAID) | Negligible | Negligible | Negligible | Negligible | Negligible | |
| Live DB recovery time from power down | NA | <14 min | <20 min | <1 min | <1 min | |
| Archive DB recovery time from power down | NA | NA | NA | <12 min | <12 min | |
| Frames lost | ~0 | ~0 | ~0 | ~0 | ~0 | |
Comparative test results
The comparative test results are shown in the following graphics.