
The following table shows the time each of the benchmark phases explained in TPCx-BB metrics and phases took to complete and the associated score:
| Test | Duration | Score |
| Data generation | 0h:17m:53s:126ms (1,073 s) | N/A |
| Load test | 0h:17m:18s:110ms (1,038.110s) | T LD = 103.811 |
| Power test | 2h:29m:05s:796ms (8,945.796s) | T PT = 4485.916 |
| Throughput test | 11h:10m:50s:609ms (40,250.609s) | T TT = 3354.217 |
The load test is a measure of the time taken (TLOAD) to ingest the dataset into the data warehouse of the SUT. Ten percent of TLOAD contributes (TLD) to the performance metric. The power test performs all 30 queries sequentially and represents the maximum speed at which the SUT can process a single query on average. Each query’s runtime is discrete, unrelated, and nonlinear to the other queries. A geometric mean is used to find the central tendency in the set of the 30 query runtime results. The lower the score, TPT, the better the contribution to the performance metric.
In the throughput test phase, several streams of the 30 queries are run concurrently. In the context of TPCx-BB, a stream represents a single enterprise user submitting a sequence of the 30 queries in random order. By running multiple streams, the throughput test simulates the case of multiple enterprise users concurrently running a different sequence of the 30 queries. The throughput test captures the maximum speed at which the SUT can process a single stream (sequence) of the 30 queries on average. A valid TPCx-BB result requires a minimum of two streams to run concurrently. All the streams start execution simultaneously. The time it takes the slowest stream to finish, TTPUT, is divided by the number of streams to get the TTT metric. Typically, to find the best (that is, the lowest) possible value of TTT, several tests are performed, each with an increasing number of streams. This method is expected to produce a lower TTT. At some point, the underlying infrastructure (SUT) cannot sustain the increasing the number of streams and TTT starts to rise. The number of streams that provide the best TTT is used in the performance run. The three secondary metrics TLD, TPT, TTT contribute to the performance score BBQpm@SF, as described in TPCx-BB metrics and phase.
The following table shows the TPCx-BB Primary Metrics:
| Metric | Duration |
| Performance | 4,519.40 BBQpm@SF10000 |
| Price per performance | US $184.69/BBQpm@SF1000 |
| Availability date | 03 November 2023 |
The performance metric is an indication of the number of queries that the SUT can handle every minute. The price per performance metric is the cost of sustaining the performance score as derived from the three-year Total Cost of Ownership (TCO). The availability date is the date that all components that have been priced for the configuration are available to customers. The availability date must be within 180 days after the submission of the result to the TPC. To compare results, all three primary metrics must be reported. The TPC does not permit, and it discourages, the comparison of results measured against different dataset sizes (SF) and different currencies.
The following figure shows how performance improved significantly with each Dell hardware platform generation:
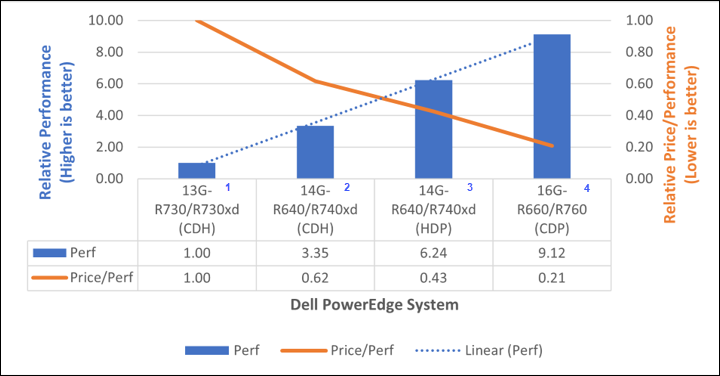
- TPCx-BB Result Highlights—Dell PowerEdge R730/R730xd (CDH)
- TPCx-BB Result Highlights—Dell PowerEdge R640/R740xd (CDH)
- TPCx-BB Result Highlights—Dell PowerEdge R640/R740xd (HDP)
- TPCx-BB Result Highlights—Dell PowerEdge R660/R760 (CDP)
Each hardware generation typically features a new processor generation. For instance:
- The Dell 13G hardware platform was powered by the Intel Xeon E5-2600 v4 product family (Broadwell).
- The Dell 14G hardware platform was powered by 1st Gen Intel Xeon Scalable Processors (Skylake) and 2nd Gen Intel Xeon Scalable Processors (Cascade Lake).
- The Dell 16G hardware platform was powered by 4th Gen Intel Xeon Scalable processors (Sapphire Rapids).
Performance improved by an impressive nine times from Dell’s 13G servers to 16G PowerEdge servers while Price per Performance dropped by a similarly stunning five times. These results highlight a great opportunity for businesses to refresh their IT infrastructure and unleash the multiple benefits of the Intel-powered Dell 16G PowerEdge servers, including reduced costs, better efficiency, and increased performance and productivity for data analytics and machine learning workloads.