
A valid TPCx-BB run consists of four phases that must be performed sequentially: Data generation, load test, power test, and throughput test1. Each of the load tests, power tests, and throughput tests produce a metric derived from their respective runtimes. The three metrics are then combined into the final performance metric, BBQpm@SF, which represents the benchmark queries-per-minute that the SUT processes for a certain dataset size, SF in GB. As stated previously, the scale factor used in this test is 10,000, which corresponds to approximately 10 TB of data.
In addition to the performance metric, users submitting results for publication must report the cost of the SUT (hardware and software) used to achieve their performance score. The price of the SUT is consolidated into the price per performance metric, $/BBQpm@SF. Consumers get a better perspective on the total cost of the system required to achieve certain performance scores. Both the BBQpm@SF and the $/BBQpm@SF metrics are published in the results after passing the TPC's audit process.
The following table presents details about each metric, their respective phases and composition, whether they are primary or secondary, as well as how they contribute to the final BBQpm@SF performance metric.
| Metric | Metric type | Phase | Description |
| N/A | N/A | Data generation | This process uses the included Parallel Dataset Generation Framework (PDGF) to create the input dataset. Users define the dataset size, namely the Scale Factor, that they want use for their test, in GB2. Results across different scale factors are not comparable according to the benchmark's specification. |
| TLD | Secondary | Load test | This value is defined as 10 percent of the total time needed by the SUT to ingest the previously generated dataset into a data warehouse system that enables analytics at a massive scale. |
| TPT | Power test | This value represents the average (geometric mean) time at which the SUT can run each of the 30 queries in TPCx-BB, when run sequentially. | |
| TTT | Throughput test | This value is an indicator of the maximum speed at which the SUT can process concurrent streams of the 30 queries. For a user-specified number of streams, each stream runs the 30 queries in a predefined order stipulated in the benchmark specification. | |
| BBQpm@SF | Primary | N/A | This performance metric represents the compute power of the SUT and can be computed using the following: 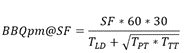 |
| $/BBQpm@SF | This price-performance metric shows the total cost of ownership of the SUT relative to the performance score obtained. | ||
| Availability date | This date is when the SUT is or was first publicly available for purchase. |