
Test results
Test results
-
IT organizations and DBA teams must typically accommodate tradeoffs between IOPS and latency. For example, the greater the number of databases, the more IOPS on the storage array and the greater the latency. This tradeoff between IOPS and latency occurs over time. In testing this architecture with mixed databases and workloads, we proved that this reference architecture can achieve submillisecond response times at scale. Our testing included running eight databases in parallel (five SQL Server databases and three Oracle databases) to determine where the tradeoff between IOPS and latency occurred on the PowerMax 8000 storage array. The eight databases running in parallel generated a total of 116,317 IOPS. The following table combines the IOPS, latencies, and throughput test results for all mixed workloads in the validation tests.
Table 6. Combined performance of IOPS, latency, and throughput
Type
Database
IOPS
Host Throughput (MB/s)
Latency (ms)
OLAP
Oracle
6,808
850
OLAP
SQL Server 1
3,873
524
OLAP
SQL Server 2
2,634
502
OLTP
Oracle
44,289
0.40
OLTP
SQL Server 1
19,882
0.47
OLTP
SQL Server 2
20,592
0.47
Snapshot
Oracle
9.689
0.55
Snapshot
SQL Server 1
8,550
0.57
The following three graphs demonstrate the performance of the tested workloads in terms of IOPS, host throughput (in MB/sec), and response time (in milliseconds).
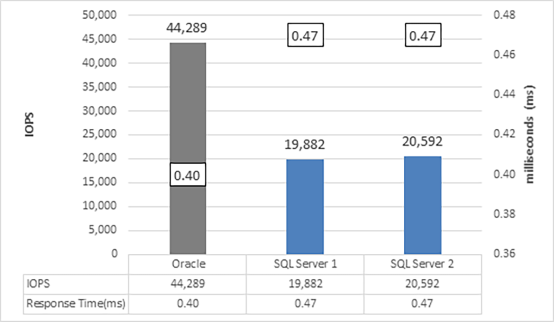
Figure 1. OLTP performance showing IOPS and response time
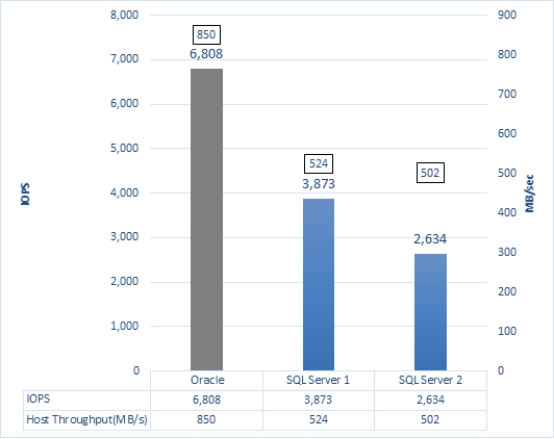
Figure 2. OLAP performance showing IOPS and throughput
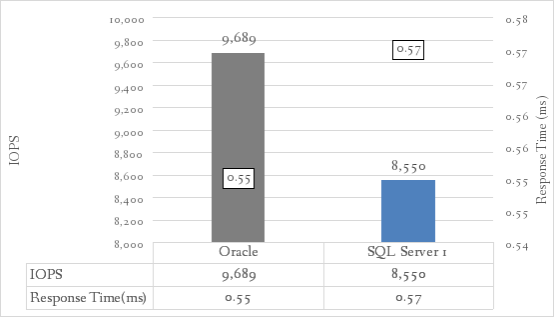
Figure 3. Snapshot OLTP performance showing IOPS and response time
With all the workloads running in parallel, the PowerMax array supported over 116,317 IOPS, as shown in Table 6, and maintained average response times under 0.6 milliseconds for all databases. Table 6 combines the SQL Server and Oracle metrics to show the impact of the workload on the system.
Our focus in running the OLAP workload was to generate throughput on the PowerMax 8000 array. Throughput is the amount of sustained data that is transferred, as supported by the infrastructure. As reflected in Table 6, both SQL Server and Oracle databases showed these performance characteristics:
- OLTP workloads generated high IOPS while response times remained consistently well under one millisecond
- OLAP workload demonstrated strong throughput
- Snapshot OLTP databases did not impact the source OLTP databases and response times remain at sub-millisecond levels
In Figure 1 and Figure 3 the findings show the performance profile required for OLTP workloads: the capability to support high IOPS while average response times are at a sub-millisecond level. These findings demonstrate the ability of the VxBlock to consolidate multiple types of workloads while addressing the performance requirements for each database.
Our testing also shows that no tradeoff occurs between IOPS and storage response time for this VxBlock 1000 configuration supporting eight databases and a mixture of OLTP and OLAP workloads. Customers can be confident with a properly sized mixed database/mixed workload solution based on the VxBlock System 1000 including Cisco UCS servers and PowerMax 8000 storage arrays. This platform can scale for business growth, continuing to provide strong storage performance while accommodating growing demand.