We conducted the performance analysis and characterization testing (PAAC) on this solution using the Login VSI load-generation tool. Login VSI is an industry-standard tool for benchmarking VDI workloads.
We performed this test with the Login VSI Task Worker workload. The test was performed on a three-node VxRail cluster using the "Memory-optimized" configuration with one exception: each host had 1 TB of memory instead of the standard 2 TB because of memory supply chain constraints. We created the RDSH VMs using Citrix Virtual and Apps and Desktops using MCS clone technology and used the default Citrix Thinwire+ display protocol.
Login VSI Task Worker test results
The Citrix Virtual Apps and Desktops testing was performed with 10 Windows Server 2022 session host VMs per physical host. A total of 780 user sessions were logged on with 260 users per host, equaling 26 user sessions per RDSH host and 4 users per instance.
CPU usage
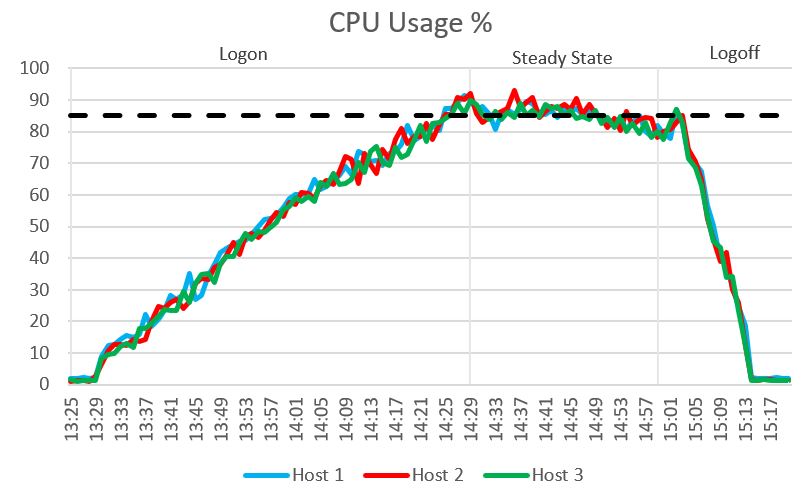
CPU usage steadily increased during the login phase and converged at the defined threshold during the steady-state phase of the test. The nodes showed only slight variations in usage during the login phase, which appears to be a normal distribution of usage. No anomalies were seen during testing.
The 85 percent value is exactly at the pass/fail threshold that we set for average CPU utilization. To maintain good EUE, do not exceed this threshold. You can load more user sessions while exceeding this threshold for CPU, but you might experience a degradation in user experience.
Figure 5. CPU usage
CPU readiness
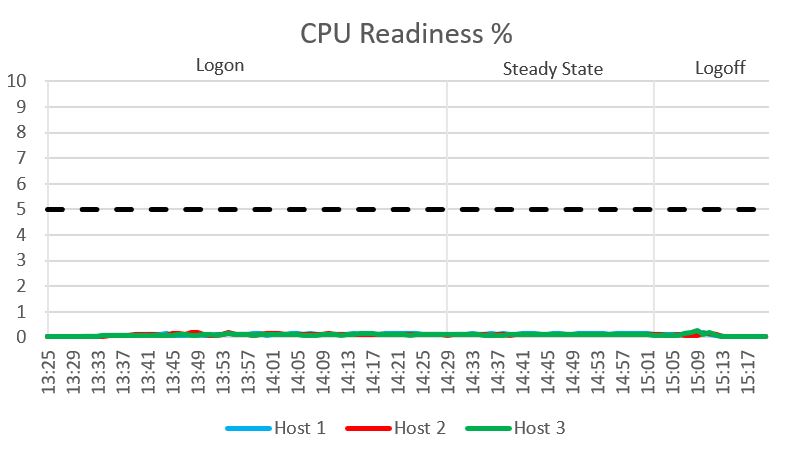
CPU readiness remained at an acceptable level and well below the defined threshold. No anomalies were seen during testing.
Figure 6. CPU readiness
CPU core utilization
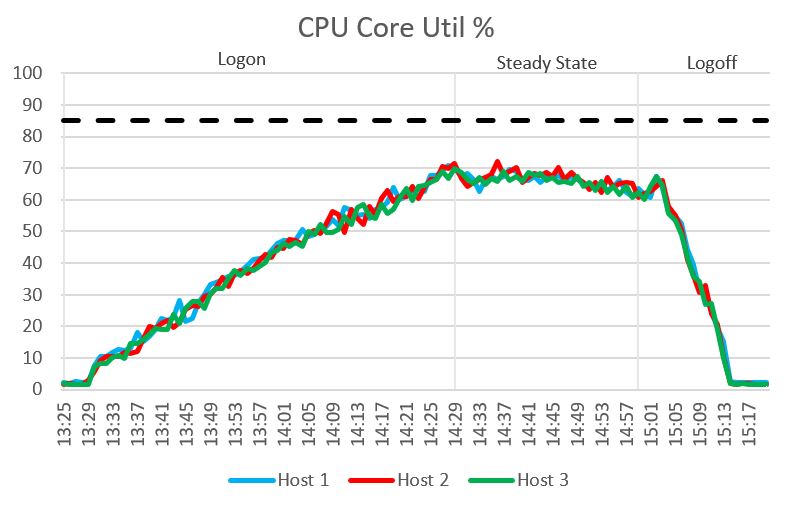
CPU core utilization steadily increased during the login phase and converged during the steady-state phase of the test. The compute nodes showed only slight variations in core utilization during the login phase, which appears to be a normal distribution of usage. No anomalies were seen during testing.
Figure 7. CPU core utilization
Memory
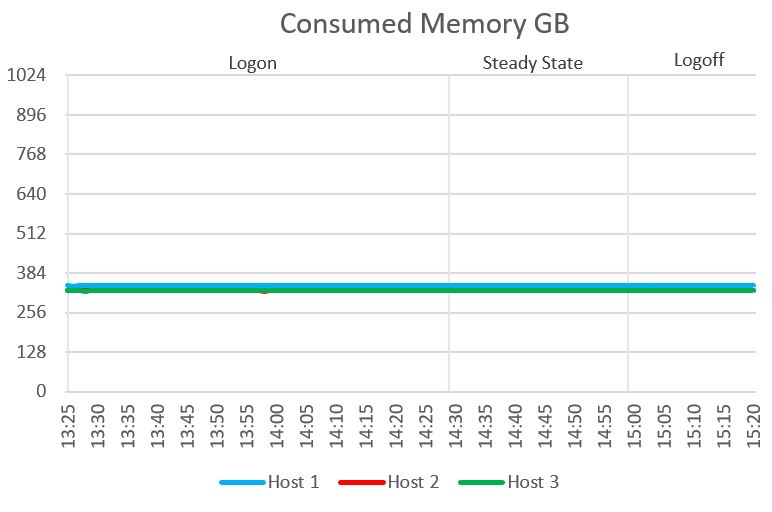
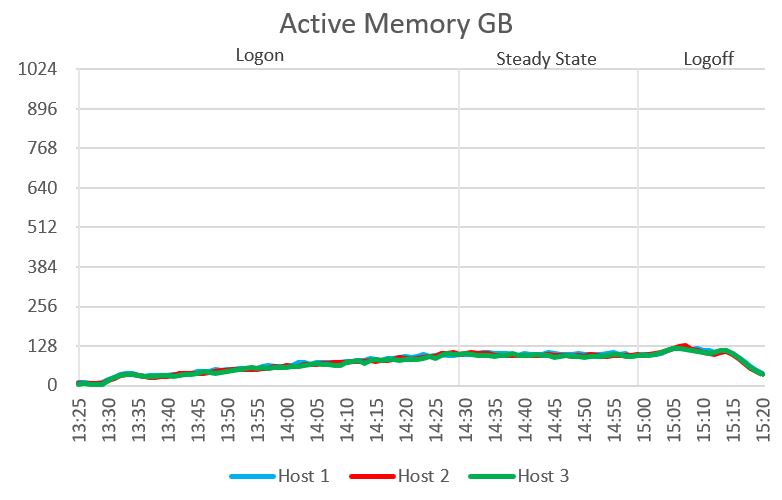
Consumed memory remained below the physical capacity installed on each host as did active memory usage. No memory ballooning or paging was observed at any point during testing. Consumed memory did not vary during testing as all the memory assigned to the session host VMs was reserved.
Figure 8. Consumed memory Figure 9. Active memory
Network usage
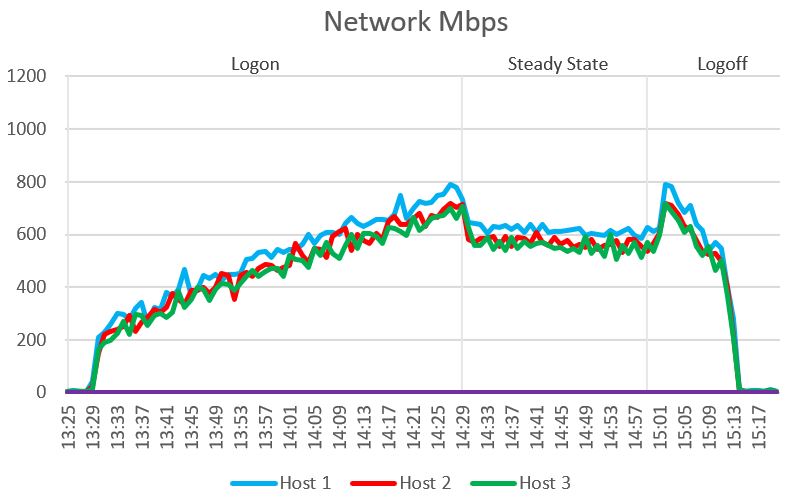
Network bandwidth steadily increased during the login phase and converged during the steady-state phase of the test. One of the compute nodes showed slightly higher network traffic during the login, steady-state, and logout phases, which does not appear to be abnormal and may be as a result of hosting a VxRail management VM. No anomalies were seen during testing.
Figure 10. Network usage
Cluster IOPS
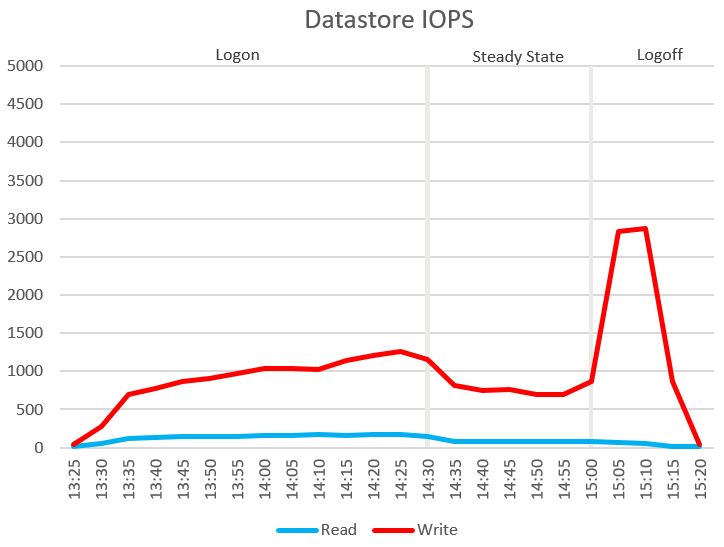
Total IOPS generated was as expected for testing with session hosts with higher write IOPS, especially as the systems logged off and wrote their profiles. No anomalies were observed during testing.
Figure 11. Cluster IOPS
Disk I/O latency
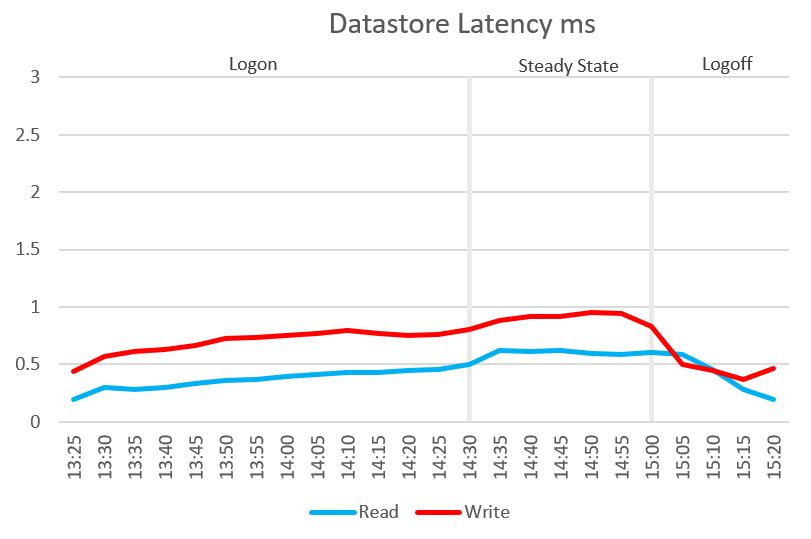
Disk latency on all physical nodes remained at an acceptable level and well below the defined threshold (20 ms). No anomalies were seen during testing.
Figure 12. Disk I/O latency
User experience
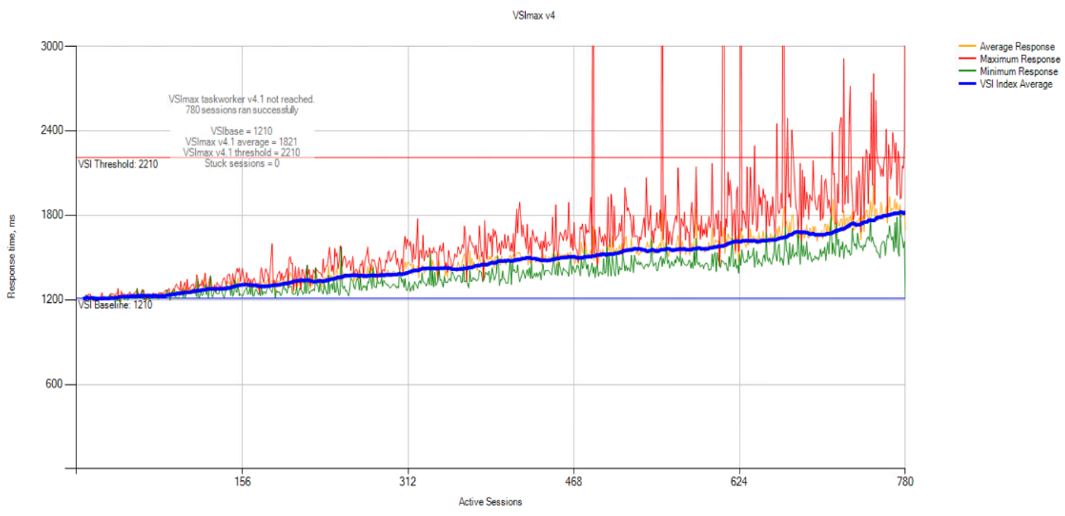
The baseline score for the Login VSI test was 1,210. This score falls in the 1,200 to 1,599 range rated as "Fair" by Login VSI. For more information about Login VSI baseline ratings and calculations, see VSImax baseline scores.
As indicated by the blue line in the following graph, the system reached a VSImax average score of 1,821 when 780 sessions were loaded. This value is well below the VSI threshold score of 2,210 set by the Login VSI tool. During the testing, VSImax was never reached, which typically indicates a stable system and a better user experience.
When manually interacting with the sessions during the steady-state phase, the mouse and window movement were responsive and video playback was good. No "stuck sessions" were reported during the testing, indicating that the system was not overloaded at any point.