


Quantifying Performance of Dell EMC PowerEdge R7525 Servers with NVIDIA A100 GPUs for Deep Learning Inference
Tue, 17 Nov 2020 21:10:22 -0000
|Read Time: 0 minutes
The Dell EMC PowerEdge R7525 server provides exceptional MLPerf Inference v0.7 Results, which indicate that:
- Dell Technologies holds the #1 spot in performance per GPU with the NVIDIA A100-PCIe GPU on the DLRM-99 Server scenario
- Dell Technologies holds the #1 spot in performance per GPU with the NVIDIA A100-PCIe on the DLRM-99.9 Server scenario
- Dell Technologies holds the #1 spot in performance per GPU with the NVIDIA A100-PCIe on the ResNet-50 Server scenario
Summary
In this blog, we provide the performance numbers of our recently released Dell EMC PowerEdge R7525 server with two NVIDIA A100 GPUs on all the results of the MLPerf Inference v0.7 benchmark. Our results indicate that the PowerEdge R7525 server is an excellent choice for inference workloads. It delivers optimal performance for different tasks that are in the MLPerf Inference v0.7 benchmark. These tasks include image classification, object detection, medical image segmentation, speech to text, language processing, and recommendation.
The PowerEdge R7525 server is a two-socket, 2U rack server that is designed to run workloads using flexible I/O and network configurations. The PowerEdge R7525 server features the 2nd Gen AMD EPYC processor, supports up to 32 DIMMs, has PCI Express (PCIe) Gen 4.0-enabled expansion slots, and provides a choice of network interface technologies to cover networking options.
The following figure shows the front view of the PowerEdge R7525 server:
Figure 1. Dell EMC PowerEdge R7525 server
The PowerEdge R7525 server is designed to handle demanding workloads and for AI applications such as AI training for different kinds of models and inference for different deployment scenarios. The PowerEdge R7525 server supports various accelerators such as NVIDIA T4, NVIDIA V100S, NVIDIA RTX, and NVIDIA A100 GPU s. The following sections compare the performance of NVIDIA A100 GPUs with NVIDIA T4 and NVIDIA RTX GPUs using MLPerf Inference v0.7 as a benchmark.
The following table provides details of the PowerEdge R7525 server configuration and software environment for MLPerf Inference v0.7:
Component | Description |
Processor | AMD EPYC 7502 32-Core Processor |
Memory | 512 GB (32 GB 3200 MT/s * 16) |
Local disk | 2x 1.8 TB SSD (No RAID) |
Operating system | CentOS Linux release 8.1 |
GPU | NVIDIA A100-PCIe-40G, T4-16G, and RTX8000 |
CUDA Driver | 450.51.05 |
CUDA Toolkit | 11.0 |
Other CUDA-related libraries | TensorRT 7.2, CUDA 11.0, cuDNN 8.0.2, cuBLAS 11.2.0, libjemalloc2, cub 1.8.0, tensorrt-laboratory mlperf branch |
Other software stack | Docker 19.03.12, Python 3.6.8, GCC 5.5.0, ONNX 1.3.0, TensorFlow 1.13.1, PyTorch 1.1.0, torchvision 0.3.0, PyCUDA 2019.1, SacreBLEU 1.3.3, simplejson, OpenCV 4.1.1 |
System profiles | Performance |
For more information about how to run the benchmark, see Running the MLPerf Inference v0.7 Benchmark on Dell EMC Systems.
MLPerf Inference v0.7 performance results
The MLPerf inference benchmark measures how fast a system can perform machine learning (ML) inference using a trained model in various deployment scenarios. The following results represent the Offline and Server scenarios of the MLPerf Inference benchmark. For more information about different scenarios, models, datasets, accuracy targets, and latency constraints in MLPerf Inference v0.7, see Deep Learning Performance with MLPerf Inference v0.7 Benchmark.
In the MLPerf inference evaluation framework, the LoadGen load generator sends inference queries to the system under test, in our case, the PowerEdge R7525 server with various GPU configurations. The system under test uses a backend (for example, TensorRT, TensorFlow, or PyTorch) to perform inferencing and sends the results back to LoadGen.
MLPerf has identified four different scenarios that enable representative testing of a wide variety of inference platforms and use cases. In this blog, we discuss the Offline and Server scenario performance. The main differences between these scenarios are based on how the queries are sent and received:
- Offline—One query with all samples is sent to the system under test. The system under test can send the results back once or multiple times in any order. The performance metric is samples per second.
- Server—Queries are sent to the system under test following a Poisson distribution (to model real-world random events). One query has one sample. The performance metric is queries per second (QPS) within latency bound.
Note: Both the performance metrics for Offline and Server scenario represent the throughput of the system.
In all the benchmarks, two NVIDIA A100 GPUs outperform eight NVIDIA T4 GPUs and three NVIDIA RTX800 GPUs for the following models:
- ResNet-50 image classification model
- SSD-ResNet34 object detection model
- RNN-T speech recognition model
- BERT language processing model
- DLRM recommender model
- 3D U-Net medical image segmentation model
The following graphs show PowerEdge R7525 server performance with two NVIDIA A100 GPUs, eight NVIDIA T4 GPUs, and three NVIDIA RTX8000 GPUs with 99% accuracy target benchmarks and 99.9% accuracy targets for applicable benchmarks:
- 99% accuracy (default accuracy) target benchmarks: ResNet-50, SSD-Resnet34, and RNN-T
- 99% and 99.9% accuracy (high accuracy) target benchmarks: DLRM, BERT, and 3D-Unet
99% accuracy target benchmarks
ResNet-50
The following figure shows results for the ResNet-50 model:
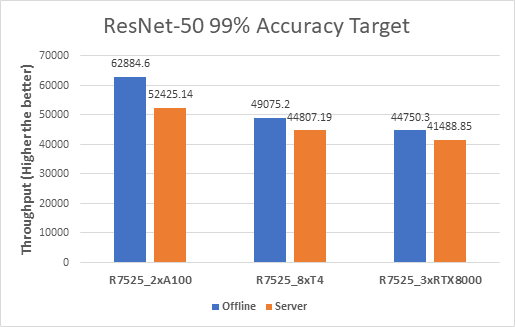
Figure 2. ResNet-50 Offline and Server inference performance
From the graph, we can derive the per GPU values. We divide the system throughput (containing all the GPUs) by the number of GPUs to get the Per GPU results as they are linearly scaled.
SSD-Resnet34
The following figure shows the results for the SSD-Resnet34 model:
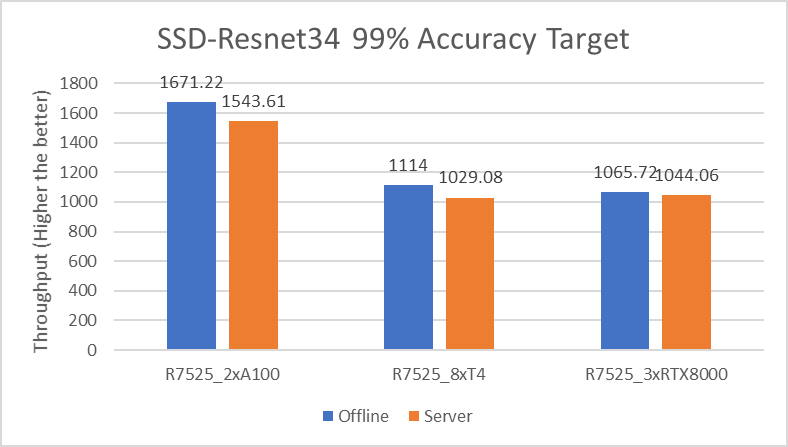
Figure 3. SSD-Resnet34 Offline and Server inference performance
RNN-T
The following figure shows the results for the RNN-T model:
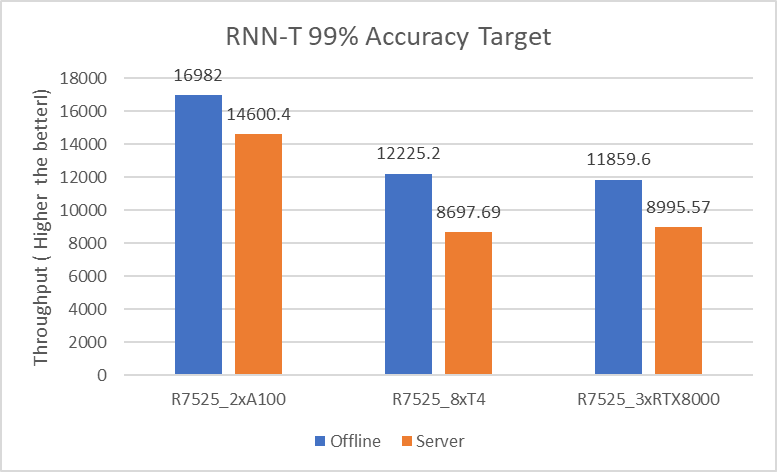
Figure 4. RNN-T Offline and Server inference performance
99.9% accuracy target benchmarks
DLRM
The following figures show the results for the DLRM model with 99% and 99.9% accuracy:
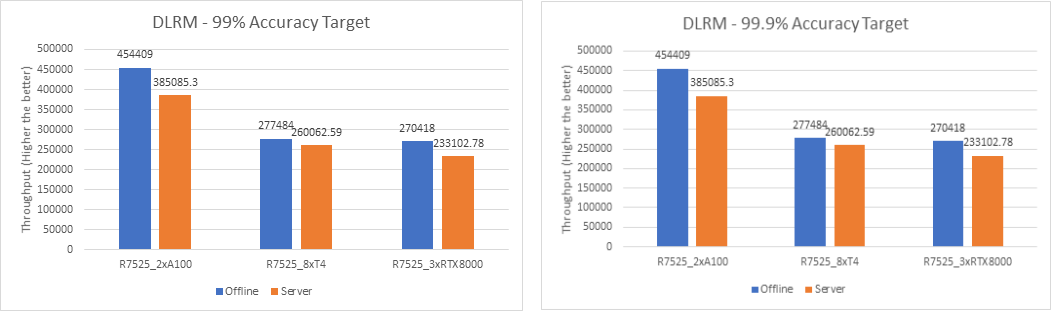
Figure 5. DLRM Offline and Server Scenario inference performance – 99% and 99.9% accuracy
For the DLRM recommender and 3D U-Net medical image segmentation (see Figure 7) models, both 99% and 99.9% accuracy have the same throughput. The 99.9% accuracy benchmark also satisfies the required accuracy constraints with the same throughput as that of 99%.
BERT
The following figures show the results for the BERT model with 99% and 99.9% accuracy:
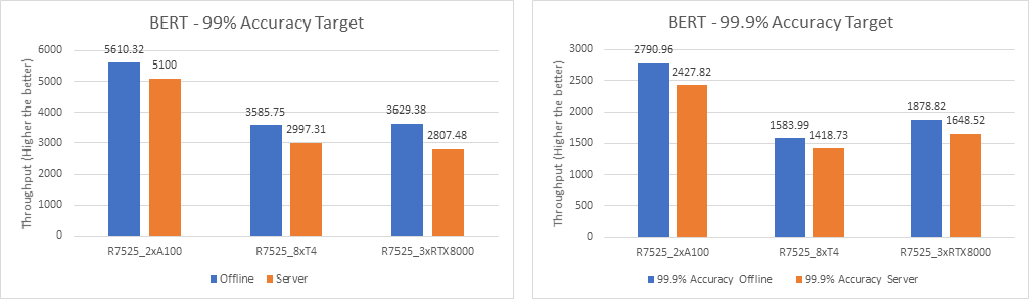
Figure 6. BERT Offline and Server inference performance – 99% and 99.9% accuracy
For the BERT language processing model, two NVIDIA A100 GPUs outperform eight NVIDIA T4 GPUs and three NVIDIA RTX8000 GPUs. However, the performance of three NVIDIA RTX8000 GPUs is a little better than that of eight NVIDIA T4 GPUs.
3D U-Net
For the 3D-Unet medical image segmentation model, only the Offline scenario benchmark is available.
The following figure shows the results for the 3D U-Net model Offline scenario:
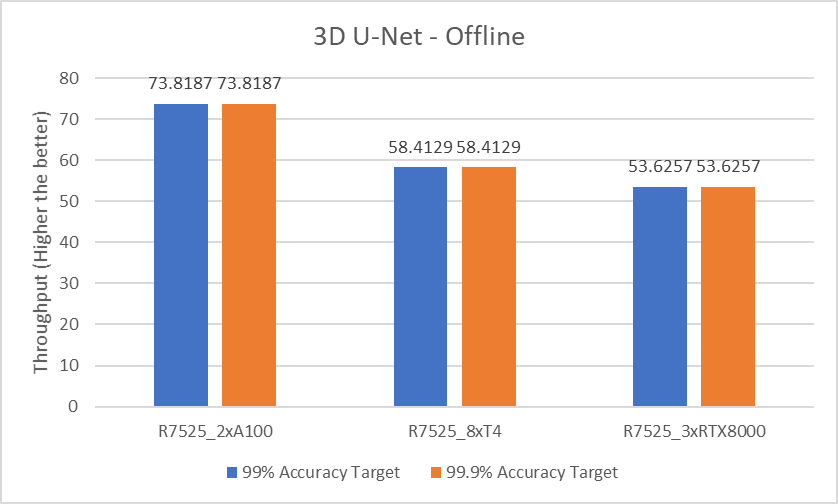
Figure 7. 3D U-Net Offline inference performance
For the 3D-Unet medical image segmentation model, since there is only offline scenario benchmark for 3D-Unet the above graph represents only Offline scenario.
The following table compares the throughput between two NVIDIA A100 GPUs, eight NVIDIA T4 GPUs, and three NVIDIA RTX8000 GPUs with 99% accuracy target benchmarks and 99.9% accuracy targets:
Model | Scenario | Accuracy | 2 x A100 GPUs vs 8 x T4 GPUs | 2 x A100 GPUs vs 3 x RTX8000 GPUs |
ResNet-50 | Offline | 99% | 5.21x | 2.10x |
Server | 4.68x | 1.89x | ||
SSD-Resnet34 | Offline | 6.00x | 2.35x | |
Server | 5.99x | 2.21x | ||
RNN-T | Offline | 5.55x | 2.14x | |
Server | 6.71x | 2.43x | ||
DLRM | Offline | 6.55x | 2.52x | |
Server | 5.92x | 2.47x | ||
Offline | 99.9% | 6.55x | 2.52x | |
Server | 5.92x | 2.47x | ||
BERT | Offline | 99% | 6.26x | 2.31x |
Server | 6.80x | 2.72x | ||
Offline | 99.9% | 7.04x | 2.22x | |
Server | 6.84x | 2.20x | ||
3D U-Net | Offline | 99% | 5.05x | 2.06x |
Server | 99.9% | 5.05x | 2.06x |
Conclusion
With support of NVIDIA A100, NVIDIA T4, or NVIDIA RTX8000 GPUs, Dell EMC PowerEdge R7525 server is an exceptional choice for various workloads that involve deep learning inference. However, the higher throughput that we observed with NVIDIA A100 GPUs translates to performance gains and faster business value for inference applications.
Dell EMC PowerEdge R7525 server with two NVIDIA A100 GPUs delivers optimal performance for various inference workloads, whether it is in a batch inference setting such as Offline scenario or Online inference setting such as Server scenario.
Next steps
In future blogs, we will discuss sizing the system (server and GPU configurations) correctly based on the type of workload (area and task).