


Nanoscale Molecular Dynamics (NAMD) Performance with Dell EMC PowerEdge R750xa & NVIDIA A series GPUs
Thu, 22 Jul 2021 09:03:25 -0000
|Read Time: 0 minutes
Overview
Over the past decade, GPUs have become popular in scientific computing because of their great ability to exploit a high degree of parallelism. NVIDIA has optimized life sciences applications to run on their general-purpose GPUs. Unfortunately, these GPUs can only be programmed with CUDA, OpenACC, or the OpenCL framework. Most of the life sciences community is not familiar with these frameworks so few biologists or bioinformaticians can make efficient use of GPU architectures. However, GPUs have been making inroads into the molecular dynamics simulation (MDS) field since MD was developed in the 1950s. MDS requires heavy computational work to simulate biomolecular structures or their interactions.
In this blog, the performance of one popular MDS application, NAMD, is presented with various NVIDIA A-series GPUs such as the A100, the A10, the A30 and the A40 . NAMD is a free and open-source parallel MD package designed for analyzing the physical movements of atoms and molecules.
Dell Technologies has released the new PowerEdge R750xa server, a GPU workload platform that is designed to support artificial intelligence, machine learning, and high-performance computing solutions. The dual socket/2U platform supports 3rd Gen Intel Xeon Scalable Processors (code named Ice Lake). It supports up to 40 cores per processor, has eight memory channels per CPU, and up to 32 DDR4 DIMMs at 3200 MT/s DIMM speed. This server can accommodate up to four double-width PCIe GPUs that are located in the front left and the front right of the server. The test server configurations are summarized in Table 1, and the specifications of tested NVIDIA GPUs are listed in Table 2.
Table 1: Tested compute node configuration
Test Beds | ||||
Server | Dell EMC PowerEdge R750xa | Dell EMC PowerEdge R740 | ||
CPU | Intel(R) Xeon(R) Platinum 8380 CPU @ 2.30 GHz | Intel(R) Xeon(R) Platinum 8360Y CPU @ 2.40 GHz | Intel(R) Xeon(R) Gold 6248 CPU @ 2.50 GHz | |
NVIDIA GPUs | 4 x A100 | 4 x A10 | 4 x A30 | 2 x A40 |
RAM | DDR4 1024 GB (32 x 32 GB) 3200 MT/s | DDR4 384 GB (24 x 16 GB) 2933 MT/s | ||
Operating system | RHEL 8.3 (4.18.0-240.el8.x86_64) | |||
Filesystem network | Mellanox InfiniBand HDR100 | |||
Filesystem | Dell EMC Ready Solutions for HPC BeeGFS High Capacity Storage | |||
BIOS system profile | Performance Optimized | |||
Logical processor | Disabled | |||
Virtualization technology | Disabled | |||
Cuda/Toolkit | 11.2 | |||
OpenMPI | 4.1.1 | |||
NAMD | NAMD_Git-2021-04-01_Source | |||
Table 2: Specifications of tested NVIDIA GPUs
NVIDIA GPUs | ||||
| ||||
FP64 (TFLOPS) | 9.7 | Unknown | 5.2 | Unknown |
FP64 Tensor Core (TFLOPS) | 19.5 | Unknown | 10.3 | Unknown |
FP32 (TFLOPS) | 19.5 | 31.2 | 10.3 | 37.4 |
Tensor Float 32 (TFLOPS) | 156 | 312* | 62.5 | 125* | 82 | 165 * | 74.8 | 149.6* |
BFLOAT16 Tensor Core (TFLOPS) | 312 | 624* | 125 | 250* | 165 | 330* | 149.7 | 299.4* |
FP16 Tensor Core (TFLOPS) | 312 | 624* | 125 | 250* | 165 | 330* | 149.7 | 299.4* |
INT8 Tensor Core (TOPS) | 624 | 1248* | 250 | 500* | 330 | 661* | 299.3 | 598.6* |
INT4 Tensor Core (TOPS) | Unknown | 500 | 1,000* | 661 | 1321* | 598.7 | 1,197.4* |
GPU memory | 40 GB HBM2 | 24 GB GDDR6 | 24 GB HBM2 | 48 GB GDDR6 |
GPU memory bandwidth | 1,555 GB/s | 600 GB/s | 933 GB/s | 696 GB/s |
Max Thermal Design Power (TDP) | 400W | 150W | 165W | 300W |
Multi-Instance GPU | Up to 7 MIGs @ 5 GB | Unknown | 4 GPU instances @ 6 GB each 2 GPU instances @ 12 GB each 1 GPU instance @ 24 GB | Unknown |
Form factor | PCIe | Single-slot, full-height, full-length (FHFL) | Dual-slot, full-height, full-length (FHFL) | 4.4" (H) x 10.5" (L) dual slot |
Interconnect | PCIe Gen4: 64 GB/s | PCIe Gen4: 64 GB/s | PCIe Gen4: 64 GB/s
| PCIE Gen4 x 16 31.5 GB/s (bidirectional) |
* With sparsity
Performance Evaluation
NAMD
NAMD was compiled from source code (NAMD_Git-2021-04-01_Source) using GCC 11.1 and CUDA 11.2. We used a test data set, the 1.06 million-atom system of Satellite Tabacco Mosaic Virus (SMTV).
Figure 1 shows the performance of four GPUs with the STMV dataset. The figures represent the performance changes in nanoseconds per day (ns/day) with various numbers of cores used with one, two or four GPUs. The only valid comparison between the various GPUs is NVIDIA A100 and A10 since the test systems were configured identically. Although the performance of NAMD is affected by the CPU clock speed, the tested systems are not significantly different from the CPU’s clock speed. The A10 is rated at three times the single precision FLOPS of the A30, and the A10 performs better than the A30 on the two GPU tests even with slightly slower CPUs. The A100 outperformed by roughly 25 percent and 16 percent on single and two GPU tests when comparing the A10’s results, respectively.
The results from four GPU tests in Figure 1 show similar performance for the different GPUs. This agrees well with our previous test results that NAMD does not scale after two GPUs. We can rule out a potential argument that the data size might be too small since 3 million atom data, HECBioSim3000k-atom system, which is a pair of 1IVO and 1NQL hEGFR tetramers, shows similar or worse results (those results are not shown here).
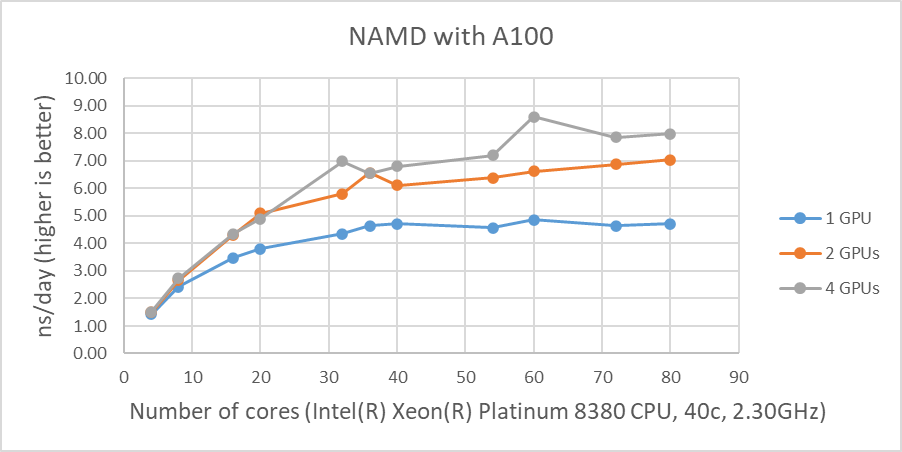
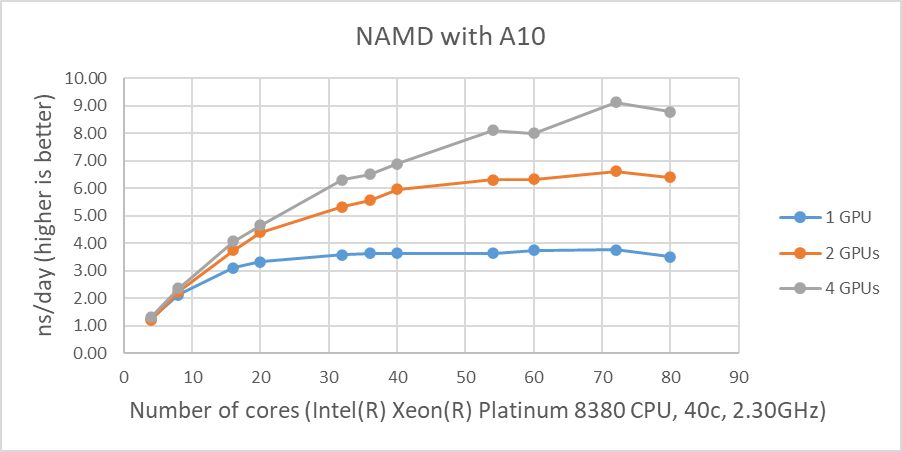
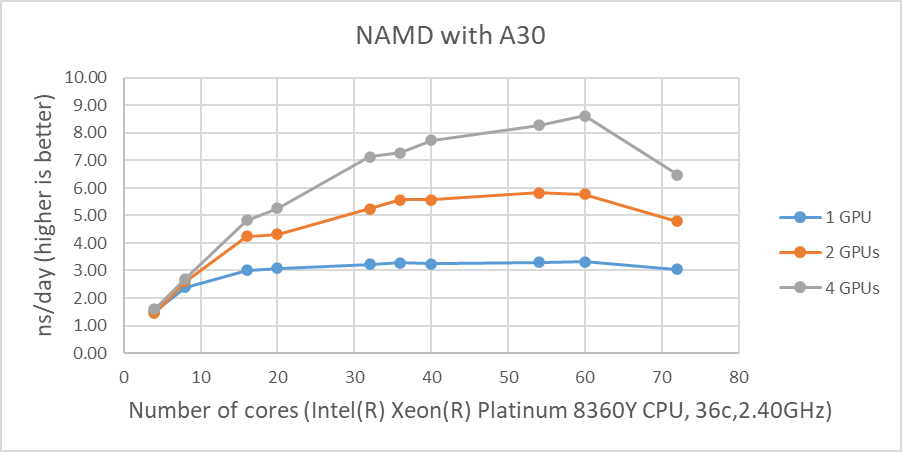
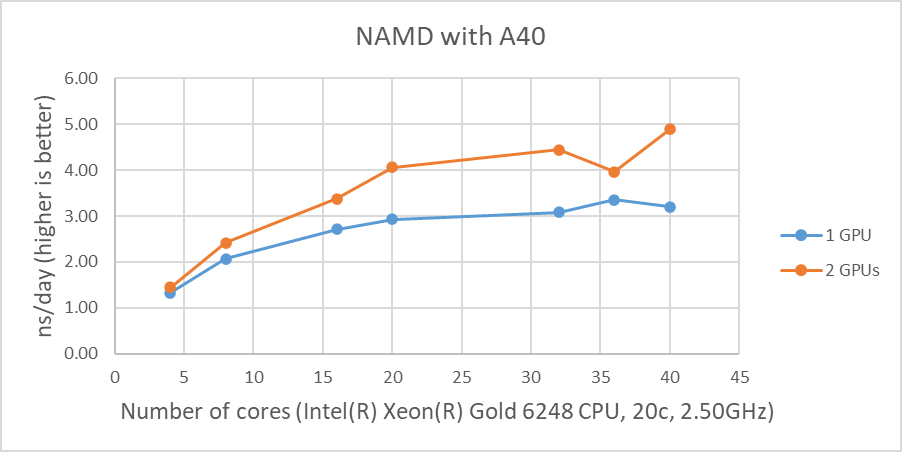
Figure 1: NAMD performance with STMV, 1 million-atom system |
As shown in Figure 1, when four GPUs were tested , all of the GPUs except the A40 reached ~9 ns/day simulations. And, in terms of maximum performance, the A10 performs the highest number of simulations, 9.121 ns/day. However, these numbers are not true reflections of the performance due to the scalability limitations. Although all four GPU test results are similar, the A100 has a better throughput than other GPUs for the two GPU test as shown in Figure 2. Also, it is worth noting that the A10 and the A40 are not suitable for general-purpose computing due to the lack of double-precision support.
Figure 2 shows the performance comparisons among the different GPUs we tested in this study. Again, the A30 performed better than the A10 up to the 16 cores. It is difficult to determine why the A30 doesn’t perform as well with a large number of active CPU cores(20 and more).
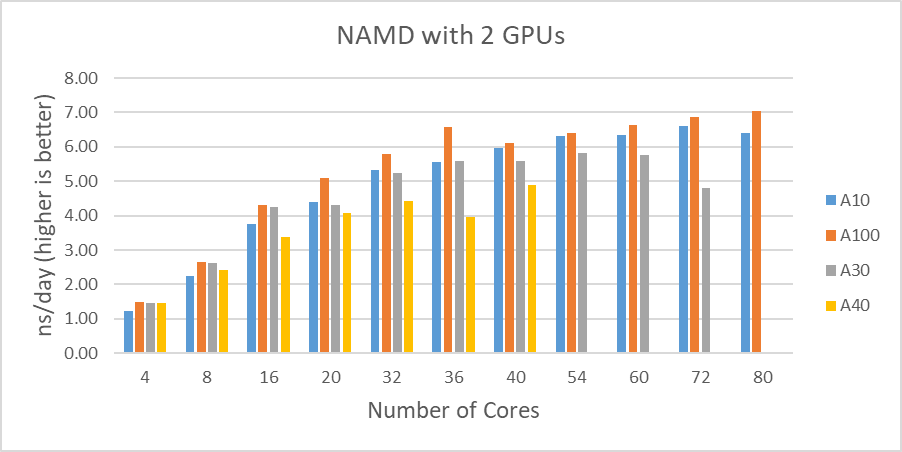
Figure 2: STMV test results comparisons with two GPUs |
Conclusion
The A100 shows a dominant performance and is the most capable card among the A-series GPUs. Although the A30 did not perform as well as the A10 in our test , it is another outstanding choice for versatile applications.
The A10 performed well compared to the A30, and it is the successor of the T4, which was the most cost-effective solution for specific applications such as genomics data analysis.
Since it is not possible to obtain the accurate performance differences among A-series GPUs from this study, further investigation is necessary to achieve a clear picture of these general purpose GPUs.