


Deep Learning Performance with MLPerf Inference v0.7 Benchmark
Mon, 21 Jun 2021 18:33:56 -0000
|Read Time: 0 minutes
Summary
MLPerf is a benchmarking suite that measures the performance of Machine Learning (ML) workloads. It focuses on the most important aspects of the ML life cycle:
- Training—The MLPerf training benchmark suite measures how fast a system can train ML models.
- Inference—The MLPerf inference benchmark measures how fast a system can perform ML inference by using a trained model in various deployment scenarios.
This blog outlines the MLPerf inference v0.7 data center closed results on Dell EMC PowerEdge R7525 and DSS8440 servers with NVIDIA GPUs running the MLPerf inference benchmarks. Our results show optimal inference performance for the systems and configurations on which we chose to run inference benchmarks.
In the MLPerf inference evaluation framework, the LoadGen load generator sends inference queries to the system under test (SUT). In our case, the SUTs are carefully chosen PowerEdge R7525 and DSS8440 servers with various GPU configurations. The SUT uses a backend (for example, TensorRT, TensorFlow, or PyTorch) to perform inferencing and sends the results back to LoadGen.
MLPerf has identified four different scenarios that enable representative testing of a wide variety of inference platforms and use cases. The main differences between these scenarios are based on how the queries are sent and received:
- Offline—One query with all samples is sent to the SUT. The SUT can send the results back once or multiple times in any order. The performance metric is samples per second.
- Server—The queries are sent to the SUT following a Poisson distribution (to model real-world random events). One query has one sample. The performance metric is queries per second (QPS) within latency bound.
- Single-stream—One sample per query is sent to the SUT. The next query is not sent until the previous response is received. The performance metric is 90th percentile latency.
- Multi-stream—A query with N samples is sent with a fixed interval. The performance metric is max N when the latency of all queries is within a latency bound.
MLPerf Inference Rules describes detailed inference rules and latency constraints. This blog only focuses on Offline and Server scenarios, which are designed for data center environments. Single-stream and Multi-stream scenarios are designed for nondatacenter (edge and IoT) settings.
MLPerf Inference results can be submitted under either of the following divisions:
- Closed division—The Closed division is intended to provide an “apples to apples” comparison of hardware platforms or software frameworks. It requires using the same model and optimizer as the reference implementation.
The Closed division requires using preprocessing, postprocessing, and model that is equivalent to the reference or alternative implementation. It allows calibration for quantization and does not allow any retraining. MLPerf provides a reference implementation of each benchmark. The benchmark implementation must use a model that is equivalent, as defined in MLPerf Inference Rules, to the model used in the reference implementation.
- Open division—The Open division is intended to foster faster models and optimizers and allows any ML approach that can reach the target quality. It allows using arbitrary preprocessing or postprocessing and model, including retraining. The benchmark implementation may use a different model to perform the same task.
To allow the apples-to-apples comparison of Dell EMC results and enable our customers and partners to repeat our results, we chose to conduct testing under the Closed division, as shown in the results in this blog.
Criteria for MLPerf Inference v0.7 benchmark result submission
The following table describes the MLPerf benchmark expectations:
Table 1: Available benchmarks in the Closed division for MLPerf inference v0.7 with their expectations.
Area | Task | Model | Dataset | QSL size | Required quality | Required server latency constraint |
Vision | Image classification | Resnet50-v1.5 | Standard image dataset (224 x 224 x 3) | 1024 | 99% of FP32 (76.46%) | 15 ms |
Vision | Object detection (large) | SSD-ResNet34 | COCO (1200x1200) | 64 | 99% of FP32 (0.20 mAP) | 100 ms |
Vision | Medical image segmentation | 3D UNET | BraTS 2019 (224x224x160) | 16 | 99% of FP32 and 99.9% of FP32 (0.85300 mean DICE score) | N/A |
Speech | Speech-to-text | RNNT | Librispeech dev-clean (samples < 15 seconds) | 2513 | 99% of FP32 (1 - WER, where WER=7.452253714852645%) | 1000 ms |
Language | Language processing | BERT | SQuAD v1.1 (max_seq_len=384) | 10833 | 99% of FP32 and 99.9% of FP32 (f1_score=90.874%) | 130 ms |
Commerce | Recommendation | DLRM | 1 TB Click Logs | 204800 | 99% of FP32 and 99.9% of FP32 (AUC=80.25%) | 30 ms |
For any benchmark, it is essential for the result submission to meet all the specifications in this table. For example, if we choose the Resnet50 model, then the submission must meet the 76.46 percent target accuracy and the latency must be within 15 ms for the standard image dataset with dimensions of 224 x 224 x 3.
Each data center benchmark requires the scenarios in the following table:
Table 2: Tasks and corresponding required scenarios for data center benchmark suite in MLPerf inference v0.7.
Area | Task | Required scenarios |
Vision | Image classification | Server, Offline |
Vision | Object detection (large) | Server, Offline |
Vision | Medical image segmentation | Offline |
Speech | Speech-to-text | Server, Offline |
Language | Language processing | Server, Offline |
Commerce | Recommendation | Server, Offline |
SUT configurations
We selected the following servers with different types of NVIDIA GPUs as our SUT to conduct data center inference benchmarks:
Results
The following provides the results of the MLPerf Inference v0.7 benchmark.
For the Offline scenario, the performance metric is Offline samples per second. For the Server scenario, the performance metric is queries per second (QPS). In general, the metrics represent throughput.
The following graphs include performance metrics for the Offline and Server scenarios. A higher throughput is a better result.
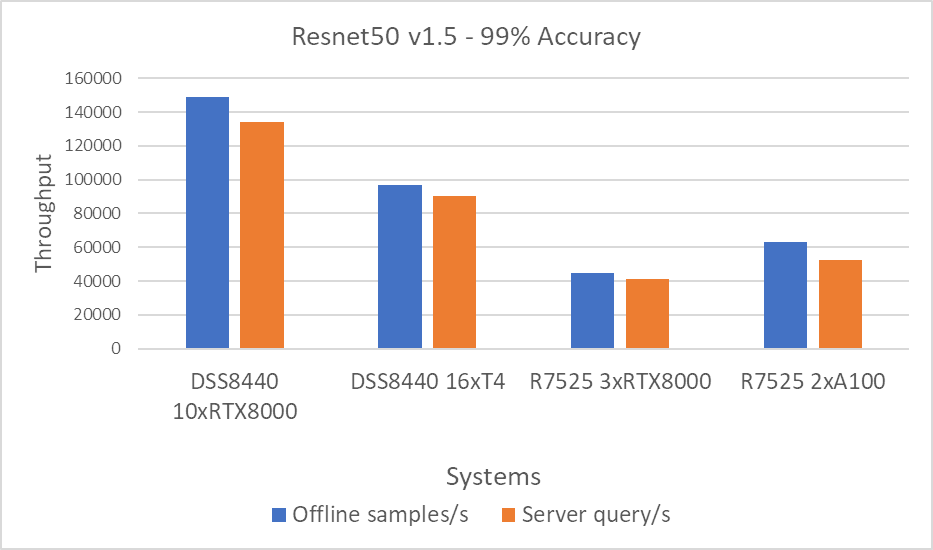
Figure 1: Resnet50 v1.5 Offline and Server scenario with 99 percent accuracy target
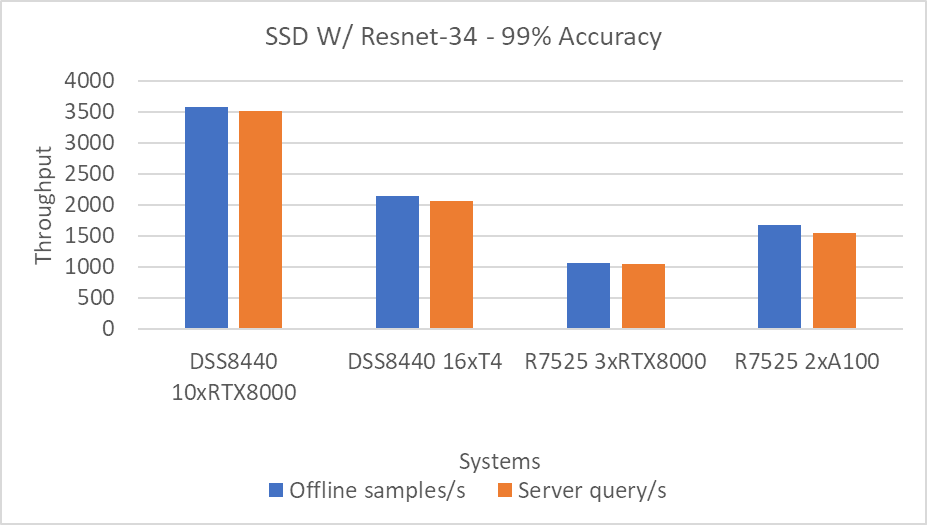
Figure 2: SSD w/ Resnet34 Offline and Server scenario with 99 percent accuracy target
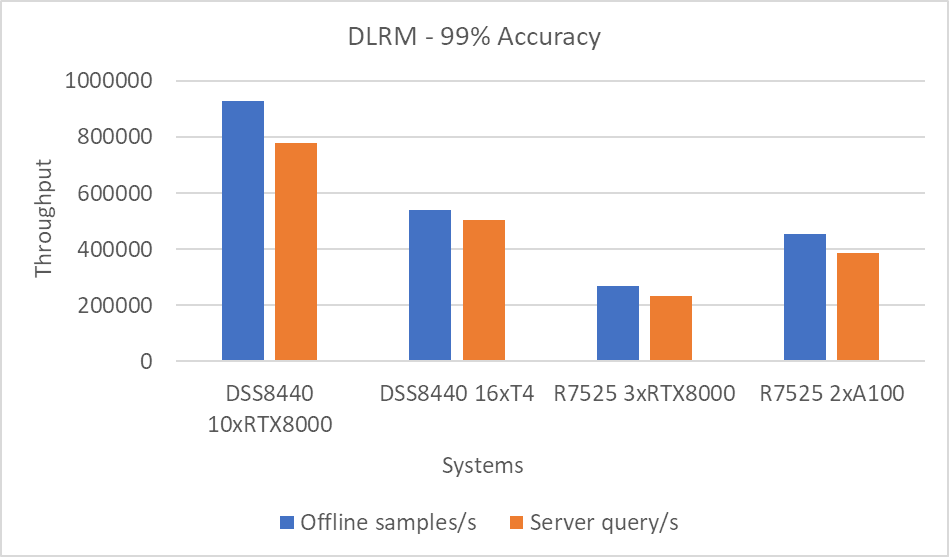
Figure 3: DLRM Offline and Server scenario with 99 percent accuracy target
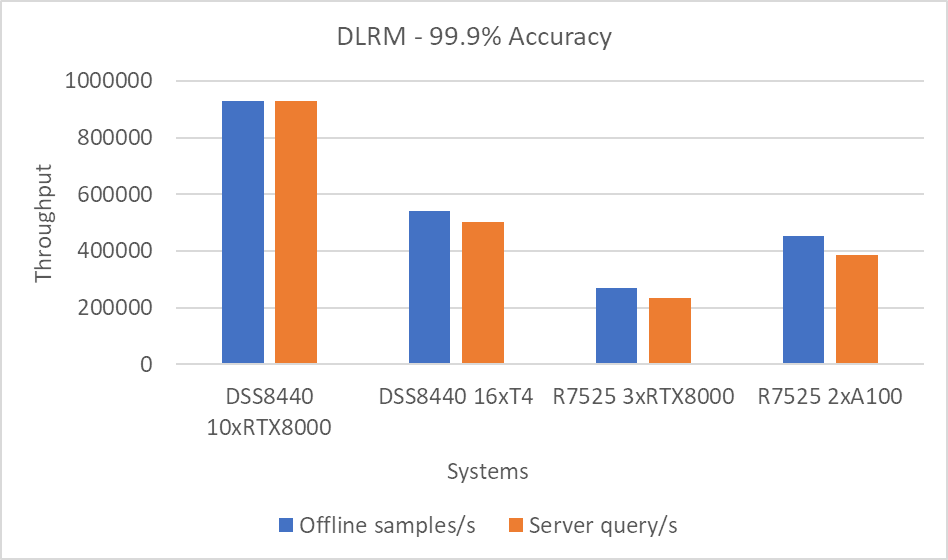
Figure 4: DLRM Offline and Server scenario with 99.9 percent accuracy target
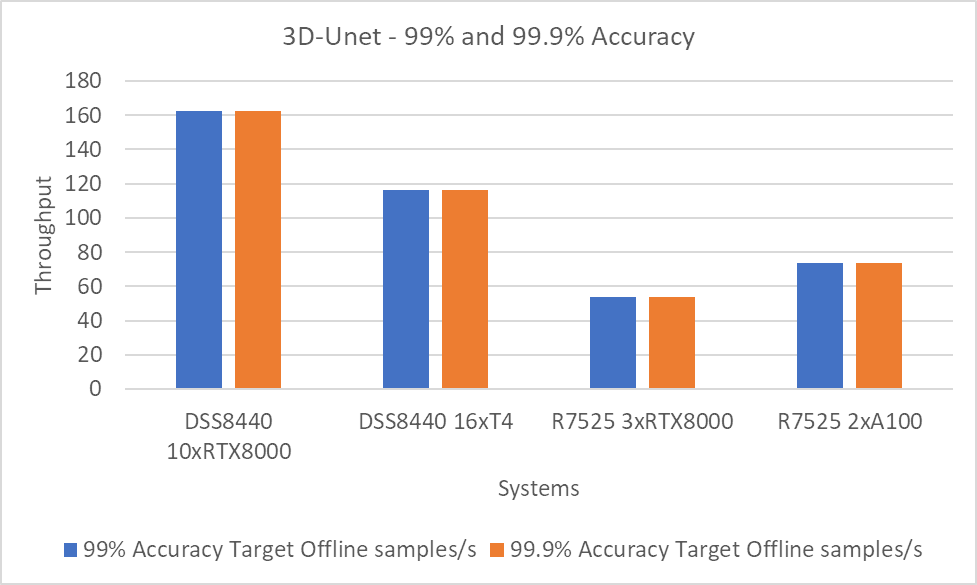
Figure 5: 3D-Unet using the 99 and 99.9 percent accuracy targets.
Note: The 99 and 99.9 percent accuracy targets with DLRM and 3D-Unet show the same performance because the accuracy targets were met early.
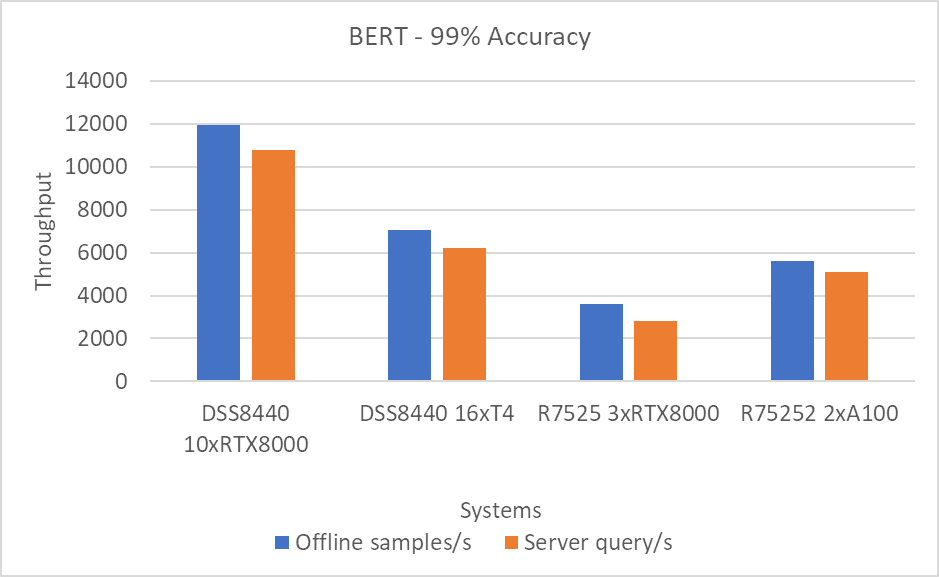
Figure 6: BERT Offline and Server scenario with 99 percent accuracy target
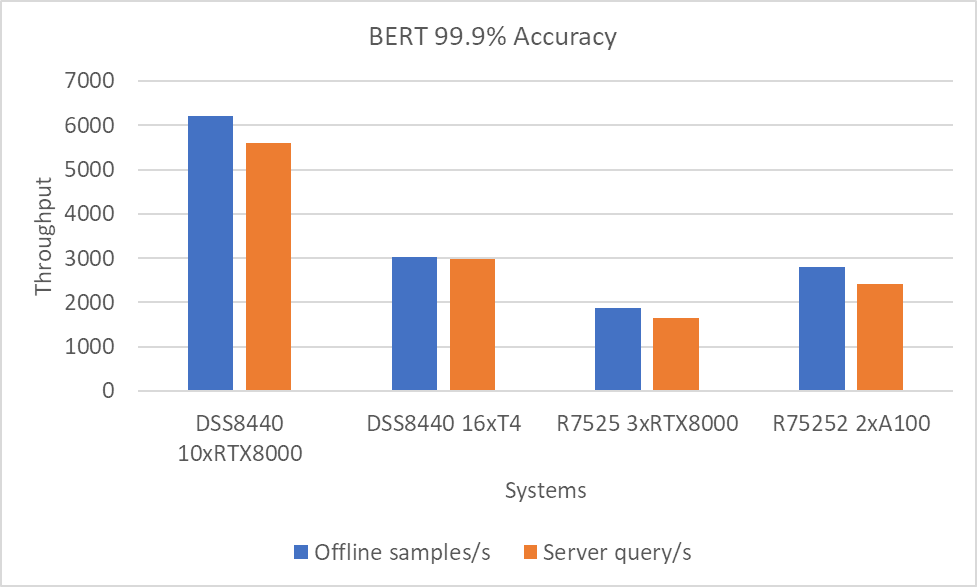
Figure 7: BERT Offline and Server scenario with 99.9 percent accuracy target.
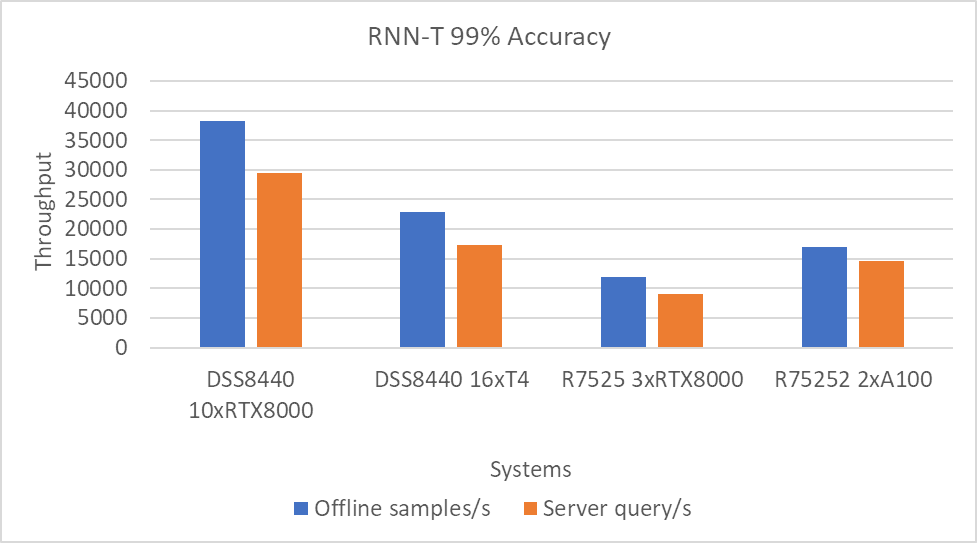
Figure 8: RNN-T Offline and Server scenario with 99 percent accuracy target
Performance per GPU
For an estimate of per GPU performance, we divided the results in the previous section by the number of GPUs on the system. We observed that the performance scales linearly as we increase the number of GPUs. That is, as we add more cards, the performance of the system is multiplied by the number of cards times the performance per card. We will provide this information in a subsequent blog post.
The following figure shows the approximate per GPU performance:
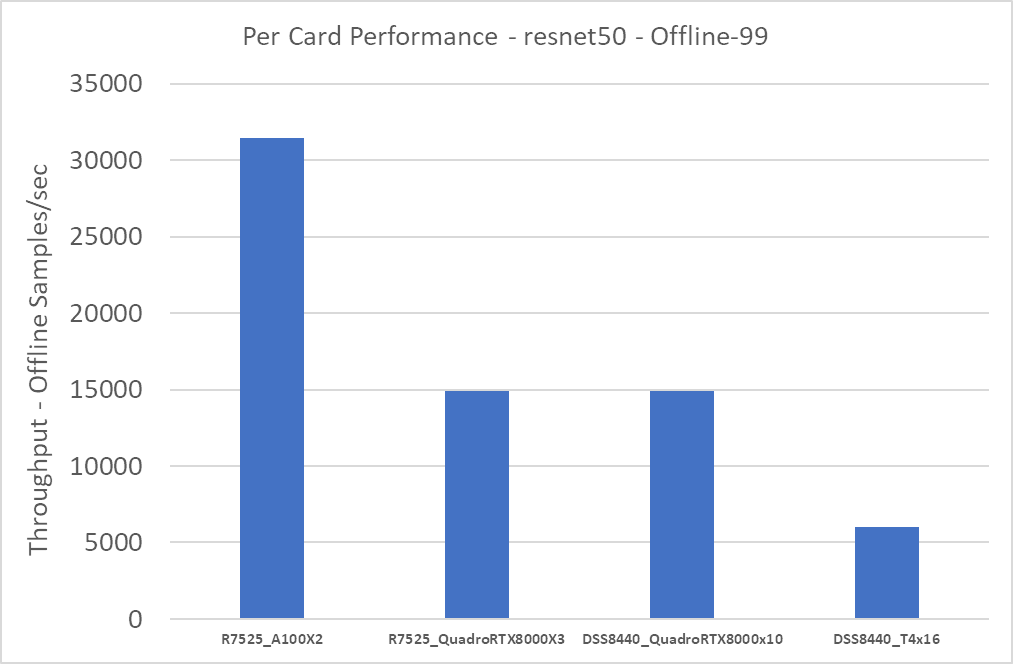
Figure 9: Approximate per card performance for the Resnet50 Offline scenario
The R7525_QuadroRTX8000x3 and DSS8440_QuadroRTX8000x10 systems both use the RTX8000 card. Therefore, performance per card for these two systems is about the same. The A100 cards yield the highest performance; the T4 cards yield the lowest performance.
Conclusion
In this blog, we quantified the MLPerf inference v0.7 performance on Dell EMC DSS8440 and PowerEdge R7525 severs with NVIDIA A100, RTX8000, and T4 GPUs with Resnet50, SSD w/ Resnet34, DLRM, BERT, RNN-T, and 3D-Unet benchmarks. These benchmarks span tasks from vision to recommendation. Dell EMC servers delivered top inference performance normalized to processor count among commercially available results. We found that the A100 GPU delivered the best overall performance and best performance-per-watt while the RTX GPUs delivered the best performance-per-dollar. If constrained in a limited power environment, T4 GPUs deliver the best performance-per-watt.
Next steps
In future blogs, we plan to describe how to:
- Run and performance tune MLPerf inference v0.7
- Size the system (server and GPU configurations) correctly based on the type of workload (area and task)
- Understand per-card, per-watt, and per-dollar metrics to determine your infrastructure needs
- Understand MLPerf training results on recently released R7525 PowerEdge servers with NVIDIA A100 GPUs